Free Statistics

of Irreproducible Research!

Author's title

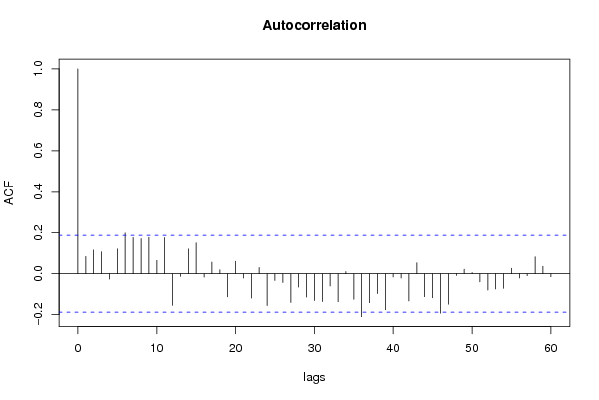
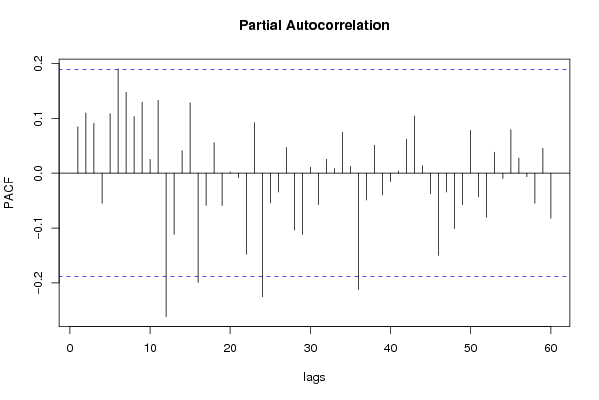
(Partial) Autocorrelation voor het aantal faillissementen in het Vlaamse Ge...

Author*The author of this computation has been verified*
R Software Modulerwasp_autocorrelation.wasp
Title produced by software(Partial) Autocorrelation Function
Date of computationFri, 12 Dec 2008 02:46:16 -0700
Cite this page as followsStatistical Computations at FreeStatistics.org, Office for Research Development and Education, URL https://freestatistics.org/blog/index.php?v=date/2008/Dec/12/t1229075211nwli8wnhvrxyues.htm/, Retrieved Fri, 17 May 2024 18:15:26 +0000
Statistical Computations at FreeStatistics.org, Office for Research Development and Education, URL https://freestatistics.org/blog/index.php?pk=32504, Retrieved Fri, 17 May 2024 18:15:26 +0000
QR Codes:

Original text written by user:
IsPrivate?No (this computation is public)
User-defined keywords
Estimated Impact221
Family? (F = Feedback message, R = changed R code, M = changed R Module, P = changed Parameters, D = changed Data)
-     [(Partial) Autocorrelation Function] [(Partial) Autocor...] [2008-12-11 14:56:15] [87cabf13a90315c7085b765dcebb7412]
-   P   [(Partial) Autocorrelation Function] [(Partial) Autocor...] [2008-12-11 15:06:01] [87cabf13a90315c7085b765dcebb7412]
-   PD    [(Partial) Autocorrelation Function] [(Partial) Autocor...] [2008-12-11 15:23:01] [87cabf13a90315c7085b765dcebb7412]
-   P       [(Partial) Autocorrelation Function] [(Partial) Autocor...] [2008-12-12 09:41:51] [87cabf13a90315c7085b765dcebb7412]
-   P           [(Partial) Autocorrelation Function] [(Partial) Autocor...] [2008-12-12 09:46:16] [6fc58909ffe15c247a4f6748c8841ab4] [Current]
Feedback Forum

Post a new message
Dataseries X:
293
301
362
330
328
405
232
159
336
361
329
339
290
328
375
294
340
364
248
145
380
305
291
319
334
318
362
296
300
342
215
185
343
333
316
252
320
324
343
295
301
367
196
182
342
361
334
330
345
323
366
323
316
358
235
169
430
409
407
341
326
374
364
349
300
385
304
196
443
414
325
388
356
386
444
387
327
448
225
182
460
411
342
361
377
331
428
340
352
461
221
198
422
329
320
375
364
351
380
319
322
386
221
187
344
342
365
313
356
337
389
326
343
357
220
218
391
425
332
298


Summary of computational transaction
Raw Inputview raw input (R code)
Raw Outputview raw output of R engine
Computing time4 seconds
R Server'Herman Ole Andreas Wold' @ 193.190.124.10:1001

\begin{tabular}{lllllllll}
\hline
Summary of computational transaction \tabularnewline
Raw Input & view raw input (R code)  \tabularnewline
Raw Output & view raw output of R engine  \tabularnewline
Computing time & 4 seconds \tabularnewline
R Server & 'Herman Ole Andreas Wold' @ 193.190.124.10:1001 \tabularnewline
\hline
\end{tabular}
%Source: https://freestatistics.org/blog/index.php?pk=32504&T=0

[TABLE]
[ROW][C]Summary of computational transaction[/C][/ROW]
[ROW][C]Raw Input[/C][C]view raw input (R code) [/C][/ROW]
[ROW][C]Raw Output[/C][C]view raw output of R engine [/C][/ROW]
[ROW][C]Computing time[/C][C]4 seconds[/C][/ROW]
[ROW][C]R Server[/C][C]'Herman Ole Andreas Wold' @ 193.190.124.10:1001[/C][/ROW]
[/TABLE]
Source: https://freestatistics.org/blog/index.php?pk=32504&T=0

Globally Unique Identifier (entire table): ba.freestatistics.org/blog/index.php?pk=32504&T=0

As an alternative you can also use a QR Code:  

The GUIDs for individual cells are displayed in the table below:

Summary of computational transaction
Raw Inputview raw input (R code)
Raw Outputview raw output of R engine
Computing time4 seconds
R Server'Herman Ole Andreas Wold' @ 193.190.124.10:1001


Autocorrelation Function
Time lag kACF(k)T-STATP-value
10.0843540.87660.191315
20.1161171.20670.115089
30.1073761.11590.133473
4-0.026661-0.27710.391127
50.1215951.26370.104538
60.1994092.07230.020308
70.1771641.84110.034173
80.1712391.77960.03898
90.1778291.84810.033665
100.0650180.67570.250342
110.1770711.84020.034245
12-0.154658-1.60730.05546
13-0.012916-0.13420.446735
140.1211311.25880.105404
150.1510931.57020.059646
16-0.016969-0.17630.430177
170.0568650.5910.277891
180.0193340.20090.420566
19-0.113359-1.17810.12068
200.0606990.63080.264753
21-0.021385-0.22220.412273
22-0.119275-1.23950.108915
230.0303330.31520.376597
24-0.155883-1.620.054076
25-0.033343-0.34650.364817
26-0.042814-0.44490.328627
27-0.140593-1.46110.073448
28-0.065841-0.68420.247646
29-0.114288-1.18770.118776
30-0.13173-1.3690.086923
31-0.136456-1.41810.079522
32-0.060417-0.62790.265707
33-0.137037-1.42410.078646
340.0104240.10830.456967
35-0.125424-1.30340.097598
36-0.21016-2.1840.015561
37-0.142083-1.47660.071351
38-0.097193-1.01010.157362
39-0.176775-1.83710.034472
40-0.016048-0.16680.43393
41-0.021628-0.22480.411293
42-0.133573-1.38810.083977
430.0536930.5580.289003
44-0.112522-1.16940.122417
45-0.117853-1.22480.111665
46-0.193441-2.01030.023446
47-0.149444-1.55310.061667
48-0.00874-0.09080.463898
490.0219760.22840.409891
500.0050960.0530.478933
51-0.039759-0.41320.340146
52-0.080196-0.83340.203223
53-0.074719-0.77650.219574
54-0.071444-0.74250.229708
550.0268650.27920.390319
56-0.020741-0.21550.414873
57-0.010013-0.10410.458656
580.0826610.8590.196112
590.0357070.37110.355651
60-0.015091-0.15680.437837

\begin{tabular}{lllllllll}
\hline
Autocorrelation Function \tabularnewline
Time lag k & ACF(k) & T-STAT & P-value \tabularnewline
1 & 0.084354 & 0.8766 & 0.191315 \tabularnewline
2 & 0.116117 & 1.2067 & 0.115089 \tabularnewline
3 & 0.107376 & 1.1159 & 0.133473 \tabularnewline
4 & -0.026661 & -0.2771 & 0.391127 \tabularnewline
5 & 0.121595 & 1.2637 & 0.104538 \tabularnewline
6 & 0.199409 & 2.0723 & 0.020308 \tabularnewline
7 & 0.177164 & 1.8411 & 0.034173 \tabularnewline
8 & 0.171239 & 1.7796 & 0.03898 \tabularnewline
9 & 0.177829 & 1.8481 & 0.033665 \tabularnewline
10 & 0.065018 & 0.6757 & 0.250342 \tabularnewline
11 & 0.177071 & 1.8402 & 0.034245 \tabularnewline
12 & -0.154658 & -1.6073 & 0.05546 \tabularnewline
13 & -0.012916 & -0.1342 & 0.446735 \tabularnewline
14 & 0.121131 & 1.2588 & 0.105404 \tabularnewline
15 & 0.151093 & 1.5702 & 0.059646 \tabularnewline
16 & -0.016969 & -0.1763 & 0.430177 \tabularnewline
17 & 0.056865 & 0.591 & 0.277891 \tabularnewline
18 & 0.019334 & 0.2009 & 0.420566 \tabularnewline
19 & -0.113359 & -1.1781 & 0.12068 \tabularnewline
20 & 0.060699 & 0.6308 & 0.264753 \tabularnewline
21 & -0.021385 & -0.2222 & 0.412273 \tabularnewline
22 & -0.119275 & -1.2395 & 0.108915 \tabularnewline
23 & 0.030333 & 0.3152 & 0.376597 \tabularnewline
24 & -0.155883 & -1.62 & 0.054076 \tabularnewline
25 & -0.033343 & -0.3465 & 0.364817 \tabularnewline
26 & -0.042814 & -0.4449 & 0.328627 \tabularnewline
27 & -0.140593 & -1.4611 & 0.073448 \tabularnewline
28 & -0.065841 & -0.6842 & 0.247646 \tabularnewline
29 & -0.114288 & -1.1877 & 0.118776 \tabularnewline
30 & -0.13173 & -1.369 & 0.086923 \tabularnewline
31 & -0.136456 & -1.4181 & 0.079522 \tabularnewline
32 & -0.060417 & -0.6279 & 0.265707 \tabularnewline
33 & -0.137037 & -1.4241 & 0.078646 \tabularnewline
34 & 0.010424 & 0.1083 & 0.456967 \tabularnewline
35 & -0.125424 & -1.3034 & 0.097598 \tabularnewline
36 & -0.21016 & -2.184 & 0.015561 \tabularnewline
37 & -0.142083 & -1.4766 & 0.071351 \tabularnewline
38 & -0.097193 & -1.0101 & 0.157362 \tabularnewline
39 & -0.176775 & -1.8371 & 0.034472 \tabularnewline
40 & -0.016048 & -0.1668 & 0.43393 \tabularnewline
41 & -0.021628 & -0.2248 & 0.411293 \tabularnewline
42 & -0.133573 & -1.3881 & 0.083977 \tabularnewline
43 & 0.053693 & 0.558 & 0.289003 \tabularnewline
44 & -0.112522 & -1.1694 & 0.122417 \tabularnewline
45 & -0.117853 & -1.2248 & 0.111665 \tabularnewline
46 & -0.193441 & -2.0103 & 0.023446 \tabularnewline
47 & -0.149444 & -1.5531 & 0.061667 \tabularnewline
48 & -0.00874 & -0.0908 & 0.463898 \tabularnewline
49 & 0.021976 & 0.2284 & 0.409891 \tabularnewline
50 & 0.005096 & 0.053 & 0.478933 \tabularnewline
51 & -0.039759 & -0.4132 & 0.340146 \tabularnewline
52 & -0.080196 & -0.8334 & 0.203223 \tabularnewline
53 & -0.074719 & -0.7765 & 0.219574 \tabularnewline
54 & -0.071444 & -0.7425 & 0.229708 \tabularnewline
55 & 0.026865 & 0.2792 & 0.390319 \tabularnewline
56 & -0.020741 & -0.2155 & 0.414873 \tabularnewline
57 & -0.010013 & -0.1041 & 0.458656 \tabularnewline
58 & 0.082661 & 0.859 & 0.196112 \tabularnewline
59 & 0.035707 & 0.3711 & 0.355651 \tabularnewline
60 & -0.015091 & -0.1568 & 0.437837 \tabularnewline
\hline
\end{tabular}
%Source: https://freestatistics.org/blog/index.php?pk=32504&T=1

[TABLE]
[ROW][C]Autocorrelation Function[/C][/ROW]
[ROW][C]Time lag k[/C][C]ACF(k)[/C][C]T-STAT[/C][C]P-value[/C][/ROW]
[ROW][C]1[/C][C]0.084354[/C][C]0.8766[/C][C]0.191315[/C][/ROW]
[ROW][C]2[/C][C]0.116117[/C][C]1.2067[/C][C]0.115089[/C][/ROW]
[ROW][C]3[/C][C]0.107376[/C][C]1.1159[/C][C]0.133473[/C][/ROW]
[ROW][C]4[/C][C]-0.026661[/C][C]-0.2771[/C][C]0.391127[/C][/ROW]
[ROW][C]5[/C][C]0.121595[/C][C]1.2637[/C][C]0.104538[/C][/ROW]
[ROW][C]6[/C][C]0.199409[/C][C]2.0723[/C][C]0.020308[/C][/ROW]
[ROW][C]7[/C][C]0.177164[/C][C]1.8411[/C][C]0.034173[/C][/ROW]
[ROW][C]8[/C][C]0.171239[/C][C]1.7796[/C][C]0.03898[/C][/ROW]
[ROW][C]9[/C][C]0.177829[/C][C]1.8481[/C][C]0.033665[/C][/ROW]
[ROW][C]10[/C][C]0.065018[/C][C]0.6757[/C][C]0.250342[/C][/ROW]
[ROW][C]11[/C][C]0.177071[/C][C]1.8402[/C][C]0.034245[/C][/ROW]
[ROW][C]12[/C][C]-0.154658[/C][C]-1.6073[/C][C]0.05546[/C][/ROW]
[ROW][C]13[/C][C]-0.012916[/C][C]-0.1342[/C][C]0.446735[/C][/ROW]
[ROW][C]14[/C][C]0.121131[/C][C]1.2588[/C][C]0.105404[/C][/ROW]
[ROW][C]15[/C][C]0.151093[/C][C]1.5702[/C][C]0.059646[/C][/ROW]
[ROW][C]16[/C][C]-0.016969[/C][C]-0.1763[/C][C]0.430177[/C][/ROW]
[ROW][C]17[/C][C]0.056865[/C][C]0.591[/C][C]0.277891[/C][/ROW]
[ROW][C]18[/C][C]0.019334[/C][C]0.2009[/C][C]0.420566[/C][/ROW]
[ROW][C]19[/C][C]-0.113359[/C][C]-1.1781[/C][C]0.12068[/C][/ROW]
[ROW][C]20[/C][C]0.060699[/C][C]0.6308[/C][C]0.264753[/C][/ROW]
[ROW][C]21[/C][C]-0.021385[/C][C]-0.2222[/C][C]0.412273[/C][/ROW]
[ROW][C]22[/C][C]-0.119275[/C][C]-1.2395[/C][C]0.108915[/C][/ROW]
[ROW][C]23[/C][C]0.030333[/C][C]0.3152[/C][C]0.376597[/C][/ROW]
[ROW][C]24[/C][C]-0.155883[/C][C]-1.62[/C][C]0.054076[/C][/ROW]
[ROW][C]25[/C][C]-0.033343[/C][C]-0.3465[/C][C]0.364817[/C][/ROW]
[ROW][C]26[/C][C]-0.042814[/C][C]-0.4449[/C][C]0.328627[/C][/ROW]
[ROW][C]27[/C][C]-0.140593[/C][C]-1.4611[/C][C]0.073448[/C][/ROW]
[ROW][C]28[/C][C]-0.065841[/C][C]-0.6842[/C][C]0.247646[/C][/ROW]
[ROW][C]29[/C][C]-0.114288[/C][C]-1.1877[/C][C]0.118776[/C][/ROW]
[ROW][C]30[/C][C]-0.13173[/C][C]-1.369[/C][C]0.086923[/C][/ROW]
[ROW][C]31[/C][C]-0.136456[/C][C]-1.4181[/C][C]0.079522[/C][/ROW]
[ROW][C]32[/C][C]-0.060417[/C][C]-0.6279[/C][C]0.265707[/C][/ROW]
[ROW][C]33[/C][C]-0.137037[/C][C]-1.4241[/C][C]0.078646[/C][/ROW]
[ROW][C]34[/C][C]0.010424[/C][C]0.1083[/C][C]0.456967[/C][/ROW]
[ROW][C]35[/C][C]-0.125424[/C][C]-1.3034[/C][C]0.097598[/C][/ROW]
[ROW][C]36[/C][C]-0.21016[/C][C]-2.184[/C][C]0.015561[/C][/ROW]
[ROW][C]37[/C][C]-0.142083[/C][C]-1.4766[/C][C]0.071351[/C][/ROW]
[ROW][C]38[/C][C]-0.097193[/C][C]-1.0101[/C][C]0.157362[/C][/ROW]
[ROW][C]39[/C][C]-0.176775[/C][C]-1.8371[/C][C]0.034472[/C][/ROW]
[ROW][C]40[/C][C]-0.016048[/C][C]-0.1668[/C][C]0.43393[/C][/ROW]
[ROW][C]41[/C][C]-0.021628[/C][C]-0.2248[/C][C]0.411293[/C][/ROW]
[ROW][C]42[/C][C]-0.133573[/C][C]-1.3881[/C][C]0.083977[/C][/ROW]
[ROW][C]43[/C][C]0.053693[/C][C]0.558[/C][C]0.289003[/C][/ROW]
[ROW][C]44[/C][C]-0.112522[/C][C]-1.1694[/C][C]0.122417[/C][/ROW]
[ROW][C]45[/C][C]-0.117853[/C][C]-1.2248[/C][C]0.111665[/C][/ROW]
[ROW][C]46[/C][C]-0.193441[/C][C]-2.0103[/C][C]0.023446[/C][/ROW]
[ROW][C]47[/C][C]-0.149444[/C][C]-1.5531[/C][C]0.061667[/C][/ROW]
[ROW][C]48[/C][C]-0.00874[/C][C]-0.0908[/C][C]0.463898[/C][/ROW]
[ROW][C]49[/C][C]0.021976[/C][C]0.2284[/C][C]0.409891[/C][/ROW]
[ROW][C]50[/C][C]0.005096[/C][C]0.053[/C][C]0.478933[/C][/ROW]
[ROW][C]51[/C][C]-0.039759[/C][C]-0.4132[/C][C]0.340146[/C][/ROW]
[ROW][C]52[/C][C]-0.080196[/C][C]-0.8334[/C][C]0.203223[/C][/ROW]
[ROW][C]53[/C][C]-0.074719[/C][C]-0.7765[/C][C]0.219574[/C][/ROW]
[ROW][C]54[/C][C]-0.071444[/C][C]-0.7425[/C][C]0.229708[/C][/ROW]
[ROW][C]55[/C][C]0.026865[/C][C]0.2792[/C][C]0.390319[/C][/ROW]
[ROW][C]56[/C][C]-0.020741[/C][C]-0.2155[/C][C]0.414873[/C][/ROW]
[ROW][C]57[/C][C]-0.010013[/C][C]-0.1041[/C][C]0.458656[/C][/ROW]
[ROW][C]58[/C][C]0.082661[/C][C]0.859[/C][C]0.196112[/C][/ROW]
[ROW][C]59[/C][C]0.035707[/C][C]0.3711[/C][C]0.355651[/C][/ROW]
[ROW][C]60[/C][C]-0.015091[/C][C]-0.1568[/C][C]0.437837[/C][/ROW]
[/TABLE]
Source: https://freestatistics.org/blog/index.php?pk=32504&T=1

Globally Unique Identifier (entire table): ba.freestatistics.org/blog/index.php?pk=32504&T=1

As an alternative you can also use a QR Code:  

The GUIDs for individual cells are displayed in the table below:

Autocorrelation Function
Time lag kACF(k)T-STATP-value
10.0843540.87660.191315
20.1161171.20670.115089
30.1073761.11590.133473
4-0.026661-0.27710.391127
50.1215951.26370.104538
60.1994092.07230.020308
70.1771641.84110.034173
80.1712391.77960.03898
90.1778291.84810.033665
100.0650180.67570.250342
110.1770711.84020.034245
12-0.154658-1.60730.05546
13-0.012916-0.13420.446735
140.1211311.25880.105404
150.1510931.57020.059646
16-0.016969-0.17630.430177
170.0568650.5910.277891
180.0193340.20090.420566
19-0.113359-1.17810.12068
200.0606990.63080.264753
21-0.021385-0.22220.412273
22-0.119275-1.23950.108915
230.0303330.31520.376597
24-0.155883-1.620.054076
25-0.033343-0.34650.364817
26-0.042814-0.44490.328627
27-0.140593-1.46110.073448
28-0.065841-0.68420.247646
29-0.114288-1.18770.118776
30-0.13173-1.3690.086923
31-0.136456-1.41810.079522
32-0.060417-0.62790.265707
33-0.137037-1.42410.078646
340.0104240.10830.456967
35-0.125424-1.30340.097598
36-0.21016-2.1840.015561
37-0.142083-1.47660.071351
38-0.097193-1.01010.157362
39-0.176775-1.83710.034472
40-0.016048-0.16680.43393
41-0.021628-0.22480.411293
42-0.133573-1.38810.083977
430.0536930.5580.289003
44-0.112522-1.16940.122417
45-0.117853-1.22480.111665
46-0.193441-2.01030.023446
47-0.149444-1.55310.061667
48-0.00874-0.09080.463898
490.0219760.22840.409891
500.0050960.0530.478933
51-0.039759-0.41320.340146
52-0.080196-0.83340.203223
53-0.074719-0.77650.219574
54-0.071444-0.74250.229708
550.0268650.27920.390319
56-0.020741-0.21550.414873
57-0.010013-0.10410.458656
580.0826610.8590.196112
590.0357070.37110.355651
60-0.015091-0.15680.437837


Partial Autocorrelation Function
Time lag kPACF(k)T-STATP-value
10.0843540.87660.191315
20.1097821.14090.12822
30.0911350.94710.17285
4-0.054783-0.56930.285162
50.1087071.12970.130549
60.1898581.97310.025522
70.1474911.53280.064128
80.1031651.07210.143027
90.1293831.34460.090788
100.0249880.25970.397801
110.1324111.37610.085825
12-0.261377-2.71630.003845
13-0.111343-1.15710.12489
140.0410060.42620.335423
150.1280571.33080.093028
16-0.199273-2.07090.020376
17-0.058495-0.60790.272266
180.0554810.57660.282713
19-0.058849-0.61160.271051
200.0023060.0240.490462
21-0.008335-0.08660.465566
22-0.147627-1.53420.063954
230.091940.95550.170736
24-0.224979-2.3380.010613
25-0.054324-0.56460.286774
26-0.034322-0.35670.361012
270.0466490.48480.314405
28-0.103308-1.07360.142696
29-0.111906-1.1630.123704
300.0108980.11330.455018
31-0.05725-0.5950.276557
320.0253570.26350.396326
330.0087330.09080.463929
340.0745770.7750.220008
350.0123970.12880.448865
36-0.212081-2.2040.014823
37-0.048833-0.50750.306424
380.0508320.52830.2992
39-0.039757-0.41320.340153
40-0.015265-0.15860.437124
410.0041330.04290.482912
420.0621080.64540.260004
430.1040271.08110.141036
440.0137350.14270.443382
45-0.037692-0.39170.348024
46-0.149537-1.5540.061551
47-0.034129-0.35470.361762
48-0.100955-1.04920.148225
49-0.05761-0.59870.275314
500.0777980.80850.21029
51-0.043391-0.45090.326472
52-0.080115-0.83260.203459
530.0381230.39620.346375
54-0.009744-0.10130.459765
550.0793360.82450.205742
560.0274260.2850.388087
57-0.00668-0.06940.472391
58-0.054913-0.57070.284704
590.0451710.46940.319854
60-0.082021-0.85240.197944

\begin{tabular}{lllllllll}
\hline
Partial Autocorrelation Function \tabularnewline
Time lag k & PACF(k) & T-STAT & P-value \tabularnewline
1 & 0.084354 & 0.8766 & 0.191315 \tabularnewline
2 & 0.109782 & 1.1409 & 0.12822 \tabularnewline
3 & 0.091135 & 0.9471 & 0.17285 \tabularnewline
4 & -0.054783 & -0.5693 & 0.285162 \tabularnewline
5 & 0.108707 & 1.1297 & 0.130549 \tabularnewline
6 & 0.189858 & 1.9731 & 0.025522 \tabularnewline
7 & 0.147491 & 1.5328 & 0.064128 \tabularnewline
8 & 0.103165 & 1.0721 & 0.143027 \tabularnewline
9 & 0.129383 & 1.3446 & 0.090788 \tabularnewline
10 & 0.024988 & 0.2597 & 0.397801 \tabularnewline
11 & 0.132411 & 1.3761 & 0.085825 \tabularnewline
12 & -0.261377 & -2.7163 & 0.003845 \tabularnewline
13 & -0.111343 & -1.1571 & 0.12489 \tabularnewline
14 & 0.041006 & 0.4262 & 0.335423 \tabularnewline
15 & 0.128057 & 1.3308 & 0.093028 \tabularnewline
16 & -0.199273 & -2.0709 & 0.020376 \tabularnewline
17 & -0.058495 & -0.6079 & 0.272266 \tabularnewline
18 & 0.055481 & 0.5766 & 0.282713 \tabularnewline
19 & -0.058849 & -0.6116 & 0.271051 \tabularnewline
20 & 0.002306 & 0.024 & 0.490462 \tabularnewline
21 & -0.008335 & -0.0866 & 0.465566 \tabularnewline
22 & -0.147627 & -1.5342 & 0.063954 \tabularnewline
23 & 0.09194 & 0.9555 & 0.170736 \tabularnewline
24 & -0.224979 & -2.338 & 0.010613 \tabularnewline
25 & -0.054324 & -0.5646 & 0.286774 \tabularnewline
26 & -0.034322 & -0.3567 & 0.361012 \tabularnewline
27 & 0.046649 & 0.4848 & 0.314405 \tabularnewline
28 & -0.103308 & -1.0736 & 0.142696 \tabularnewline
29 & -0.111906 & -1.163 & 0.123704 \tabularnewline
30 & 0.010898 & 0.1133 & 0.455018 \tabularnewline
31 & -0.05725 & -0.595 & 0.276557 \tabularnewline
32 & 0.025357 & 0.2635 & 0.396326 \tabularnewline
33 & 0.008733 & 0.0908 & 0.463929 \tabularnewline
34 & 0.074577 & 0.775 & 0.220008 \tabularnewline
35 & 0.012397 & 0.1288 & 0.448865 \tabularnewline
36 & -0.212081 & -2.204 & 0.014823 \tabularnewline
37 & -0.048833 & -0.5075 & 0.306424 \tabularnewline
38 & 0.050832 & 0.5283 & 0.2992 \tabularnewline
39 & -0.039757 & -0.4132 & 0.340153 \tabularnewline
40 & -0.015265 & -0.1586 & 0.437124 \tabularnewline
41 & 0.004133 & 0.0429 & 0.482912 \tabularnewline
42 & 0.062108 & 0.6454 & 0.260004 \tabularnewline
43 & 0.104027 & 1.0811 & 0.141036 \tabularnewline
44 & 0.013735 & 0.1427 & 0.443382 \tabularnewline
45 & -0.037692 & -0.3917 & 0.348024 \tabularnewline
46 & -0.149537 & -1.554 & 0.061551 \tabularnewline
47 & -0.034129 & -0.3547 & 0.361762 \tabularnewline
48 & -0.100955 & -1.0492 & 0.148225 \tabularnewline
49 & -0.05761 & -0.5987 & 0.275314 \tabularnewline
50 & 0.077798 & 0.8085 & 0.21029 \tabularnewline
51 & -0.043391 & -0.4509 & 0.326472 \tabularnewline
52 & -0.080115 & -0.8326 & 0.203459 \tabularnewline
53 & 0.038123 & 0.3962 & 0.346375 \tabularnewline
54 & -0.009744 & -0.1013 & 0.459765 \tabularnewline
55 & 0.079336 & 0.8245 & 0.205742 \tabularnewline
56 & 0.027426 & 0.285 & 0.388087 \tabularnewline
57 & -0.00668 & -0.0694 & 0.472391 \tabularnewline
58 & -0.054913 & -0.5707 & 0.284704 \tabularnewline
59 & 0.045171 & 0.4694 & 0.319854 \tabularnewline
60 & -0.082021 & -0.8524 & 0.197944 \tabularnewline
\hline
\end{tabular}
%Source: https://freestatistics.org/blog/index.php?pk=32504&T=2

[TABLE]
[ROW][C]Partial Autocorrelation Function[/C][/ROW]
[ROW][C]Time lag k[/C][C]PACF(k)[/C][C]T-STAT[/C][C]P-value[/C][/ROW]
[ROW][C]1[/C][C]0.084354[/C][C]0.8766[/C][C]0.191315[/C][/ROW]
[ROW][C]2[/C][C]0.109782[/C][C]1.1409[/C][C]0.12822[/C][/ROW]
[ROW][C]3[/C][C]0.091135[/C][C]0.9471[/C][C]0.17285[/C][/ROW]
[ROW][C]4[/C][C]-0.054783[/C][C]-0.5693[/C][C]0.285162[/C][/ROW]
[ROW][C]5[/C][C]0.108707[/C][C]1.1297[/C][C]0.130549[/C][/ROW]
[ROW][C]6[/C][C]0.189858[/C][C]1.9731[/C][C]0.025522[/C][/ROW]
[ROW][C]7[/C][C]0.147491[/C][C]1.5328[/C][C]0.064128[/C][/ROW]
[ROW][C]8[/C][C]0.103165[/C][C]1.0721[/C][C]0.143027[/C][/ROW]
[ROW][C]9[/C][C]0.129383[/C][C]1.3446[/C][C]0.090788[/C][/ROW]
[ROW][C]10[/C][C]0.024988[/C][C]0.2597[/C][C]0.397801[/C][/ROW]
[ROW][C]11[/C][C]0.132411[/C][C]1.3761[/C][C]0.085825[/C][/ROW]
[ROW][C]12[/C][C]-0.261377[/C][C]-2.7163[/C][C]0.003845[/C][/ROW]
[ROW][C]13[/C][C]-0.111343[/C][C]-1.1571[/C][C]0.12489[/C][/ROW]
[ROW][C]14[/C][C]0.041006[/C][C]0.4262[/C][C]0.335423[/C][/ROW]
[ROW][C]15[/C][C]0.128057[/C][C]1.3308[/C][C]0.093028[/C][/ROW]
[ROW][C]16[/C][C]-0.199273[/C][C]-2.0709[/C][C]0.020376[/C][/ROW]
[ROW][C]17[/C][C]-0.058495[/C][C]-0.6079[/C][C]0.272266[/C][/ROW]
[ROW][C]18[/C][C]0.055481[/C][C]0.5766[/C][C]0.282713[/C][/ROW]
[ROW][C]19[/C][C]-0.058849[/C][C]-0.6116[/C][C]0.271051[/C][/ROW]
[ROW][C]20[/C][C]0.002306[/C][C]0.024[/C][C]0.490462[/C][/ROW]
[ROW][C]21[/C][C]-0.008335[/C][C]-0.0866[/C][C]0.465566[/C][/ROW]
[ROW][C]22[/C][C]-0.147627[/C][C]-1.5342[/C][C]0.063954[/C][/ROW]
[ROW][C]23[/C][C]0.09194[/C][C]0.9555[/C][C]0.170736[/C][/ROW]
[ROW][C]24[/C][C]-0.224979[/C][C]-2.338[/C][C]0.010613[/C][/ROW]
[ROW][C]25[/C][C]-0.054324[/C][C]-0.5646[/C][C]0.286774[/C][/ROW]
[ROW][C]26[/C][C]-0.034322[/C][C]-0.3567[/C][C]0.361012[/C][/ROW]
[ROW][C]27[/C][C]0.046649[/C][C]0.4848[/C][C]0.314405[/C][/ROW]
[ROW][C]28[/C][C]-0.103308[/C][C]-1.0736[/C][C]0.142696[/C][/ROW]
[ROW][C]29[/C][C]-0.111906[/C][C]-1.163[/C][C]0.123704[/C][/ROW]
[ROW][C]30[/C][C]0.010898[/C][C]0.1133[/C][C]0.455018[/C][/ROW]
[ROW][C]31[/C][C]-0.05725[/C][C]-0.595[/C][C]0.276557[/C][/ROW]
[ROW][C]32[/C][C]0.025357[/C][C]0.2635[/C][C]0.396326[/C][/ROW]
[ROW][C]33[/C][C]0.008733[/C][C]0.0908[/C][C]0.463929[/C][/ROW]
[ROW][C]34[/C][C]0.074577[/C][C]0.775[/C][C]0.220008[/C][/ROW]
[ROW][C]35[/C][C]0.012397[/C][C]0.1288[/C][C]0.448865[/C][/ROW]
[ROW][C]36[/C][C]-0.212081[/C][C]-2.204[/C][C]0.014823[/C][/ROW]
[ROW][C]37[/C][C]-0.048833[/C][C]-0.5075[/C][C]0.306424[/C][/ROW]
[ROW][C]38[/C][C]0.050832[/C][C]0.5283[/C][C]0.2992[/C][/ROW]
[ROW][C]39[/C][C]-0.039757[/C][C]-0.4132[/C][C]0.340153[/C][/ROW]
[ROW][C]40[/C][C]-0.015265[/C][C]-0.1586[/C][C]0.437124[/C][/ROW]
[ROW][C]41[/C][C]0.004133[/C][C]0.0429[/C][C]0.482912[/C][/ROW]
[ROW][C]42[/C][C]0.062108[/C][C]0.6454[/C][C]0.260004[/C][/ROW]
[ROW][C]43[/C][C]0.104027[/C][C]1.0811[/C][C]0.141036[/C][/ROW]
[ROW][C]44[/C][C]0.013735[/C][C]0.1427[/C][C]0.443382[/C][/ROW]
[ROW][C]45[/C][C]-0.037692[/C][C]-0.3917[/C][C]0.348024[/C][/ROW]
[ROW][C]46[/C][C]-0.149537[/C][C]-1.554[/C][C]0.061551[/C][/ROW]
[ROW][C]47[/C][C]-0.034129[/C][C]-0.3547[/C][C]0.361762[/C][/ROW]
[ROW][C]48[/C][C]-0.100955[/C][C]-1.0492[/C][C]0.148225[/C][/ROW]
[ROW][C]49[/C][C]-0.05761[/C][C]-0.5987[/C][C]0.275314[/C][/ROW]
[ROW][C]50[/C][C]0.077798[/C][C]0.8085[/C][C]0.21029[/C][/ROW]
[ROW][C]51[/C][C]-0.043391[/C][C]-0.4509[/C][C]0.326472[/C][/ROW]
[ROW][C]52[/C][C]-0.080115[/C][C]-0.8326[/C][C]0.203459[/C][/ROW]
[ROW][C]53[/C][C]0.038123[/C][C]0.3962[/C][C]0.346375[/C][/ROW]
[ROW][C]54[/C][C]-0.009744[/C][C]-0.1013[/C][C]0.459765[/C][/ROW]
[ROW][C]55[/C][C]0.079336[/C][C]0.8245[/C][C]0.205742[/C][/ROW]
[ROW][C]56[/C][C]0.027426[/C][C]0.285[/C][C]0.388087[/C][/ROW]
[ROW][C]57[/C][C]-0.00668[/C][C]-0.0694[/C][C]0.472391[/C][/ROW]
[ROW][C]58[/C][C]-0.054913[/C][C]-0.5707[/C][C]0.284704[/C][/ROW]
[ROW][C]59[/C][C]0.045171[/C][C]0.4694[/C][C]0.319854[/C][/ROW]
[ROW][C]60[/C][C]-0.082021[/C][C]-0.8524[/C][C]0.197944[/C][/ROW]
[/TABLE]
Source: https://freestatistics.org/blog/index.php?pk=32504&T=2

Globally Unique Identifier (entire table): ba.freestatistics.org/blog/index.php?pk=32504&T=2

As an alternative you can also use a QR Code:  

The GUIDs for individual cells are displayed in the table below:

Partial Autocorrelation Function
Time lag kPACF(k)T-STATP-value
10.0843540.87660.191315
20.1097821.14090.12822
30.0911350.94710.17285
4-0.054783-0.56930.285162
50.1087071.12970.130549
60.1898581.97310.025522
70.1474911.53280.064128
80.1031651.07210.143027
90.1293831.34460.090788
100.0249880.25970.397801
110.1324111.37610.085825
12-0.261377-2.71630.003845
13-0.111343-1.15710.12489
140.0410060.42620.335423
150.1280571.33080.093028
16-0.199273-2.07090.020376
17-0.058495-0.60790.272266
180.0554810.57660.282713
19-0.058849-0.61160.271051
200.0023060.0240.490462
21-0.008335-0.08660.465566
22-0.147627-1.53420.063954
230.091940.95550.170736
24-0.224979-2.3380.010613
25-0.054324-0.56460.286774
26-0.034322-0.35670.361012
270.0466490.48480.314405
28-0.103308-1.07360.142696
29-0.111906-1.1630.123704
300.0108980.11330.455018
31-0.05725-0.5950.276557
320.0253570.26350.396326
330.0087330.09080.463929
340.0745770.7750.220008
350.0123970.12880.448865
36-0.212081-2.2040.014823
37-0.048833-0.50750.306424
380.0508320.52830.2992
39-0.039757-0.41320.340153
40-0.015265-0.15860.437124
410.0041330.04290.482912
420.0621080.64540.260004
430.1040271.08110.141036
440.0137350.14270.443382
45-0.037692-0.39170.348024
46-0.149537-1.5540.061551
47-0.034129-0.35470.361762
48-0.100955-1.04920.148225
49-0.05761-0.59870.275314
500.0777980.80850.21029
51-0.043391-0.45090.326472
52-0.080115-0.83260.203459
530.0381230.39620.346375
54-0.009744-0.10130.459765
550.0793360.82450.205742
560.0274260.2850.388087
57-0.00668-0.06940.472391
58-0.054913-0.57070.284704
590.0451710.46940.319854
60-0.082021-0.85240.197944


Parameters (Session):
par1 = 60 ; par2 = 1 ; par3 = 0 ; par4 = 1 ; par5 = 12 ;
Parameters (R input):
par1 = 60 ; par2 = 1 ; par3 = 0 ; par4 = 1 ; par5 = 12 ;
R code (references can be found in the software module):
if (par1 == 'Default') {
par1 = 10*log10(length(x))
} else {
par1 <- as.numeric(par1)
}
par2 <- as.numeric(par2)
par3 <- as.numeric(par3)
par4 <- as.numeric(par4)
par5 <- as.numeric(par5)
if (par2 == 0) {
x <- log(x)
} else {
x <- (x ^ par2 - 1) / par2
}
if (par3 > 0) x <- diff(x,lag=1,difference=par3)
if (par4 > 0) x <- diff(x,lag=par5,difference=par4)
bitmap(file='pic1.png')
racf <- acf(x,par1,main='Autocorrelation',xlab='lags',ylab='ACF')
dev.off()
bitmap(file='pic2.png')
rpacf <- pacf(x,par1,main='Partial Autocorrelation',xlab='lags',ylab='PACF')
dev.off()
(myacf <- c(racf$acf))
(mypacf <- c(rpacf$acf))
lengthx <- length(x)
sqrtn <- sqrt(lengthx)
load(file='createtable')
a<-table.start()
a<-table.row.start(a)
a<-table.element(a,'Autocorrelation Function',4,TRUE)
a<-table.row.end(a)
a<-table.row.start(a)
a<-table.element(a,'Time lag k',header=TRUE)
a<-table.element(a,hyperlink('basics.htm','ACF(k)','click here for more information about the Autocorrelation Function'),header=TRUE)
a<-table.element(a,'T-STAT',header=TRUE)
a<-table.element(a,'P-value',header=TRUE)
a<-table.row.end(a)
for (i in 2:(par1+1)) {
a<-table.row.start(a)
a<-table.element(a,i-1,header=TRUE)
a<-table.element(a,round(myacf[i],6))
mytstat <- myacf[i]*sqrtn
a<-table.element(a,round(mytstat,4))
a<-table.element(a,round(1-pt(abs(mytstat),lengthx),6))
a<-table.row.end(a)
}
a<-table.end(a)
table.save(a,file='mytable.tab')
a<-table.start()
a<-table.row.start(a)
a<-table.element(a,'Partial Autocorrelation Function',4,TRUE)
a<-table.row.end(a)
a<-table.row.start(a)
a<-table.element(a,'Time lag k',header=TRUE)
a<-table.element(a,hyperlink('basics.htm','PACF(k)','click here for more information about the Partial Autocorrelation Function'),header=TRUE)
a<-table.element(a,'T-STAT',header=TRUE)
a<-table.element(a,'P-value',header=TRUE)
a<-table.row.end(a)
for (i in 1:par1) {
a<-table.row.start(a)
a<-table.element(a,i,header=TRUE)
a<-table.element(a,round(mypacf[i],6))
mytstat <- mypacf[i]*sqrtn
a<-table.element(a,round(mytstat,4))
a<-table.element(a,round(1-pt(abs(mytstat),lengthx),6))
a<-table.row.end(a)
}
a<-table.end(a)
table.save(a,file='mytable1.tab')