Free Statistics

of Irreproducible Research!

Author's title

Author*The author of this computation has been verified*
R Software Modulerwasp_arimaforecasting.wasp
Title produced by softwareARIMA Forecasting
Date of computationFri, 12 Dec 2008 01:26:54 -0700
Cite this page as followsStatistical Computations at FreeStatistics.org, Office for Research Development and Education, URL https://freestatistics.org/blog/index.php?v=date/2008/Dec/12/t1229070449ocvqvt9kkqerd7c.htm/, Retrieved Fri, 17 May 2024 13:24:01 +0000
Statistical Computations at FreeStatistics.org, Office for Research Development and Education, URL https://freestatistics.org/blog/index.php?pk=32487, Retrieved Fri, 17 May 2024 13:24:01 +0000
QR Codes:

Original text written by user:
IsPrivate?No (this computation is public)
User-defined keywords
Estimated Impact238
Family? (F = Feedback message, R = changed R code, M = changed R Module, P = changed Parameters, D = changed Data)
-     [ARIMA Forecasting] [AEFC PAPER] [2008-12-09 13:43:01] [547636b63517c1c2916a747d66b36ebf]
F    D  [ARIMA Forecasting] [AEFC PAPER] [2008-12-09 13:53:06] [547636b63517c1c2916a747d66b36ebf]
F           [ARIMA Forecasting] [Arima forecasting...] [2008-12-12 08:26:54] [3817f5e632a8bfeb1be7b5e8c86bd450] [Current]
F             [ARIMA Forecasting] [] [2008-12-14 21:26:41] [4c8dfb519edec2da3492d7e6be9a5685]
Feedback Forum
2008-12-16 16:33:49 [Glenn De Maeyer] [reply
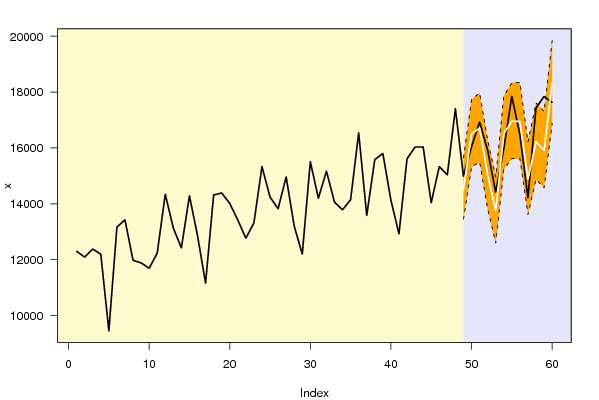
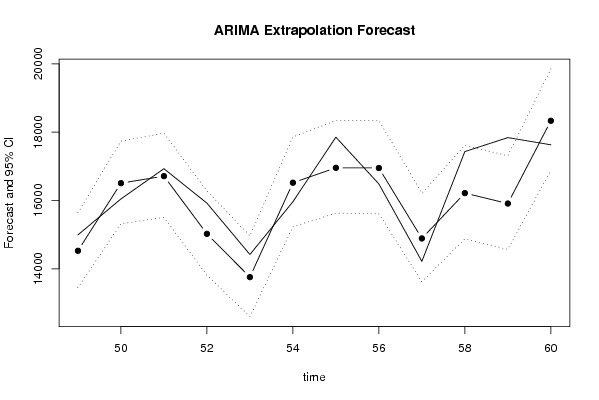
De tabel dienen we als volgt te interpreteren.

• Time: de maanden, (vb. Time:50: 50e observatie = 50ste maand van onze tijdreeks)

• Y(t): de werkelijke waarde van onze tijdreeks

• F(t)= de voorspelling van de werkelijke waarden door de software (deze begint pas van Time 49 aangezien onze testing period 12 maanden omvat)

95% LB & UB (lower en upper bound): dit is het alomgekende betrouwbaarheidsinterval. Met een zekerheid van 95% ligt de waarde van F(t) tussen deze 2 grenzen. Cf. wetmatigheid economie ceteris paribus.

p-value (H0: Y[t] = F[t]): Onze 0 Hypothese stelt hier dat Y(t) = F(t) (werkelijke waarde = voorspelde waarde). In de realiteit is dat zo goed als onmogelijk, verschil zal er altijd zijn. De software toetst hier echter of het verschil significant is of aan het toeval toe te wijzen is. Indien p-value onder de 5% dan is de voorspelde waarde significant verschillend van de werkelijke waarde. Onder de ceteris paribus voorwaarde impliceert dit dat bij een significant verschil, er een verklaring moet zijn (vb. regeringscrisis, marketingactie…)

In onze tabel zien we bijvoorbeeld dat er bij observatie 59 een significant verschil is tussen de werkelijke waarde en de voorspelling, aangezien de p-value (0,34%) hier onder de 5% ligt. De werkelijke waarde (17429.7) ligt hier dan ook dicht bij de upper bound.

Ook bij observatie 58 hebben we een significant verschil. Ook hier is de p-value (4,44%) kleiner dan 5%. We zien hier dat de werkelijke waarde (17839.5) boven de upper bound ligt.
Hier moet dus een verklaring voor te vinden zijn.
P(F[t]>Y[t-1]): In deze kolom vinden we de kans dat er een stijging is wanneer we 1 periode vooruit gaan. (We werken hier dus met maanden).
Zo zien we bijvoorbeeld dat wanneer we van periode 56 naar periode 57 gaan we een kans hebben van 10,2% dat er een stijging is. Dit impliceert dus ook dat er een kans is van +/- 90% op een daling.

P(F[t]>Y[t-s]): In deze kolom vinden we de kans dat er een stijging is t.g.o. het vorige jaar. In observatie zien we dat over het algemeen de kans bestaat dat er een stijging is t.o.v. de vorige maand.

P(F[t]>Y[48]): Hier vinden we de kans dat er een stijging is t.o.v.. de laats gekende waarde (time=48).

Post a new message
Dataseries X:
12300.00
12092.80
12380.80
12196.90
9455.00
13168.00
13427.90
11980.50
11884.80
11691.70
12233.80
14341.40
13130.70
12421.10
14285.80
12864.60
11160.20
14316.20
14388.70
14013.90
13419.00
12769.60
13315.50
15332.90
14243.00
13824.40
14962.90
13202.90
12199.00
15508.90
14199.80
15169.60
14058.00
13786.20
14147.90
16541.70
13587.50
15582.40
15802.80
14130.50
12923.20
15612.20
16033.70
16036.60
14037.80
15330.60
15038.30
17401.80
14992.50
16043.70
16929.60
15921.30
14417.20
15961.00
17851.90
16483.90
14215.50
17429.70
17839.50
17629.20


Summary of computational transaction
Raw Inputview raw input (R code)
Raw Outputview raw output of R engine
Computing time3 seconds
R Server'Herman Ole Andreas Wold' @ 193.190.124.10:1001

\begin{tabular}{lllllllll}
\hline
Summary of computational transaction \tabularnewline
Raw Input & view raw input (R code)  \tabularnewline
Raw Output & view raw output of R engine  \tabularnewline
Computing time & 3 seconds \tabularnewline
R Server & 'Herman Ole Andreas Wold' @ 193.190.124.10:1001 \tabularnewline
\hline
\end{tabular}
%Source: https://freestatistics.org/blog/index.php?pk=32487&T=0

[TABLE]
[ROW][C]Summary of computational transaction[/C][/ROW]
[ROW][C]Raw Input[/C][C]view raw input (R code) [/C][/ROW]
[ROW][C]Raw Output[/C][C]view raw output of R engine [/C][/ROW]
[ROW][C]Computing time[/C][C]3 seconds[/C][/ROW]
[ROW][C]R Server[/C][C]'Herman Ole Andreas Wold' @ 193.190.124.10:1001[/C][/ROW]
[/TABLE]
Source: https://freestatistics.org/blog/index.php?pk=32487&T=0

Globally Unique Identifier (entire table): ba.freestatistics.org/blog/index.php?pk=32487&T=0

As an alternative you can also use a QR Code:  

The GUIDs for individual cells are displayed in the table below:

Summary of computational transaction
Raw Inputview raw input (R code)
Raw Outputview raw output of R engine
Computing time3 seconds
R Server'Herman Ole Andreas Wold' @ 193.190.124.10:1001


Univariate ARIMA Extrapolation Forecast
timeY[t]F[t]95% LB95% UBp-value(H0: Y[t] = F[t])P(F[t]>Y[t-1])P(F[t]>Y[t-s])P(F[t]>Y[48])
3616541.7-------
3713587.5-------
3815582.4-------
3915802.8-------
4014130.5-------
4112923.2-------
4215612.2-------
4316033.7-------
4416036.6-------
4514037.8-------
4615330.6-------
4715038.3-------
4817401.8-------
4914992.514526.013913449.875615643.56290.206600.95010
5016043.716505.504415317.872317737.47380.23130.9920.9290.0769
5116929.616712.235815501.357117968.64640.36730.85150.9220.141
5215921.315021.82113813.611416280.67710.08070.00150.91741e-04
5314417.213755.401412597.608514964.08530.14162e-040.91140
541596116518.712915230.703117858.99610.20740.99890.90750.0983
5517851.916955.271715627.132718337.57130.10180.92070.90430.2633
5616483.916949.190615609.584418343.93730.25660.10230.90020.2624
5714215.514887.765213619.408616212.58220.160.00910.89571e-04
5817429.716215.233914874.532117613.77840.04440.99750.89250.0482
5917839.515909.031514568.069917309.02270.00340.01660.88860.0183
6017629.218332.639616875.99619849.57310.18170.7380.88550.8855

\begin{tabular}{lllllllll}
\hline
Univariate ARIMA Extrapolation Forecast \tabularnewline
time & Y[t] & F[t] & 95% LB & 95% UB & p-value(H0: Y[t] = F[t]) & P(F[t]>Y[t-1]) & P(F[t]>Y[t-s]) & P(F[t]>Y[48]) \tabularnewline
36 & 16541.7 & - & - & - & - & - & - & - \tabularnewline
37 & 13587.5 & - & - & - & - & - & - & - \tabularnewline
38 & 15582.4 & - & - & - & - & - & - & - \tabularnewline
39 & 15802.8 & - & - & - & - & - & - & - \tabularnewline
40 & 14130.5 & - & - & - & - & - & - & - \tabularnewline
41 & 12923.2 & - & - & - & - & - & - & - \tabularnewline
42 & 15612.2 & - & - & - & - & - & - & - \tabularnewline
43 & 16033.7 & - & - & - & - & - & - & - \tabularnewline
44 & 16036.6 & - & - & - & - & - & - & - \tabularnewline
45 & 14037.8 & - & - & - & - & - & - & - \tabularnewline
46 & 15330.6 & - & - & - & - & - & - & - \tabularnewline
47 & 15038.3 & - & - & - & - & - & - & - \tabularnewline
48 & 17401.8 & - & - & - & - & - & - & - \tabularnewline
49 & 14992.5 & 14526.0139 & 13449.8756 & 15643.5629 & 0.2066 & 0 & 0.9501 & 0 \tabularnewline
50 & 16043.7 & 16505.5044 & 15317.8723 & 17737.4738 & 0.2313 & 0.992 & 0.929 & 0.0769 \tabularnewline
51 & 16929.6 & 16712.2358 & 15501.3571 & 17968.6464 & 0.3673 & 0.8515 & 0.922 & 0.141 \tabularnewline
52 & 15921.3 & 15021.821 & 13813.6114 & 16280.6771 & 0.0807 & 0.0015 & 0.9174 & 1e-04 \tabularnewline
53 & 14417.2 & 13755.4014 & 12597.6085 & 14964.0853 & 0.1416 & 2e-04 & 0.9114 & 0 \tabularnewline
54 & 15961 & 16518.7129 & 15230.7031 & 17858.9961 & 0.2074 & 0.9989 & 0.9075 & 0.0983 \tabularnewline
55 & 17851.9 & 16955.2717 & 15627.1327 & 18337.5713 & 0.1018 & 0.9207 & 0.9043 & 0.2633 \tabularnewline
56 & 16483.9 & 16949.1906 & 15609.5844 & 18343.9373 & 0.2566 & 0.1023 & 0.9002 & 0.2624 \tabularnewline
57 & 14215.5 & 14887.7652 & 13619.4086 & 16212.5822 & 0.16 & 0.0091 & 0.8957 & 1e-04 \tabularnewline
58 & 17429.7 & 16215.2339 & 14874.5321 & 17613.7784 & 0.0444 & 0.9975 & 0.8925 & 0.0482 \tabularnewline
59 & 17839.5 & 15909.0315 & 14568.0699 & 17309.0227 & 0.0034 & 0.0166 & 0.8886 & 0.0183 \tabularnewline
60 & 17629.2 & 18332.6396 & 16875.996 & 19849.5731 & 0.1817 & 0.738 & 0.8855 & 0.8855 \tabularnewline
\hline
\end{tabular}
%Source: https://freestatistics.org/blog/index.php?pk=32487&T=1

[TABLE]
[ROW][C]Univariate ARIMA Extrapolation Forecast[/C][/ROW]
[ROW][C]time[/C][C]Y[t][/C][C]F[t][/C][C]95% LB[/C][C]95% UB[/C][C]p-value(H0: Y[t] = F[t])[/C][C]P(F[t]>Y[t-1])[/C][C]P(F[t]>Y[t-s])[/C][C]P(F[t]>Y[48])[/C][/ROW]
[ROW][C]36[/C][C]16541.7[/C][C]-[/C][C]-[/C][C]-[/C][C]-[/C][C]-[/C][C]-[/C][C]-[/C][/ROW]
[ROW][C]37[/C][C]13587.5[/C][C]-[/C][C]-[/C][C]-[/C][C]-[/C][C]-[/C][C]-[/C][C]-[/C][/ROW]
[ROW][C]38[/C][C]15582.4[/C][C]-[/C][C]-[/C][C]-[/C][C]-[/C][C]-[/C][C]-[/C][C]-[/C][/ROW]
[ROW][C]39[/C][C]15802.8[/C][C]-[/C][C]-[/C][C]-[/C][C]-[/C][C]-[/C][C]-[/C][C]-[/C][/ROW]
[ROW][C]40[/C][C]14130.5[/C][C]-[/C][C]-[/C][C]-[/C][C]-[/C][C]-[/C][C]-[/C][C]-[/C][/ROW]
[ROW][C]41[/C][C]12923.2[/C][C]-[/C][C]-[/C][C]-[/C][C]-[/C][C]-[/C][C]-[/C][C]-[/C][/ROW]
[ROW][C]42[/C][C]15612.2[/C][C]-[/C][C]-[/C][C]-[/C][C]-[/C][C]-[/C][C]-[/C][C]-[/C][/ROW]
[ROW][C]43[/C][C]16033.7[/C][C]-[/C][C]-[/C][C]-[/C][C]-[/C][C]-[/C][C]-[/C][C]-[/C][/ROW]
[ROW][C]44[/C][C]16036.6[/C][C]-[/C][C]-[/C][C]-[/C][C]-[/C][C]-[/C][C]-[/C][C]-[/C][/ROW]
[ROW][C]45[/C][C]14037.8[/C][C]-[/C][C]-[/C][C]-[/C][C]-[/C][C]-[/C][C]-[/C][C]-[/C][/ROW]
[ROW][C]46[/C][C]15330.6[/C][C]-[/C][C]-[/C][C]-[/C][C]-[/C][C]-[/C][C]-[/C][C]-[/C][/ROW]
[ROW][C]47[/C][C]15038.3[/C][C]-[/C][C]-[/C][C]-[/C][C]-[/C][C]-[/C][C]-[/C][C]-[/C][/ROW]
[ROW][C]48[/C][C]17401.8[/C][C]-[/C][C]-[/C][C]-[/C][C]-[/C][C]-[/C][C]-[/C][C]-[/C][/ROW]
[ROW][C]49[/C][C]14992.5[/C][C]14526.0139[/C][C]13449.8756[/C][C]15643.5629[/C][C]0.2066[/C][C]0[/C][C]0.9501[/C][C]0[/C][/ROW]
[ROW][C]50[/C][C]16043.7[/C][C]16505.5044[/C][C]15317.8723[/C][C]17737.4738[/C][C]0.2313[/C][C]0.992[/C][C]0.929[/C][C]0.0769[/C][/ROW]
[ROW][C]51[/C][C]16929.6[/C][C]16712.2358[/C][C]15501.3571[/C][C]17968.6464[/C][C]0.3673[/C][C]0.8515[/C][C]0.922[/C][C]0.141[/C][/ROW]
[ROW][C]52[/C][C]15921.3[/C][C]15021.821[/C][C]13813.6114[/C][C]16280.6771[/C][C]0.0807[/C][C]0.0015[/C][C]0.9174[/C][C]1e-04[/C][/ROW]
[ROW][C]53[/C][C]14417.2[/C][C]13755.4014[/C][C]12597.6085[/C][C]14964.0853[/C][C]0.1416[/C][C]2e-04[/C][C]0.9114[/C][C]0[/C][/ROW]
[ROW][C]54[/C][C]15961[/C][C]16518.7129[/C][C]15230.7031[/C][C]17858.9961[/C][C]0.2074[/C][C]0.9989[/C][C]0.9075[/C][C]0.0983[/C][/ROW]
[ROW][C]55[/C][C]17851.9[/C][C]16955.2717[/C][C]15627.1327[/C][C]18337.5713[/C][C]0.1018[/C][C]0.9207[/C][C]0.9043[/C][C]0.2633[/C][/ROW]
[ROW][C]56[/C][C]16483.9[/C][C]16949.1906[/C][C]15609.5844[/C][C]18343.9373[/C][C]0.2566[/C][C]0.1023[/C][C]0.9002[/C][C]0.2624[/C][/ROW]
[ROW][C]57[/C][C]14215.5[/C][C]14887.7652[/C][C]13619.4086[/C][C]16212.5822[/C][C]0.16[/C][C]0.0091[/C][C]0.8957[/C][C]1e-04[/C][/ROW]
[ROW][C]58[/C][C]17429.7[/C][C]16215.2339[/C][C]14874.5321[/C][C]17613.7784[/C][C]0.0444[/C][C]0.9975[/C][C]0.8925[/C][C]0.0482[/C][/ROW]
[ROW][C]59[/C][C]17839.5[/C][C]15909.0315[/C][C]14568.0699[/C][C]17309.0227[/C][C]0.0034[/C][C]0.0166[/C][C]0.8886[/C][C]0.0183[/C][/ROW]
[ROW][C]60[/C][C]17629.2[/C][C]18332.6396[/C][C]16875.996[/C][C]19849.5731[/C][C]0.1817[/C][C]0.738[/C][C]0.8855[/C][C]0.8855[/C][/ROW]
[/TABLE]
Source: https://freestatistics.org/blog/index.php?pk=32487&T=1

Globally Unique Identifier (entire table): ba.freestatistics.org/blog/index.php?pk=32487&T=1

As an alternative you can also use a QR Code:  

The GUIDs for individual cells are displayed in the table below:

Univariate ARIMA Extrapolation Forecast
timeY[t]F[t]95% LB95% UBp-value(H0: Y[t] = F[t])P(F[t]>Y[t-1])P(F[t]>Y[t-s])P(F[t]>Y[48])
3616541.7-------
3713587.5-------
3815582.4-------
3915802.8-------
4014130.5-------
4112923.2-------
4215612.2-------
4316033.7-------
4416036.6-------
4514037.8-------
4615330.6-------
4715038.3-------
4817401.8-------
4914992.514526.013913449.875615643.56290.206600.95010
5016043.716505.504415317.872317737.47380.23130.9920.9290.0769
5116929.616712.235815501.357117968.64640.36730.85150.9220.141
5215921.315021.82113813.611416280.67710.08070.00150.91741e-04
5314417.213755.401412597.608514964.08530.14162e-040.91140
541596116518.712915230.703117858.99610.20740.99890.90750.0983
5517851.916955.271715627.132718337.57130.10180.92070.90430.2633
5616483.916949.190615609.584418343.93730.25660.10230.90020.2624
5714215.514887.765213619.408616212.58220.160.00910.89571e-04
5817429.716215.233914874.532117613.77840.04440.99750.89250.0482
5917839.515909.031514568.069917309.02270.00340.01660.88860.0183
6017629.218332.639616875.99619849.57310.18170.7380.88550.8855


Univariate ARIMA Extrapolation Forecast Performance
time% S.E.PEMAPESq.EMSERMSE
490.03930.03210.0027217609.289418134.1074134.6629
500.0381-0.0280.0023213263.346817771.9456133.3115
510.03840.0130.001147247.1843937.265362.7476
520.04280.05990.005809062.456567421.8714259.6572
530.04480.04810.004437977.434136498.1195191.0448
540.0414-0.03380.0028311043.640425920.3034160.9978
550.04160.05290.0044803942.38766995.1989258.8343
560.042-0.02750.0023216495.366618041.2805134.3178
570.0454-0.04520.0038451940.527337661.7106194.0663
580.0440.07490.00621474927.9297122910.6608350.5862
590.04490.12130.01013726708.4547310559.0379557.2782
600.0422-0.03840.0032494827.326941235.6106203.0655

\begin{tabular}{lllllllll}
\hline
Univariate ARIMA Extrapolation Forecast Performance \tabularnewline
time & % S.E. & PE & MAPE & Sq.E & MSE & RMSE \tabularnewline
49 & 0.0393 & 0.0321 & 0.0027 & 217609.2894 & 18134.1074 & 134.6629 \tabularnewline
50 & 0.0381 & -0.028 & 0.0023 & 213263.3468 & 17771.9456 & 133.3115 \tabularnewline
51 & 0.0384 & 0.013 & 0.0011 & 47247.184 & 3937.2653 & 62.7476 \tabularnewline
52 & 0.0428 & 0.0599 & 0.005 & 809062.4565 & 67421.8714 & 259.6572 \tabularnewline
53 & 0.0448 & 0.0481 & 0.004 & 437977.4341 & 36498.1195 & 191.0448 \tabularnewline
54 & 0.0414 & -0.0338 & 0.0028 & 311043.6404 & 25920.3034 & 160.9978 \tabularnewline
55 & 0.0416 & 0.0529 & 0.0044 & 803942.387 & 66995.1989 & 258.8343 \tabularnewline
56 & 0.042 & -0.0275 & 0.0023 & 216495.3666 & 18041.2805 & 134.3178 \tabularnewline
57 & 0.0454 & -0.0452 & 0.0038 & 451940.5273 & 37661.7106 & 194.0663 \tabularnewline
58 & 0.044 & 0.0749 & 0.0062 & 1474927.9297 & 122910.6608 & 350.5862 \tabularnewline
59 & 0.0449 & 0.1213 & 0.0101 & 3726708.4547 & 310559.0379 & 557.2782 \tabularnewline
60 & 0.0422 & -0.0384 & 0.0032 & 494827.3269 & 41235.6106 & 203.0655 \tabularnewline
\hline
\end{tabular}
%Source: https://freestatistics.org/blog/index.php?pk=32487&T=2

[TABLE]
[ROW][C]Univariate ARIMA Extrapolation Forecast Performance[/C][/ROW]
[ROW][C]time[/C][C]% S.E.[/C][C]PE[/C][C]MAPE[/C][C]Sq.E[/C][C]MSE[/C][C]RMSE[/C][/ROW]
[ROW][C]49[/C][C]0.0393[/C][C]0.0321[/C][C]0.0027[/C][C]217609.2894[/C][C]18134.1074[/C][C]134.6629[/C][/ROW]
[ROW][C]50[/C][C]0.0381[/C][C]-0.028[/C][C]0.0023[/C][C]213263.3468[/C][C]17771.9456[/C][C]133.3115[/C][/ROW]
[ROW][C]51[/C][C]0.0384[/C][C]0.013[/C][C]0.0011[/C][C]47247.184[/C][C]3937.2653[/C][C]62.7476[/C][/ROW]
[ROW][C]52[/C][C]0.0428[/C][C]0.0599[/C][C]0.005[/C][C]809062.4565[/C][C]67421.8714[/C][C]259.6572[/C][/ROW]
[ROW][C]53[/C][C]0.0448[/C][C]0.0481[/C][C]0.004[/C][C]437977.4341[/C][C]36498.1195[/C][C]191.0448[/C][/ROW]
[ROW][C]54[/C][C]0.0414[/C][C]-0.0338[/C][C]0.0028[/C][C]311043.6404[/C][C]25920.3034[/C][C]160.9978[/C][/ROW]
[ROW][C]55[/C][C]0.0416[/C][C]0.0529[/C][C]0.0044[/C][C]803942.387[/C][C]66995.1989[/C][C]258.8343[/C][/ROW]
[ROW][C]56[/C][C]0.042[/C][C]-0.0275[/C][C]0.0023[/C][C]216495.3666[/C][C]18041.2805[/C][C]134.3178[/C][/ROW]
[ROW][C]57[/C][C]0.0454[/C][C]-0.0452[/C][C]0.0038[/C][C]451940.5273[/C][C]37661.7106[/C][C]194.0663[/C][/ROW]
[ROW][C]58[/C][C]0.044[/C][C]0.0749[/C][C]0.0062[/C][C]1474927.9297[/C][C]122910.6608[/C][C]350.5862[/C][/ROW]
[ROW][C]59[/C][C]0.0449[/C][C]0.1213[/C][C]0.0101[/C][C]3726708.4547[/C][C]310559.0379[/C][C]557.2782[/C][/ROW]
[ROW][C]60[/C][C]0.0422[/C][C]-0.0384[/C][C]0.0032[/C][C]494827.3269[/C][C]41235.6106[/C][C]203.0655[/C][/ROW]
[/TABLE]
Source: https://freestatistics.org/blog/index.php?pk=32487&T=2

Globally Unique Identifier (entire table): ba.freestatistics.org/blog/index.php?pk=32487&T=2

As an alternative you can also use a QR Code:  

The GUIDs for individual cells are displayed in the table below:

Univariate ARIMA Extrapolation Forecast Performance
time% S.E.PEMAPESq.EMSERMSE
490.03930.03210.0027217609.289418134.1074134.6629
500.0381-0.0280.0023213263.346817771.9456133.3115
510.03840.0130.001147247.1843937.265362.7476
520.04280.05990.005809062.456567421.8714259.6572
530.04480.04810.004437977.434136498.1195191.0448
540.0414-0.03380.0028311043.640425920.3034160.9978
550.04160.05290.0044803942.38766995.1989258.8343
560.042-0.02750.0023216495.366618041.2805134.3178
570.0454-0.04520.0038451940.527337661.7106194.0663
580.0440.07490.00621474927.9297122910.6608350.5862
590.04490.12130.01013726708.4547310559.0379557.2782
600.0422-0.03840.0032494827.326941235.6106203.0655


Parameters (Session):
par1 = 12 ; par2 = 0.5 ; par3 = 0 ; par4 = 1 ; par5 = 12 ; par6 = 3 ; par7 = 1 ; par8 = 0 ; par9 = 0 ; par10 = FALSE ;
Parameters (R input):
par1 = 12 ; par2 = 0.5 ; par3 = 0 ; par4 = 1 ; par5 = 12 ; par6 = 3 ; par7 = 1 ; par8 = 0 ; par9 = 0 ; par10 = FALSE ;
R code (references can be found in the software module):
par1 <- as.numeric(par1) #cut off periods
par2 <- as.numeric(par2) #lambda
par3 <- as.numeric(par3) #degree of non-seasonal differencing
par4 <- as.numeric(par4) #degree of seasonal differencing
par5 <- as.numeric(par5) #seasonal period
par6 <- as.numeric(par6) #p
par7 <- as.numeric(par7) #q
par8 <- as.numeric(par8) #P
par9 <- as.numeric(par9) #Q
if (par10 == 'TRUE') par10 <- TRUE
if (par10 == 'FALSE') par10 <- FALSE
if (par2 == 0) x <- log(x)
if (par2 != 0) x <- x^par2
lx <- length(x)
first <- lx - 2*par1
nx <- lx - par1
nx1 <- nx + 1
fx <- lx - nx
if (fx < 1) {
fx <- par5
nx1 <- lx + fx - 1
first <- lx - 2*fx
}
first <- 1
if (fx < 3) fx <- round(lx/10,0)
(arima.out <- arima(x[1:nx], order=c(par6,par3,par7), seasonal=list(order=c(par8,par4,par9), period=par5), include.mean=par10, method='ML'))
(forecast <- predict(arima.out,fx))
(lb <- forecast$pred - 1.96 * forecast$se)
(ub <- forecast$pred + 1.96 * forecast$se)
if (par2 == 0) {
x <- exp(x)
forecast$pred <- exp(forecast$pred)
lb <- exp(lb)
ub <- exp(ub)
}
if (par2 != 0) {
x <- x^(1/par2)
forecast$pred <- forecast$pred^(1/par2)
lb <- lb^(1/par2)
ub <- ub^(1/par2)
}
if (par2 < 0) {
olb <- lb
lb <- ub
ub <- olb
}
(actandfor <- c(x[1:nx], forecast$pred))
(perc.se <- (ub-forecast$pred)/1.96/forecast$pred)
bitmap(file='test1.png')
opar <- par(mar=c(4,4,2,2),las=1)
ylim <- c( min(x[first:nx],lb), max(x[first:nx],ub))
plot(x,ylim=ylim,type='n',xlim=c(first,lx))
usr <- par('usr')
rect(usr[1],usr[3],nx+1,usr[4],border=NA,col='lemonchiffon')
rect(nx1,usr[3],usr[2],usr[4],border=NA,col='lavender')
abline(h= (-3:3)*2 , col ='gray', lty =3)
polygon( c(nx1:lx,lx:nx1), c(lb,rev(ub)), col = 'orange', lty=2,border=NA)
lines(nx1:lx, lb , lty=2)
lines(nx1:lx, ub , lty=2)
lines(x, lwd=2)
lines(nx1:lx, forecast$pred , lwd=2 , col ='white')
box()
par(opar)
dev.off()
prob.dec <- array(NA, dim=fx)
prob.sdec <- array(NA, dim=fx)
prob.ldec <- array(NA, dim=fx)
prob.pval <- array(NA, dim=fx)
perf.pe <- array(0, dim=fx)
perf.mape <- array(0, dim=fx)
perf.se <- array(0, dim=fx)
perf.mse <- array(0, dim=fx)
perf.rmse <- array(0, dim=fx)
for (i in 1:fx) {
locSD <- (ub[i] - forecast$pred[i]) / 1.96
perf.pe[i] = (x[nx+i] - forecast$pred[i]) / forecast$pred[i]
perf.mape[i] = perf.mape[i] + abs(perf.pe[i])
perf.se[i] = (x[nx+i] - forecast$pred[i])^2
perf.mse[i] = perf.mse[i] + perf.se[i]
prob.dec[i] = pnorm((x[nx+i-1] - forecast$pred[i]) / locSD)
prob.sdec[i] = pnorm((x[nx+i-par5] - forecast$pred[i]) / locSD)
prob.ldec[i] = pnorm((x[nx] - forecast$pred[i]) / locSD)
prob.pval[i] = pnorm(abs(x[nx+i] - forecast$pred[i]) / locSD)
}
perf.mape = perf.mape / fx
perf.mse = perf.mse / fx
perf.rmse = sqrt(perf.mse)
bitmap(file='test2.png')
plot(forecast$pred, pch=19, type='b',main='ARIMA Extrapolation Forecast', ylab='Forecast and 95% CI', xlab='time',ylim=c(min(lb),max(ub)))
dum <- forecast$pred
dum[1:12] <- x[(nx+1):lx]
lines(dum, lty=1)
lines(ub,lty=3)
lines(lb,lty=3)
dev.off()
load(file='createtable')
a<-table.start()
a<-table.row.start(a)
a<-table.element(a,'Univariate ARIMA Extrapolation Forecast',9,TRUE)
a<-table.row.end(a)
a<-table.row.start(a)
a<-table.element(a,'time',1,header=TRUE)
a<-table.element(a,'Y[t]',1,header=TRUE)
a<-table.element(a,'F[t]',1,header=TRUE)
a<-table.element(a,'95% LB',1,header=TRUE)
a<-table.element(a,'95% UB',1,header=TRUE)
a<-table.element(a,'p-value
(H0: Y[t] = F[t])',1,header=TRUE)
a<-table.element(a,'P(F[t]>Y[t-1])',1,header=TRUE)
a<-table.element(a,'P(F[t]>Y[t-s])',1,header=TRUE)
mylab <- paste('P(F[t]>Y[',nx,sep='')
mylab <- paste(mylab,'])',sep='')
a<-table.element(a,mylab,1,header=TRUE)
a<-table.row.end(a)
for (i in (nx-par5):nx) {
a<-table.row.start(a)
a<-table.element(a,i,header=TRUE)
a<-table.element(a,x[i])
a<-table.element(a,'-')
a<-table.row.end(a)
}
for (i in 1:fx) {
a<-table.row.start(a)
a<-table.element(a,nx+i,header=TRUE)
a<-table.element(a,round(x[nx+i],4))
a<-table.element(a,round(forecast$pred[i],4))
a<-table.element(a,round(lb[i],4))
a<-table.element(a,round(ub[i],4))
a<-table.element(a,round((1-prob.pval[i]),4))
a<-table.element(a,round((1-prob.dec[i]),4))
a<-table.element(a,round((1-prob.sdec[i]),4))
a<-table.element(a,round((1-prob.ldec[i]),4))
a<-table.row.end(a)
}
a<-table.end(a)
table.save(a,file='mytable.tab')
a<-table.start()
a<-table.row.start(a)
a<-table.element(a,'Univariate ARIMA Extrapolation Forecast Performance',7,TRUE)
a<-table.row.end(a)
a<-table.row.start(a)
a<-table.element(a,'time',1,header=TRUE)
a<-table.element(a,'% S.E.',1,header=TRUE)
a<-table.element(a,'PE',1,header=TRUE)
a<-table.element(a,'MAPE',1,header=TRUE)
a<-table.element(a,'Sq.E',1,header=TRUE)
a<-table.element(a,'MSE',1,header=TRUE)
a<-table.element(a,'RMSE',1,header=TRUE)
a<-table.row.end(a)
for (i in 1:fx) {
a<-table.row.start(a)
a<-table.element(a,nx+i,header=TRUE)
a<-table.element(a,round(perc.se[i],4))
a<-table.element(a,round(perf.pe[i],4))
a<-table.element(a,round(perf.mape[i],4))
a<-table.element(a,round(perf.se[i],4))
a<-table.element(a,round(perf.mse[i],4))
a<-table.element(a,round(perf.rmse[i],4))
a<-table.row.end(a)
}
a<-table.end(a)
table.save(a,file='mytable1.tab')