Free Statistics

of Irreproducible Research!

Author's title

Author*Unverified author*
R Software Modulerwasp_autocorrelation.wasp
Title produced by software(Partial) Autocorrelation Function
Date of computationThu, 11 Dec 2008 08:11:23 -0700
Cite this page as followsStatistical Computations at FreeStatistics.org, Office for Research Development and Education, URL https://freestatistics.org/blog/index.php?v=date/2008/Dec/11/t12290085031hfmpodf4ztyxf8.htm/, Retrieved Fri, 17 May 2024 02:01:08 +0000
Statistical Computations at FreeStatistics.org, Office for Research Development and Education, URL https://freestatistics.org/blog/index.php?pk=32304, Retrieved Fri, 17 May 2024 02:01:08 +0000
QR Codes:

Original text written by user:
IsPrivate?No (this computation is public)
User-defined keywords
Estimated Impact187
Family? (F = Feedback message, R = changed R code, M = changed R Module, P = changed Parameters, D = changed Data)
F     [(Partial) Autocorrelation Function] [paper bel20 autoc...] [2008-12-03 13:05:59] [f58cc3b532da25682c394745f1a82535]
-   PD    [(Partial) Autocorrelation Function] [] [2008-12-11 15:11:23] [d41d8cd98f00b204e9800998ecf8427e] [Current]
Feedback Forum

Post a new message
Dataseries X:
2659.81
2638.53
2720.25
2745.88
2735.7
2811.7
2799.43
2555.28
2304.98
2214.95
2065.81
1940.49
2042
1995.37
1946.81
1765.9
1635.25
1833.42
1910.43
1959.67
1969.6
2061.41
2093.48
2120.88
2174.56
2196.72
2350.44
2440.25
2408.64
2472.81
2407.6
2454.62
2448.05
2497.84
2645.64
2756.76
2849.27
2921.44
2981.85
3080.58
3106.22
3119.31
3061.26
3097.31
3161.69
3257.16
3277.01
3295.32
3363.99
3494.17
3667.03
3813.06
3917.96
3895.51
3801.06
3570.12
3701.61
3862.27
3970.1
4138.52
4199.75
4290.89
4443.91
4502.64
4356.98
4591.27
4696.96
4621.4
4562.84
4202.52
4296.49
4435.23
4105.18
4116.68
3844.49
3720.98
3674.4
3857.62
3801.06
3504.37
3032.6
3047.03


Summary of computational transaction
Raw Inputview raw input (R code)
Raw Outputview raw output of R engine
Computing time0 seconds
R Server'George Udny Yule' @ 72.249.76.132

\begin{tabular}{lllllllll}
\hline
Summary of computational transaction \tabularnewline
Raw Input & view raw input (R code)  \tabularnewline
Raw Output & view raw output of R engine  \tabularnewline
Computing time & 0 seconds \tabularnewline
R Server & 'George Udny Yule' @ 72.249.76.132 \tabularnewline
\hline
\end{tabular}
%Source: https://freestatistics.org/blog/index.php?pk=32304&T=0

[TABLE]
[ROW][C]Summary of computational transaction[/C][/ROW]
[ROW][C]Raw Input[/C][C]view raw input (R code) [/C][/ROW]
[ROW][C]Raw Output[/C][C]view raw output of R engine [/C][/ROW]
[ROW][C]Computing time[/C][C]0 seconds[/C][/ROW]
[ROW][C]R Server[/C][C]'George Udny Yule' @ 72.249.76.132[/C][/ROW]
[/TABLE]
Source: https://freestatistics.org/blog/index.php?pk=32304&T=0

Globally Unique Identifier (entire table): ba.freestatistics.org/blog/index.php?pk=32304&T=0

As an alternative you can also use a QR Code:  

The GUIDs for individual cells are displayed in the table below:

Summary of computational transaction
Raw Inputview raw input (R code)
Raw Outputview raw output of R engine
Computing time0 seconds
R Server'George Udny Yule' @ 72.249.76.132


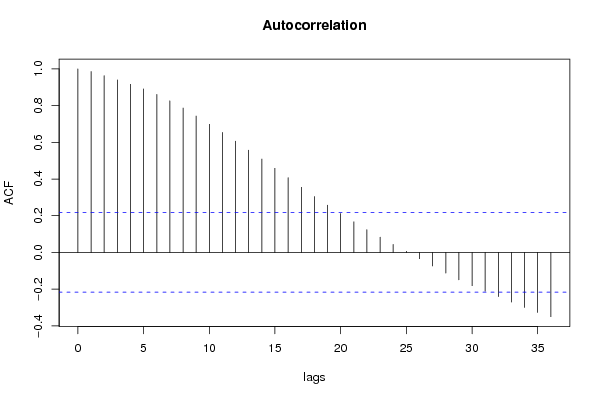
Autocorrelation Function
Time lag kACF(k)T-STATP-value
10.9855148.92420
20.9631048.72130
30.9399668.51180
40.9160378.29510
50.89138.07110
60.8610567.79720
70.8260027.47980
80.7870817.12730
90.7430346.72850
100.6985826.32590
110.6540895.9230
120.6062725.490
130.5571135.04491e-06
140.5086064.60567e-06
150.4584724.15164e-05
160.4071573.6870.000203
170.3549393.21410.000936
180.3044122.75660.003599
190.257162.32870.011169
200.2116151.91630.029408
210.1670211.51240.067133
220.124091.12370.132213
230.0828350.75010.227669
240.0438570.39710.346146
250.0061210.05540.477966
26-0.033813-0.30620.380117
27-0.073626-0.66670.253414
28-0.112577-1.01940.155499
29-0.14909-1.35010.090355
30-0.181323-1.64190.052215
31-0.211458-1.91480.029501
32-0.240478-2.17760.016154
33-0.270448-2.4490.008228
34-0.299817-2.7150.00404
35-0.326902-2.96020.002009
36-0.350066-3.170.001072

\begin{tabular}{lllllllll}
\hline
Autocorrelation Function \tabularnewline
Time lag k & ACF(k) & T-STAT & P-value \tabularnewline
1 & 0.985514 & 8.9242 & 0 \tabularnewline
2 & 0.963104 & 8.7213 & 0 \tabularnewline
3 & 0.939966 & 8.5118 & 0 \tabularnewline
4 & 0.916037 & 8.2951 & 0 \tabularnewline
5 & 0.8913 & 8.0711 & 0 \tabularnewline
6 & 0.861056 & 7.7972 & 0 \tabularnewline
7 & 0.826002 & 7.4798 & 0 \tabularnewline
8 & 0.787081 & 7.1273 & 0 \tabularnewline
9 & 0.743034 & 6.7285 & 0 \tabularnewline
10 & 0.698582 & 6.3259 & 0 \tabularnewline
11 & 0.654089 & 5.923 & 0 \tabularnewline
12 & 0.606272 & 5.49 & 0 \tabularnewline
13 & 0.557113 & 5.0449 & 1e-06 \tabularnewline
14 & 0.508606 & 4.6056 & 7e-06 \tabularnewline
15 & 0.458472 & 4.1516 & 4e-05 \tabularnewline
16 & 0.407157 & 3.687 & 0.000203 \tabularnewline
17 & 0.354939 & 3.2141 & 0.000936 \tabularnewline
18 & 0.304412 & 2.7566 & 0.003599 \tabularnewline
19 & 0.25716 & 2.3287 & 0.011169 \tabularnewline
20 & 0.211615 & 1.9163 & 0.029408 \tabularnewline
21 & 0.167021 & 1.5124 & 0.067133 \tabularnewline
22 & 0.12409 & 1.1237 & 0.132213 \tabularnewline
23 & 0.082835 & 0.7501 & 0.227669 \tabularnewline
24 & 0.043857 & 0.3971 & 0.346146 \tabularnewline
25 & 0.006121 & 0.0554 & 0.477966 \tabularnewline
26 & -0.033813 & -0.3062 & 0.380117 \tabularnewline
27 & -0.073626 & -0.6667 & 0.253414 \tabularnewline
28 & -0.112577 & -1.0194 & 0.155499 \tabularnewline
29 & -0.14909 & -1.3501 & 0.090355 \tabularnewline
30 & -0.181323 & -1.6419 & 0.052215 \tabularnewline
31 & -0.211458 & -1.9148 & 0.029501 \tabularnewline
32 & -0.240478 & -2.1776 & 0.016154 \tabularnewline
33 & -0.270448 & -2.449 & 0.008228 \tabularnewline
34 & -0.299817 & -2.715 & 0.00404 \tabularnewline
35 & -0.326902 & -2.9602 & 0.002009 \tabularnewline
36 & -0.350066 & -3.17 & 0.001072 \tabularnewline
\hline
\end{tabular}
%Source: https://freestatistics.org/blog/index.php?pk=32304&T=1

[TABLE]
[ROW][C]Autocorrelation Function[/C][/ROW]
[ROW][C]Time lag k[/C][C]ACF(k)[/C][C]T-STAT[/C][C]P-value[/C][/ROW]
[ROW][C]1[/C][C]0.985514[/C][C]8.9242[/C][C]0[/C][/ROW]
[ROW][C]2[/C][C]0.963104[/C][C]8.7213[/C][C]0[/C][/ROW]
[ROW][C]3[/C][C]0.939966[/C][C]8.5118[/C][C]0[/C][/ROW]
[ROW][C]4[/C][C]0.916037[/C][C]8.2951[/C][C]0[/C][/ROW]
[ROW][C]5[/C][C]0.8913[/C][C]8.0711[/C][C]0[/C][/ROW]
[ROW][C]6[/C][C]0.861056[/C][C]7.7972[/C][C]0[/C][/ROW]
[ROW][C]7[/C][C]0.826002[/C][C]7.4798[/C][C]0[/C][/ROW]
[ROW][C]8[/C][C]0.787081[/C][C]7.1273[/C][C]0[/C][/ROW]
[ROW][C]9[/C][C]0.743034[/C][C]6.7285[/C][C]0[/C][/ROW]
[ROW][C]10[/C][C]0.698582[/C][C]6.3259[/C][C]0[/C][/ROW]
[ROW][C]11[/C][C]0.654089[/C][C]5.923[/C][C]0[/C][/ROW]
[ROW][C]12[/C][C]0.606272[/C][C]5.49[/C][C]0[/C][/ROW]
[ROW][C]13[/C][C]0.557113[/C][C]5.0449[/C][C]1e-06[/C][/ROW]
[ROW][C]14[/C][C]0.508606[/C][C]4.6056[/C][C]7e-06[/C][/ROW]
[ROW][C]15[/C][C]0.458472[/C][C]4.1516[/C][C]4e-05[/C][/ROW]
[ROW][C]16[/C][C]0.407157[/C][C]3.687[/C][C]0.000203[/C][/ROW]
[ROW][C]17[/C][C]0.354939[/C][C]3.2141[/C][C]0.000936[/C][/ROW]
[ROW][C]18[/C][C]0.304412[/C][C]2.7566[/C][C]0.003599[/C][/ROW]
[ROW][C]19[/C][C]0.25716[/C][C]2.3287[/C][C]0.011169[/C][/ROW]
[ROW][C]20[/C][C]0.211615[/C][C]1.9163[/C][C]0.029408[/C][/ROW]
[ROW][C]21[/C][C]0.167021[/C][C]1.5124[/C][C]0.067133[/C][/ROW]
[ROW][C]22[/C][C]0.12409[/C][C]1.1237[/C][C]0.132213[/C][/ROW]
[ROW][C]23[/C][C]0.082835[/C][C]0.7501[/C][C]0.227669[/C][/ROW]
[ROW][C]24[/C][C]0.043857[/C][C]0.3971[/C][C]0.346146[/C][/ROW]
[ROW][C]25[/C][C]0.006121[/C][C]0.0554[/C][C]0.477966[/C][/ROW]
[ROW][C]26[/C][C]-0.033813[/C][C]-0.3062[/C][C]0.380117[/C][/ROW]
[ROW][C]27[/C][C]-0.073626[/C][C]-0.6667[/C][C]0.253414[/C][/ROW]
[ROW][C]28[/C][C]-0.112577[/C][C]-1.0194[/C][C]0.155499[/C][/ROW]
[ROW][C]29[/C][C]-0.14909[/C][C]-1.3501[/C][C]0.090355[/C][/ROW]
[ROW][C]30[/C][C]-0.181323[/C][C]-1.6419[/C][C]0.052215[/C][/ROW]
[ROW][C]31[/C][C]-0.211458[/C][C]-1.9148[/C][C]0.029501[/C][/ROW]
[ROW][C]32[/C][C]-0.240478[/C][C]-2.1776[/C][C]0.016154[/C][/ROW]
[ROW][C]33[/C][C]-0.270448[/C][C]-2.449[/C][C]0.008228[/C][/ROW]
[ROW][C]34[/C][C]-0.299817[/C][C]-2.715[/C][C]0.00404[/C][/ROW]
[ROW][C]35[/C][C]-0.326902[/C][C]-2.9602[/C][C]0.002009[/C][/ROW]
[ROW][C]36[/C][C]-0.350066[/C][C]-3.17[/C][C]0.001072[/C][/ROW]
[/TABLE]
Source: https://freestatistics.org/blog/index.php?pk=32304&T=1

Globally Unique Identifier (entire table): ba.freestatistics.org/blog/index.php?pk=32304&T=1

As an alternative you can also use a QR Code:  

The GUIDs for individual cells are displayed in the table below:

Autocorrelation Function
Time lag kACF(k)T-STATP-value
10.9855148.92420
20.9631048.72130
30.9399668.51180
40.9160378.29510
50.89138.07110
60.8610567.79720
70.8260027.47980
80.7870817.12730
90.7430346.72850
100.6985826.32590
110.6540895.9230
120.6062725.490
130.5571135.04491e-06
140.5086064.60567e-06
150.4584724.15164e-05
160.4071573.6870.000203
170.3549393.21410.000936
180.3044122.75660.003599
190.257162.32870.011169
200.2116151.91630.029408
210.1670211.51240.067133
220.124091.12370.132213
230.0828350.75010.227669
240.0438570.39710.346146
250.0061210.05540.477966
26-0.033813-0.30620.380117
27-0.073626-0.66670.253414
28-0.112577-1.01940.155499
29-0.14909-1.35010.090355
30-0.181323-1.64190.052215
31-0.211458-1.91480.029501
32-0.240478-2.17760.016154
33-0.270448-2.4490.008228
34-0.299817-2.7150.00404
35-0.326902-2.96020.002009
36-0.350066-3.170.001072


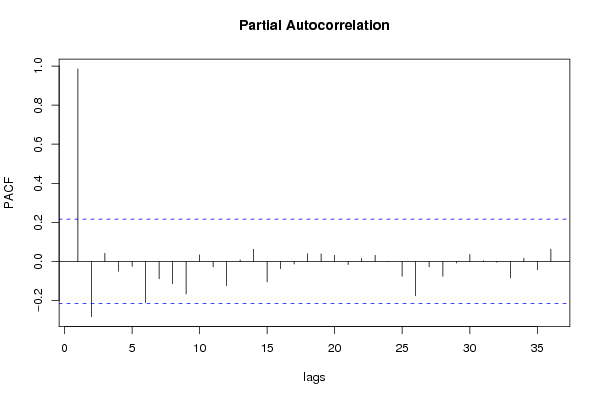
Partial Autocorrelation Function
Time lag kPACF(k)T-STATP-value
10.9855148.92420
2-0.282797-2.56080.006137
30.0414760.37560.354098
4-0.049941-0.45220.326147
5-0.025216-0.22830.409976
6-0.210901-1.90980.029828
7-0.089192-0.80770.210809
8-0.113876-1.03120.152742
9-0.166721-1.50970.067479
100.0334760.30310.381277
11-0.027371-0.24790.402433
12-0.124806-1.13020.13085
130.0076770.06950.472375
140.062420.56520.286729
15-0.105331-0.95380.171492
16-0.037213-0.3370.368497
17-0.01327-0.12020.452321
180.0390460.35360.362283
190.0387310.35070.363346
200.0311140.28180.389422
21-0.016036-0.14520.44245
220.0156290.14150.4439
230.0314570.28490.388237
24-0.000953-0.00860.496567
25-0.075838-0.68670.247092
26-0.176204-1.59560.057213
27-0.027025-0.24470.403643
28-0.07613-0.68940.246263
29-0.008015-0.07260.471159
300.0357950.32410.373328
310.0034120.03090.487713
32-0.0046-0.04170.483437
33-0.084758-0.76750.222489
340.0162710.14730.441611
35-0.042549-0.38530.350506
360.0626440.56730.286042

\begin{tabular}{lllllllll}
\hline
Partial Autocorrelation Function \tabularnewline
Time lag k & PACF(k) & T-STAT & P-value \tabularnewline
1 & 0.985514 & 8.9242 & 0 \tabularnewline
2 & -0.282797 & -2.5608 & 0.006137 \tabularnewline
3 & 0.041476 & 0.3756 & 0.354098 \tabularnewline
4 & -0.049941 & -0.4522 & 0.326147 \tabularnewline
5 & -0.025216 & -0.2283 & 0.409976 \tabularnewline
6 & -0.210901 & -1.9098 & 0.029828 \tabularnewline
7 & -0.089192 & -0.8077 & 0.210809 \tabularnewline
8 & -0.113876 & -1.0312 & 0.152742 \tabularnewline
9 & -0.166721 & -1.5097 & 0.067479 \tabularnewline
10 & 0.033476 & 0.3031 & 0.381277 \tabularnewline
11 & -0.027371 & -0.2479 & 0.402433 \tabularnewline
12 & -0.124806 & -1.1302 & 0.13085 \tabularnewline
13 & 0.007677 & 0.0695 & 0.472375 \tabularnewline
14 & 0.06242 & 0.5652 & 0.286729 \tabularnewline
15 & -0.105331 & -0.9538 & 0.171492 \tabularnewline
16 & -0.037213 & -0.337 & 0.368497 \tabularnewline
17 & -0.01327 & -0.1202 & 0.452321 \tabularnewline
18 & 0.039046 & 0.3536 & 0.362283 \tabularnewline
19 & 0.038731 & 0.3507 & 0.363346 \tabularnewline
20 & 0.031114 & 0.2818 & 0.389422 \tabularnewline
21 & -0.016036 & -0.1452 & 0.44245 \tabularnewline
22 & 0.015629 & 0.1415 & 0.4439 \tabularnewline
23 & 0.031457 & 0.2849 & 0.388237 \tabularnewline
24 & -0.000953 & -0.0086 & 0.496567 \tabularnewline
25 & -0.075838 & -0.6867 & 0.247092 \tabularnewline
26 & -0.176204 & -1.5956 & 0.057213 \tabularnewline
27 & -0.027025 & -0.2447 & 0.403643 \tabularnewline
28 & -0.07613 & -0.6894 & 0.246263 \tabularnewline
29 & -0.008015 & -0.0726 & 0.471159 \tabularnewline
30 & 0.035795 & 0.3241 & 0.373328 \tabularnewline
31 & 0.003412 & 0.0309 & 0.487713 \tabularnewline
32 & -0.0046 & -0.0417 & 0.483437 \tabularnewline
33 & -0.084758 & -0.7675 & 0.222489 \tabularnewline
34 & 0.016271 & 0.1473 & 0.441611 \tabularnewline
35 & -0.042549 & -0.3853 & 0.350506 \tabularnewline
36 & 0.062644 & 0.5673 & 0.286042 \tabularnewline
\hline
\end{tabular}
%Source: https://freestatistics.org/blog/index.php?pk=32304&T=2

[TABLE]
[ROW][C]Partial Autocorrelation Function[/C][/ROW]
[ROW][C]Time lag k[/C][C]PACF(k)[/C][C]T-STAT[/C][C]P-value[/C][/ROW]
[ROW][C]1[/C][C]0.985514[/C][C]8.9242[/C][C]0[/C][/ROW]
[ROW][C]2[/C][C]-0.282797[/C][C]-2.5608[/C][C]0.006137[/C][/ROW]
[ROW][C]3[/C][C]0.041476[/C][C]0.3756[/C][C]0.354098[/C][/ROW]
[ROW][C]4[/C][C]-0.049941[/C][C]-0.4522[/C][C]0.326147[/C][/ROW]
[ROW][C]5[/C][C]-0.025216[/C][C]-0.2283[/C][C]0.409976[/C][/ROW]
[ROW][C]6[/C][C]-0.210901[/C][C]-1.9098[/C][C]0.029828[/C][/ROW]
[ROW][C]7[/C][C]-0.089192[/C][C]-0.8077[/C][C]0.210809[/C][/ROW]
[ROW][C]8[/C][C]-0.113876[/C][C]-1.0312[/C][C]0.152742[/C][/ROW]
[ROW][C]9[/C][C]-0.166721[/C][C]-1.5097[/C][C]0.067479[/C][/ROW]
[ROW][C]10[/C][C]0.033476[/C][C]0.3031[/C][C]0.381277[/C][/ROW]
[ROW][C]11[/C][C]-0.027371[/C][C]-0.2479[/C][C]0.402433[/C][/ROW]
[ROW][C]12[/C][C]-0.124806[/C][C]-1.1302[/C][C]0.13085[/C][/ROW]
[ROW][C]13[/C][C]0.007677[/C][C]0.0695[/C][C]0.472375[/C][/ROW]
[ROW][C]14[/C][C]0.06242[/C][C]0.5652[/C][C]0.286729[/C][/ROW]
[ROW][C]15[/C][C]-0.105331[/C][C]-0.9538[/C][C]0.171492[/C][/ROW]
[ROW][C]16[/C][C]-0.037213[/C][C]-0.337[/C][C]0.368497[/C][/ROW]
[ROW][C]17[/C][C]-0.01327[/C][C]-0.1202[/C][C]0.452321[/C][/ROW]
[ROW][C]18[/C][C]0.039046[/C][C]0.3536[/C][C]0.362283[/C][/ROW]
[ROW][C]19[/C][C]0.038731[/C][C]0.3507[/C][C]0.363346[/C][/ROW]
[ROW][C]20[/C][C]0.031114[/C][C]0.2818[/C][C]0.389422[/C][/ROW]
[ROW][C]21[/C][C]-0.016036[/C][C]-0.1452[/C][C]0.44245[/C][/ROW]
[ROW][C]22[/C][C]0.015629[/C][C]0.1415[/C][C]0.4439[/C][/ROW]
[ROW][C]23[/C][C]0.031457[/C][C]0.2849[/C][C]0.388237[/C][/ROW]
[ROW][C]24[/C][C]-0.000953[/C][C]-0.0086[/C][C]0.496567[/C][/ROW]
[ROW][C]25[/C][C]-0.075838[/C][C]-0.6867[/C][C]0.247092[/C][/ROW]
[ROW][C]26[/C][C]-0.176204[/C][C]-1.5956[/C][C]0.057213[/C][/ROW]
[ROW][C]27[/C][C]-0.027025[/C][C]-0.2447[/C][C]0.403643[/C][/ROW]
[ROW][C]28[/C][C]-0.07613[/C][C]-0.6894[/C][C]0.246263[/C][/ROW]
[ROW][C]29[/C][C]-0.008015[/C][C]-0.0726[/C][C]0.471159[/C][/ROW]
[ROW][C]30[/C][C]0.035795[/C][C]0.3241[/C][C]0.373328[/C][/ROW]
[ROW][C]31[/C][C]0.003412[/C][C]0.0309[/C][C]0.487713[/C][/ROW]
[ROW][C]32[/C][C]-0.0046[/C][C]-0.0417[/C][C]0.483437[/C][/ROW]
[ROW][C]33[/C][C]-0.084758[/C][C]-0.7675[/C][C]0.222489[/C][/ROW]
[ROW][C]34[/C][C]0.016271[/C][C]0.1473[/C][C]0.441611[/C][/ROW]
[ROW][C]35[/C][C]-0.042549[/C][C]-0.3853[/C][C]0.350506[/C][/ROW]
[ROW][C]36[/C][C]0.062644[/C][C]0.5673[/C][C]0.286042[/C][/ROW]
[/TABLE]
Source: https://freestatistics.org/blog/index.php?pk=32304&T=2

Globally Unique Identifier (entire table): ba.freestatistics.org/blog/index.php?pk=32304&T=2

As an alternative you can also use a QR Code:  

The GUIDs for individual cells are displayed in the table below:

Partial Autocorrelation Function
Time lag kPACF(k)T-STATP-value
10.9855148.92420
2-0.282797-2.56080.006137
30.0414760.37560.354098
4-0.049941-0.45220.326147
5-0.025216-0.22830.409976
6-0.210901-1.90980.029828
7-0.089192-0.80770.210809
8-0.113876-1.03120.152742
9-0.166721-1.50970.067479
100.0334760.30310.381277
11-0.027371-0.24790.402433
12-0.124806-1.13020.13085
130.0076770.06950.472375
140.062420.56520.286729
15-0.105331-0.95380.171492
16-0.037213-0.3370.368497
17-0.01327-0.12020.452321
180.0390460.35360.362283
190.0387310.35070.363346
200.0311140.28180.389422
21-0.016036-0.14520.44245
220.0156290.14150.4439
230.0314570.28490.388237
24-0.000953-0.00860.496567
25-0.075838-0.68670.247092
26-0.176204-1.59560.057213
27-0.027025-0.24470.403643
28-0.07613-0.68940.246263
29-0.008015-0.07260.471159
300.0357950.32410.373328
310.0034120.03090.487713
32-0.0046-0.04170.483437
33-0.084758-0.76750.222489
340.0162710.14730.441611
35-0.042549-0.38530.350506
360.0626440.56730.286042


Parameters (Session):
par1 = 36 ; par2 = 1 ; par3 = 0 ; par4 = 0 ; par5 = 12 ;
Parameters (R input):
par1 = 36 ; par2 = 1 ; par3 = 0 ; par4 = 0 ; par5 = 12 ;
R code (references can be found in the software module):
if (par1 == 'Default') {
par1 = 10*log10(length(x))
} else {
par1 <- as.numeric(par1)
}
par2 <- as.numeric(par2)
par3 <- as.numeric(par3)
par4 <- as.numeric(par4)
par5 <- as.numeric(par5)
if (par2 == 0) {
x <- log(x)
} else {
x <- (x ^ par2 - 1) / par2
}
if (par3 > 0) x <- diff(x,lag=1,difference=par3)
if (par4 > 0) x <- diff(x,lag=par5,difference=par4)
bitmap(file='pic1.png')
racf <- acf(x,par1,main='Autocorrelation',xlab='lags',ylab='ACF')
dev.off()
bitmap(file='pic2.png')
rpacf <- pacf(x,par1,main='Partial Autocorrelation',xlab='lags',ylab='PACF')
dev.off()
(myacf <- c(racf$acf))
(mypacf <- c(rpacf$acf))
lengthx <- length(x)
sqrtn <- sqrt(lengthx)
load(file='createtable')
a<-table.start()
a<-table.row.start(a)
a<-table.element(a,'Autocorrelation Function',4,TRUE)
a<-table.row.end(a)
a<-table.row.start(a)
a<-table.element(a,'Time lag k',header=TRUE)
a<-table.element(a,hyperlink('basics.htm','ACF(k)','click here for more information about the Autocorrelation Function'),header=TRUE)
a<-table.element(a,'T-STAT',header=TRUE)
a<-table.element(a,'P-value',header=TRUE)
a<-table.row.end(a)
for (i in 2:(par1+1)) {
a<-table.row.start(a)
a<-table.element(a,i-1,header=TRUE)
a<-table.element(a,round(myacf[i],6))
mytstat <- myacf[i]*sqrtn
a<-table.element(a,round(mytstat,4))
a<-table.element(a,round(1-pt(abs(mytstat),lengthx),6))
a<-table.row.end(a)
}
a<-table.end(a)
table.save(a,file='mytable.tab')
a<-table.start()
a<-table.row.start(a)
a<-table.element(a,'Partial Autocorrelation Function',4,TRUE)
a<-table.row.end(a)
a<-table.row.start(a)
a<-table.element(a,'Time lag k',header=TRUE)
a<-table.element(a,hyperlink('basics.htm','PACF(k)','click here for more information about the Partial Autocorrelation Function'),header=TRUE)
a<-table.element(a,'T-STAT',header=TRUE)
a<-table.element(a,'P-value',header=TRUE)
a<-table.row.end(a)
for (i in 1:par1) {
a<-table.row.start(a)
a<-table.element(a,i,header=TRUE)
a<-table.element(a,round(mypacf[i],6))
mytstat <- mypacf[i]*sqrtn
a<-table.element(a,round(mytstat,4))
a<-table.element(a,round(1-pt(abs(mytstat),lengthx),6))
a<-table.row.end(a)
}
a<-table.end(a)
table.save(a,file='mytable1.tab')