Free Statistics

of Irreproducible Research!

Author's title

Author*The author of this computation has been verified*
R Software Modulerwasp_autocorrelation.wasp
Title produced by software(Partial) Autocorrelation Function
Date of computationThu, 11 Dec 2008 08:05:26 -0700
Cite this page as followsStatistical Computations at FreeStatistics.org, Office for Research Development and Education, URL https://freestatistics.org/blog/index.php?v=date/2008/Dec/11/t1229007988x0x33l2fwtbg6ih.htm/, Retrieved Fri, 17 May 2024 02:39:57 +0000
Statistical Computations at FreeStatistics.org, Office for Research Development and Education, URL https://freestatistics.org/blog/index.php?pk=32293, Retrieved Fri, 17 May 2024 02:39:57 +0000
QR Codes:

Original text written by user:
IsPrivate?No (this computation is public)
User-defined keywords
Estimated Impact156
Family? (F = Feedback message, R = changed R code, M = changed R Module, P = changed Parameters, D = changed Data)
-       [(Partial) Autocorrelation Function] [brandstof] [2008-12-11 15:05:26] [9e8e8f1cf6738240aaa61f66e2e3fd45] [Current]
Feedback Forum

Post a new message
Dataseries X:
124
118.63
121.86
119.97
125.03
130.09
126.65
121.7
119.24
122.63
116.66
114.12
113.11
112.61
113.4
115.18
121.01
119.44
116.68
117.07
117.41
119.58
120.92
117.09
116.77
119.39
122.49
124.08
118.29
112.94
113.79
114.43
118.7
120.36
118.27
118.34
117.82
117.65
118.18
121.02
124.78
131.16
130.14
131.75
134.73
135.35
140.32
136.35
131.6
128.9
133.89
138.25
146.23
144.76
149.3
156.8
159.08
165.12
163.14
153.43
151.01


Summary of computational transaction
Raw Inputview raw input (R code)
Raw Outputview raw output of R engine
Computing time1 seconds
R Server'George Udny Yule' @ 72.249.76.132

\begin{tabular}{lllllllll}
\hline
Summary of computational transaction \tabularnewline
Raw Input & view raw input (R code)  \tabularnewline
Raw Output & view raw output of R engine  \tabularnewline
Computing time & 1 seconds \tabularnewline
R Server & 'George Udny Yule' @ 72.249.76.132 \tabularnewline
\hline
\end{tabular}
%Source: https://freestatistics.org/blog/index.php?pk=32293&T=0

[TABLE]
[ROW][C]Summary of computational transaction[/C][/ROW]
[ROW][C]Raw Input[/C][C]view raw input (R code) [/C][/ROW]
[ROW][C]Raw Output[/C][C]view raw output of R engine [/C][/ROW]
[ROW][C]Computing time[/C][C]1 seconds[/C][/ROW]
[ROW][C]R Server[/C][C]'George Udny Yule' @ 72.249.76.132[/C][/ROW]
[/TABLE]
Source: https://freestatistics.org/blog/index.php?pk=32293&T=0

Globally Unique Identifier (entire table): ba.freestatistics.org/blog/index.php?pk=32293&T=0

As an alternative you can also use a QR Code:  

The GUIDs for individual cells are displayed in the table below:

Summary of computational transaction
Raw Inputview raw input (R code)
Raw Outputview raw output of R engine
Computing time1 seconds
R Server'George Udny Yule' @ 72.249.76.132


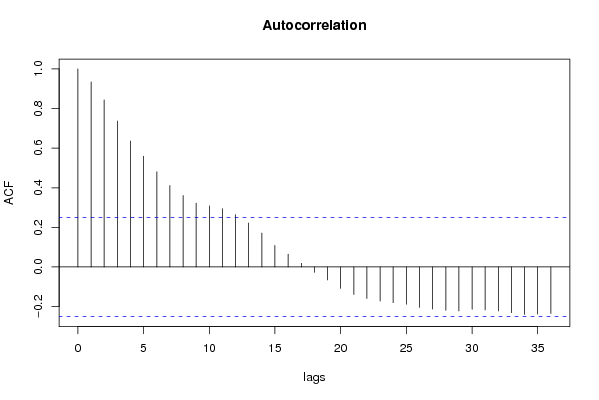
Autocorrelation Function
Time lag kACF(k)T-STATP-value
10.9346277.29970
20.8437926.59020
30.7367615.75430
40.6355684.96393e-06
50.5595894.37052.5e-05
60.4804713.75260.000196
70.4114163.21330.001049
80.3603122.81410.003287
90.3223372.51750.00723
100.3080662.40610.009585
110.2943622.2990.012471
120.2642842.06410.021633
130.2218181.73250.044123
140.1714751.33930.092727
150.1089720.85110.199022
160.0643750.50280.308463
170.0183330.14320.443309
18-0.026742-0.20890.417627
19-0.065248-0.50960.306085
20-0.108148-0.84470.2008
21-0.138944-1.08520.141054
22-0.158839-1.24060.109757
23-0.172465-1.3470.091483
24-0.180362-1.40870.082005
25-0.18828-1.47050.073281
26-0.204481-1.5970.057712
27-0.212552-1.66010.051015
28-0.218716-1.70820.046339
29-0.222057-1.73430.043956
30-0.21392-1.67080.049945
31-0.217262-1.69690.04741
32-0.222212-1.73550.043848
33-0.230619-1.80120.038308
34-0.239618-1.87150.033038
35-0.237757-1.85690.034075
36-0.234483-1.83140.035965

\begin{tabular}{lllllllll}
\hline
Autocorrelation Function \tabularnewline
Time lag k & ACF(k) & T-STAT & P-value \tabularnewline
1 & 0.934627 & 7.2997 & 0 \tabularnewline
2 & 0.843792 & 6.5902 & 0 \tabularnewline
3 & 0.736761 & 5.7543 & 0 \tabularnewline
4 & 0.635568 & 4.9639 & 3e-06 \tabularnewline
5 & 0.559589 & 4.3705 & 2.5e-05 \tabularnewline
6 & 0.480471 & 3.7526 & 0.000196 \tabularnewline
7 & 0.411416 & 3.2133 & 0.001049 \tabularnewline
8 & 0.360312 & 2.8141 & 0.003287 \tabularnewline
9 & 0.322337 & 2.5175 & 0.00723 \tabularnewline
10 & 0.308066 & 2.4061 & 0.009585 \tabularnewline
11 & 0.294362 & 2.299 & 0.012471 \tabularnewline
12 & 0.264284 & 2.0641 & 0.021633 \tabularnewline
13 & 0.221818 & 1.7325 & 0.044123 \tabularnewline
14 & 0.171475 & 1.3393 & 0.092727 \tabularnewline
15 & 0.108972 & 0.8511 & 0.199022 \tabularnewline
16 & 0.064375 & 0.5028 & 0.308463 \tabularnewline
17 & 0.018333 & 0.1432 & 0.443309 \tabularnewline
18 & -0.026742 & -0.2089 & 0.417627 \tabularnewline
19 & -0.065248 & -0.5096 & 0.306085 \tabularnewline
20 & -0.108148 & -0.8447 & 0.2008 \tabularnewline
21 & -0.138944 & -1.0852 & 0.141054 \tabularnewline
22 & -0.158839 & -1.2406 & 0.109757 \tabularnewline
23 & -0.172465 & -1.347 & 0.091483 \tabularnewline
24 & -0.180362 & -1.4087 & 0.082005 \tabularnewline
25 & -0.18828 & -1.4705 & 0.073281 \tabularnewline
26 & -0.204481 & -1.597 & 0.057712 \tabularnewline
27 & -0.212552 & -1.6601 & 0.051015 \tabularnewline
28 & -0.218716 & -1.7082 & 0.046339 \tabularnewline
29 & -0.222057 & -1.7343 & 0.043956 \tabularnewline
30 & -0.21392 & -1.6708 & 0.049945 \tabularnewline
31 & -0.217262 & -1.6969 & 0.04741 \tabularnewline
32 & -0.222212 & -1.7355 & 0.043848 \tabularnewline
33 & -0.230619 & -1.8012 & 0.038308 \tabularnewline
34 & -0.239618 & -1.8715 & 0.033038 \tabularnewline
35 & -0.237757 & -1.8569 & 0.034075 \tabularnewline
36 & -0.234483 & -1.8314 & 0.035965 \tabularnewline
\hline
\end{tabular}
%Source: https://freestatistics.org/blog/index.php?pk=32293&T=1

[TABLE]
[ROW][C]Autocorrelation Function[/C][/ROW]
[ROW][C]Time lag k[/C][C]ACF(k)[/C][C]T-STAT[/C][C]P-value[/C][/ROW]
[ROW][C]1[/C][C]0.934627[/C][C]7.2997[/C][C]0[/C][/ROW]
[ROW][C]2[/C][C]0.843792[/C][C]6.5902[/C][C]0[/C][/ROW]
[ROW][C]3[/C][C]0.736761[/C][C]5.7543[/C][C]0[/C][/ROW]
[ROW][C]4[/C][C]0.635568[/C][C]4.9639[/C][C]3e-06[/C][/ROW]
[ROW][C]5[/C][C]0.559589[/C][C]4.3705[/C][C]2.5e-05[/C][/ROW]
[ROW][C]6[/C][C]0.480471[/C][C]3.7526[/C][C]0.000196[/C][/ROW]
[ROW][C]7[/C][C]0.411416[/C][C]3.2133[/C][C]0.001049[/C][/ROW]
[ROW][C]8[/C][C]0.360312[/C][C]2.8141[/C][C]0.003287[/C][/ROW]
[ROW][C]9[/C][C]0.322337[/C][C]2.5175[/C][C]0.00723[/C][/ROW]
[ROW][C]10[/C][C]0.308066[/C][C]2.4061[/C][C]0.009585[/C][/ROW]
[ROW][C]11[/C][C]0.294362[/C][C]2.299[/C][C]0.012471[/C][/ROW]
[ROW][C]12[/C][C]0.264284[/C][C]2.0641[/C][C]0.021633[/C][/ROW]
[ROW][C]13[/C][C]0.221818[/C][C]1.7325[/C][C]0.044123[/C][/ROW]
[ROW][C]14[/C][C]0.171475[/C][C]1.3393[/C][C]0.092727[/C][/ROW]
[ROW][C]15[/C][C]0.108972[/C][C]0.8511[/C][C]0.199022[/C][/ROW]
[ROW][C]16[/C][C]0.064375[/C][C]0.5028[/C][C]0.308463[/C][/ROW]
[ROW][C]17[/C][C]0.018333[/C][C]0.1432[/C][C]0.443309[/C][/ROW]
[ROW][C]18[/C][C]-0.026742[/C][C]-0.2089[/C][C]0.417627[/C][/ROW]
[ROW][C]19[/C][C]-0.065248[/C][C]-0.5096[/C][C]0.306085[/C][/ROW]
[ROW][C]20[/C][C]-0.108148[/C][C]-0.8447[/C][C]0.2008[/C][/ROW]
[ROW][C]21[/C][C]-0.138944[/C][C]-1.0852[/C][C]0.141054[/C][/ROW]
[ROW][C]22[/C][C]-0.158839[/C][C]-1.2406[/C][C]0.109757[/C][/ROW]
[ROW][C]23[/C][C]-0.172465[/C][C]-1.347[/C][C]0.091483[/C][/ROW]
[ROW][C]24[/C][C]-0.180362[/C][C]-1.4087[/C][C]0.082005[/C][/ROW]
[ROW][C]25[/C][C]-0.18828[/C][C]-1.4705[/C][C]0.073281[/C][/ROW]
[ROW][C]26[/C][C]-0.204481[/C][C]-1.597[/C][C]0.057712[/C][/ROW]
[ROW][C]27[/C][C]-0.212552[/C][C]-1.6601[/C][C]0.051015[/C][/ROW]
[ROW][C]28[/C][C]-0.218716[/C][C]-1.7082[/C][C]0.046339[/C][/ROW]
[ROW][C]29[/C][C]-0.222057[/C][C]-1.7343[/C][C]0.043956[/C][/ROW]
[ROW][C]30[/C][C]-0.21392[/C][C]-1.6708[/C][C]0.049945[/C][/ROW]
[ROW][C]31[/C][C]-0.217262[/C][C]-1.6969[/C][C]0.04741[/C][/ROW]
[ROW][C]32[/C][C]-0.222212[/C][C]-1.7355[/C][C]0.043848[/C][/ROW]
[ROW][C]33[/C][C]-0.230619[/C][C]-1.8012[/C][C]0.038308[/C][/ROW]
[ROW][C]34[/C][C]-0.239618[/C][C]-1.8715[/C][C]0.033038[/C][/ROW]
[ROW][C]35[/C][C]-0.237757[/C][C]-1.8569[/C][C]0.034075[/C][/ROW]
[ROW][C]36[/C][C]-0.234483[/C][C]-1.8314[/C][C]0.035965[/C][/ROW]
[/TABLE]
Source: https://freestatistics.org/blog/index.php?pk=32293&T=1

Globally Unique Identifier (entire table): ba.freestatistics.org/blog/index.php?pk=32293&T=1

As an alternative you can also use a QR Code:  

The GUIDs for individual cells are displayed in the table below:

Autocorrelation Function
Time lag kACF(k)T-STATP-value
10.9346277.29970
20.8437926.59020
30.7367615.75430
40.6355684.96393e-06
50.5595894.37052.5e-05
60.4804713.75260.000196
70.4114163.21330.001049
80.3603122.81410.003287
90.3223372.51750.00723
100.3080662.40610.009585
110.2943622.2990.012471
120.2642842.06410.021633
130.2218181.73250.044123
140.1714751.33930.092727
150.1089720.85110.199022
160.0643750.50280.308463
170.0183330.14320.443309
18-0.026742-0.20890.417627
19-0.065248-0.50960.306085
20-0.108148-0.84470.2008
21-0.138944-1.08520.141054
22-0.158839-1.24060.109757
23-0.172465-1.3470.091483
24-0.180362-1.40870.082005
25-0.18828-1.47050.073281
26-0.204481-1.5970.057712
27-0.212552-1.66010.051015
28-0.218716-1.70820.046339
29-0.222057-1.73430.043956
30-0.21392-1.67080.049945
31-0.217262-1.69690.04741
32-0.222212-1.73550.043848
33-0.230619-1.80120.038308
34-0.239618-1.87150.033038
35-0.237757-1.85690.034075
36-0.234483-1.83140.035965


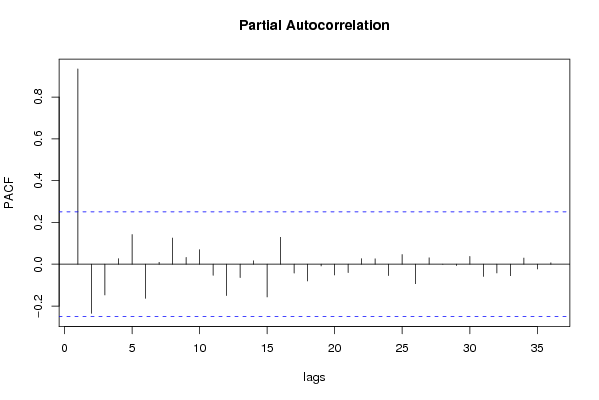
Partial Autocorrelation Function
Time lag kPACF(k)T-STATP-value
10.9346277.29970
2-0.235113-1.83630.035594
3-0.146835-1.14680.127968
40.0265690.20750.418151
50.1420711.10960.135762
6-0.163172-1.27440.103676
70.0089090.06960.472378
80.1251050.97710.166188
90.0323070.25230.400819
100.0696490.5440.29422
11-0.053357-0.41670.339168
12-0.149744-1.16950.123368
13-0.064119-0.50080.309161
140.0161830.12640.449919
15-0.15657-1.22290.113045
160.1286891.00510.15941
17-0.042359-0.33080.370953
18-0.079958-0.62450.267316
19-0.008497-0.06640.473654
20-0.051525-0.40240.344389
21-0.040079-0.3130.377665
220.0262410.20490.419148
230.0261770.20440.419341
24-0.054034-0.4220.337247
250.0462980.36160.35945
26-0.093332-0.72890.234412
270.0305940.23890.405973
280.0001139e-040.499649
29-0.006499-0.05080.479842
300.0372740.29110.385974
31-0.058337-0.45560.325139
32-0.04161-0.3250.373153
33-0.05498-0.42940.334569
340.029670.23170.408761
35-0.022283-0.1740.431205
360.0069780.05450.478358

\begin{tabular}{lllllllll}
\hline
Partial Autocorrelation Function \tabularnewline
Time lag k & PACF(k) & T-STAT & P-value \tabularnewline
1 & 0.934627 & 7.2997 & 0 \tabularnewline
2 & -0.235113 & -1.8363 & 0.035594 \tabularnewline
3 & -0.146835 & -1.1468 & 0.127968 \tabularnewline
4 & 0.026569 & 0.2075 & 0.418151 \tabularnewline
5 & 0.142071 & 1.1096 & 0.135762 \tabularnewline
6 & -0.163172 & -1.2744 & 0.103676 \tabularnewline
7 & 0.008909 & 0.0696 & 0.472378 \tabularnewline
8 & 0.125105 & 0.9771 & 0.166188 \tabularnewline
9 & 0.032307 & 0.2523 & 0.400819 \tabularnewline
10 & 0.069649 & 0.544 & 0.29422 \tabularnewline
11 & -0.053357 & -0.4167 & 0.339168 \tabularnewline
12 & -0.149744 & -1.1695 & 0.123368 \tabularnewline
13 & -0.064119 & -0.5008 & 0.309161 \tabularnewline
14 & 0.016183 & 0.1264 & 0.449919 \tabularnewline
15 & -0.15657 & -1.2229 & 0.113045 \tabularnewline
16 & 0.128689 & 1.0051 & 0.15941 \tabularnewline
17 & -0.042359 & -0.3308 & 0.370953 \tabularnewline
18 & -0.079958 & -0.6245 & 0.267316 \tabularnewline
19 & -0.008497 & -0.0664 & 0.473654 \tabularnewline
20 & -0.051525 & -0.4024 & 0.344389 \tabularnewline
21 & -0.040079 & -0.313 & 0.377665 \tabularnewline
22 & 0.026241 & 0.2049 & 0.419148 \tabularnewline
23 & 0.026177 & 0.2044 & 0.419341 \tabularnewline
24 & -0.054034 & -0.422 & 0.337247 \tabularnewline
25 & 0.046298 & 0.3616 & 0.35945 \tabularnewline
26 & -0.093332 & -0.7289 & 0.234412 \tabularnewline
27 & 0.030594 & 0.2389 & 0.405973 \tabularnewline
28 & 0.000113 & 9e-04 & 0.499649 \tabularnewline
29 & -0.006499 & -0.0508 & 0.479842 \tabularnewline
30 & 0.037274 & 0.2911 & 0.385974 \tabularnewline
31 & -0.058337 & -0.4556 & 0.325139 \tabularnewline
32 & -0.04161 & -0.325 & 0.373153 \tabularnewline
33 & -0.05498 & -0.4294 & 0.334569 \tabularnewline
34 & 0.02967 & 0.2317 & 0.408761 \tabularnewline
35 & -0.022283 & -0.174 & 0.431205 \tabularnewline
36 & 0.006978 & 0.0545 & 0.478358 \tabularnewline
\hline
\end{tabular}
%Source: https://freestatistics.org/blog/index.php?pk=32293&T=2

[TABLE]
[ROW][C]Partial Autocorrelation Function[/C][/ROW]
[ROW][C]Time lag k[/C][C]PACF(k)[/C][C]T-STAT[/C][C]P-value[/C][/ROW]
[ROW][C]1[/C][C]0.934627[/C][C]7.2997[/C][C]0[/C][/ROW]
[ROW][C]2[/C][C]-0.235113[/C][C]-1.8363[/C][C]0.035594[/C][/ROW]
[ROW][C]3[/C][C]-0.146835[/C][C]-1.1468[/C][C]0.127968[/C][/ROW]
[ROW][C]4[/C][C]0.026569[/C][C]0.2075[/C][C]0.418151[/C][/ROW]
[ROW][C]5[/C][C]0.142071[/C][C]1.1096[/C][C]0.135762[/C][/ROW]
[ROW][C]6[/C][C]-0.163172[/C][C]-1.2744[/C][C]0.103676[/C][/ROW]
[ROW][C]7[/C][C]0.008909[/C][C]0.0696[/C][C]0.472378[/C][/ROW]
[ROW][C]8[/C][C]0.125105[/C][C]0.9771[/C][C]0.166188[/C][/ROW]
[ROW][C]9[/C][C]0.032307[/C][C]0.2523[/C][C]0.400819[/C][/ROW]
[ROW][C]10[/C][C]0.069649[/C][C]0.544[/C][C]0.29422[/C][/ROW]
[ROW][C]11[/C][C]-0.053357[/C][C]-0.4167[/C][C]0.339168[/C][/ROW]
[ROW][C]12[/C][C]-0.149744[/C][C]-1.1695[/C][C]0.123368[/C][/ROW]
[ROW][C]13[/C][C]-0.064119[/C][C]-0.5008[/C][C]0.309161[/C][/ROW]
[ROW][C]14[/C][C]0.016183[/C][C]0.1264[/C][C]0.449919[/C][/ROW]
[ROW][C]15[/C][C]-0.15657[/C][C]-1.2229[/C][C]0.113045[/C][/ROW]
[ROW][C]16[/C][C]0.128689[/C][C]1.0051[/C][C]0.15941[/C][/ROW]
[ROW][C]17[/C][C]-0.042359[/C][C]-0.3308[/C][C]0.370953[/C][/ROW]
[ROW][C]18[/C][C]-0.079958[/C][C]-0.6245[/C][C]0.267316[/C][/ROW]
[ROW][C]19[/C][C]-0.008497[/C][C]-0.0664[/C][C]0.473654[/C][/ROW]
[ROW][C]20[/C][C]-0.051525[/C][C]-0.4024[/C][C]0.344389[/C][/ROW]
[ROW][C]21[/C][C]-0.040079[/C][C]-0.313[/C][C]0.377665[/C][/ROW]
[ROW][C]22[/C][C]0.026241[/C][C]0.2049[/C][C]0.419148[/C][/ROW]
[ROW][C]23[/C][C]0.026177[/C][C]0.2044[/C][C]0.419341[/C][/ROW]
[ROW][C]24[/C][C]-0.054034[/C][C]-0.422[/C][C]0.337247[/C][/ROW]
[ROW][C]25[/C][C]0.046298[/C][C]0.3616[/C][C]0.35945[/C][/ROW]
[ROW][C]26[/C][C]-0.093332[/C][C]-0.7289[/C][C]0.234412[/C][/ROW]
[ROW][C]27[/C][C]0.030594[/C][C]0.2389[/C][C]0.405973[/C][/ROW]
[ROW][C]28[/C][C]0.000113[/C][C]9e-04[/C][C]0.499649[/C][/ROW]
[ROW][C]29[/C][C]-0.006499[/C][C]-0.0508[/C][C]0.479842[/C][/ROW]
[ROW][C]30[/C][C]0.037274[/C][C]0.2911[/C][C]0.385974[/C][/ROW]
[ROW][C]31[/C][C]-0.058337[/C][C]-0.4556[/C][C]0.325139[/C][/ROW]
[ROW][C]32[/C][C]-0.04161[/C][C]-0.325[/C][C]0.373153[/C][/ROW]
[ROW][C]33[/C][C]-0.05498[/C][C]-0.4294[/C][C]0.334569[/C][/ROW]
[ROW][C]34[/C][C]0.02967[/C][C]0.2317[/C][C]0.408761[/C][/ROW]
[ROW][C]35[/C][C]-0.022283[/C][C]-0.174[/C][C]0.431205[/C][/ROW]
[ROW][C]36[/C][C]0.006978[/C][C]0.0545[/C][C]0.478358[/C][/ROW]
[/TABLE]
Source: https://freestatistics.org/blog/index.php?pk=32293&T=2

Globally Unique Identifier (entire table): ba.freestatistics.org/blog/index.php?pk=32293&T=2

As an alternative you can also use a QR Code:  

The GUIDs for individual cells are displayed in the table below:

Partial Autocorrelation Function
Time lag kPACF(k)T-STATP-value
10.9346277.29970
2-0.235113-1.83630.035594
3-0.146835-1.14680.127968
40.0265690.20750.418151
50.1420711.10960.135762
6-0.163172-1.27440.103676
70.0089090.06960.472378
80.1251050.97710.166188
90.0323070.25230.400819
100.0696490.5440.29422
11-0.053357-0.41670.339168
12-0.149744-1.16950.123368
13-0.064119-0.50080.309161
140.0161830.12640.449919
15-0.15657-1.22290.113045
160.1286891.00510.15941
17-0.042359-0.33080.370953
18-0.079958-0.62450.267316
19-0.008497-0.06640.473654
20-0.051525-0.40240.344389
21-0.040079-0.3130.377665
220.0262410.20490.419148
230.0261770.20440.419341
24-0.054034-0.4220.337247
250.0462980.36160.35945
26-0.093332-0.72890.234412
270.0305940.23890.405973
280.0001139e-040.499649
29-0.006499-0.05080.479842
300.0372740.29110.385974
31-0.058337-0.45560.325139
32-0.04161-0.3250.373153
33-0.05498-0.42940.334569
340.029670.23170.408761
35-0.022283-0.1740.431205
360.0069780.05450.478358


Parameters (Session):
par1 = 36 ; par2 = 1 ; par3 = 0 ; par4 = 0 ; par5 = 12 ;
Parameters (R input):
par1 = 36 ; par2 = 1 ; par3 = 0 ; par4 = 0 ; par5 = 12 ;
R code (references can be found in the software module):
if (par1 == 'Default') {
par1 = 10*log10(length(x))
} else {
par1 <- as.numeric(par1)
}
par2 <- as.numeric(par2)
par3 <- as.numeric(par3)
par4 <- as.numeric(par4)
par5 <- as.numeric(par5)
if (par2 == 0) {
x <- log(x)
} else {
x <- (x ^ par2 - 1) / par2
}
if (par3 > 0) x <- diff(x,lag=1,difference=par3)
if (par4 > 0) x <- diff(x,lag=par5,difference=par4)
bitmap(file='pic1.png')
racf <- acf(x,par1,main='Autocorrelation',xlab='lags',ylab='ACF')
dev.off()
bitmap(file='pic2.png')
rpacf <- pacf(x,par1,main='Partial Autocorrelation',xlab='lags',ylab='PACF')
dev.off()
(myacf <- c(racf$acf))
(mypacf <- c(rpacf$acf))
lengthx <- length(x)
sqrtn <- sqrt(lengthx)
load(file='createtable')
a<-table.start()
a<-table.row.start(a)
a<-table.element(a,'Autocorrelation Function',4,TRUE)
a<-table.row.end(a)
a<-table.row.start(a)
a<-table.element(a,'Time lag k',header=TRUE)
a<-table.element(a,hyperlink('basics.htm','ACF(k)','click here for more information about the Autocorrelation Function'),header=TRUE)
a<-table.element(a,'T-STAT',header=TRUE)
a<-table.element(a,'P-value',header=TRUE)
a<-table.row.end(a)
for (i in 2:(par1+1)) {
a<-table.row.start(a)
a<-table.element(a,i-1,header=TRUE)
a<-table.element(a,round(myacf[i],6))
mytstat <- myacf[i]*sqrtn
a<-table.element(a,round(mytstat,4))
a<-table.element(a,round(1-pt(abs(mytstat),lengthx),6))
a<-table.row.end(a)
}
a<-table.end(a)
table.save(a,file='mytable.tab')
a<-table.start()
a<-table.row.start(a)
a<-table.element(a,'Partial Autocorrelation Function',4,TRUE)
a<-table.row.end(a)
a<-table.row.start(a)
a<-table.element(a,'Time lag k',header=TRUE)
a<-table.element(a,hyperlink('basics.htm','PACF(k)','click here for more information about the Partial Autocorrelation Function'),header=TRUE)
a<-table.element(a,'T-STAT',header=TRUE)
a<-table.element(a,'P-value',header=TRUE)
a<-table.row.end(a)
for (i in 1:par1) {
a<-table.row.start(a)
a<-table.element(a,i,header=TRUE)
a<-table.element(a,round(mypacf[i],6))
mytstat <- mypacf[i]*sqrtn
a<-table.element(a,round(mytstat,4))
a<-table.element(a,round(1-pt(abs(mytstat),lengthx),6))
a<-table.row.end(a)
}
a<-table.end(a)
table.save(a,file='mytable1.tab')