Free Statistics

of Irreproducible Research!

Author's title

Author*The author of this computation has been verified*
R Software Modulerwasp_autocorrelation.wasp
Title produced by software(Partial) Autocorrelation Function
Date of computationThu, 11 Dec 2008 06:53:36 -0700
Cite this page as followsStatistical Computations at FreeStatistics.org, Office for Research Development and Education, URL https://freestatistics.org/blog/index.php?v=date/2008/Dec/11/t1229003667ucckj7y9aij0wth.htm/, Retrieved Fri, 17 May 2024 02:01:32 +0000
Statistical Computations at FreeStatistics.org, Office for Research Development and Education, URL https://freestatistics.org/blog/index.php?pk=32236, Retrieved Fri, 17 May 2024 02:01:32 +0000
QR Codes:

Original text written by user:
IsPrivate?No (this computation is public)
User-defined keywordspaper vrouw 2
Estimated Impact170
Family? (F = Feedback message, R = changed R code, M = changed R Module, P = changed Parameters, D = changed Data)
F     [Law of Averages] [Random Walk Simul...] [2008-11-25 17:50:19] [b98453cac15ba1066b407e146608df68]
F       [Law of Averages] [Law of Averages] [2008-11-30 14:45:18] [415d0222c17b651a9576eaac006f530d]
- RMPD      [(Partial) Autocorrelation Function] [(P)ACF] [2008-12-11 13:53:36] [bb7e3816cefc365f4d7adcd50784b783] [Current]
Feedback Forum

Post a new message
Dataseries X:
9.9
9.8
9.4
8.3
8
8.5
10.4
11.1
10.9
9.9
9.2
9.2
9.5
9.6
9.5
9.1
8.9
9
10.1
10.3
10.2
9.6
9.2
9.3
9.4
9.4
9.2
9
9
9
9.8
10
9.9
9.3
9
9
9.1
9.1
9.1
9.2
8.8
8.3
8.4
8.1
7.8
7.9
7.9
8


Summary of computational transaction
Raw Inputview raw input (R code)
Raw Outputview raw output of R engine
Computing time1 seconds
R Server'George Udny Yule' @ 72.249.76.132

\begin{tabular}{lllllllll}
\hline
Summary of computational transaction \tabularnewline
Raw Input & view raw input (R code)  \tabularnewline
Raw Output & view raw output of R engine  \tabularnewline
Computing time & 1 seconds \tabularnewline
R Server & 'George Udny Yule' @ 72.249.76.132 \tabularnewline
\hline
\end{tabular}
%Source: https://freestatistics.org/blog/index.php?pk=32236&T=0

[TABLE]
[ROW][C]Summary of computational transaction[/C][/ROW]
[ROW][C]Raw Input[/C][C]view raw input (R code) [/C][/ROW]
[ROW][C]Raw Output[/C][C]view raw output of R engine [/C][/ROW]
[ROW][C]Computing time[/C][C]1 seconds[/C][/ROW]
[ROW][C]R Server[/C][C]'George Udny Yule' @ 72.249.76.132[/C][/ROW]
[/TABLE]
Source: https://freestatistics.org/blog/index.php?pk=32236&T=0

Globally Unique Identifier (entire table): ba.freestatistics.org/blog/index.php?pk=32236&T=0

As an alternative you can also use a QR Code:  

The GUIDs for individual cells are displayed in the table below:

Summary of computational transaction
Raw Inputview raw input (R code)
Raw Outputview raw output of R engine
Computing time1 seconds
R Server'George Udny Yule' @ 72.249.76.132


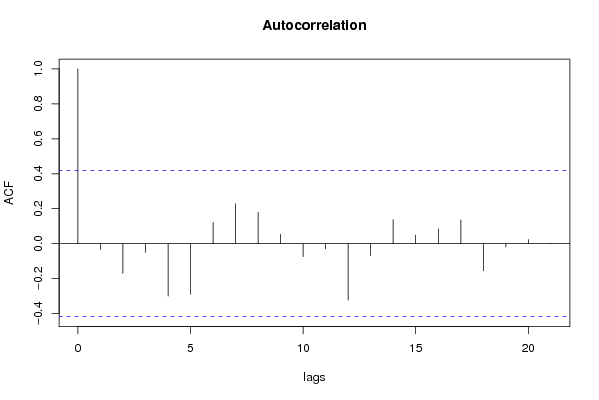
Autocorrelation Function
Time lag kACF(k)T-STATP-value
1-0.032707-0.15340.439736
2-0.169631-0.79560.217371
3-0.050278-0.23580.407876
4-0.300102-1.40760.086611
5-0.28907-1.35590.09445
60.1206670.5660.288569
70.2284931.07170.14773
80.1787320.83830.205432
90.0534930.25090.402108
10-0.07364-0.34540.366536
11-0.029765-0.13960.44512
12-0.322854-1.51430.07209
13-0.067862-0.31830.376629
140.1369160.64220.263691
150.0489430.22960.410277
160.0838180.39310.349
170.1357460.63670.265443
18-0.155448-0.72910.236811
19-0.019673-0.09230.463657
200.0232550.10910.457066
210.0009690.00450.498207
22NANANA
23NANANA
24NANANA
25NANANA
26NANANA
27NANANA
28NANANA
29NANANA
30NANANA
31NANANA
32NANANA
33NANANA
34NANANA
35NANANA
36NANANA

\begin{tabular}{lllllllll}
\hline
Autocorrelation Function \tabularnewline
Time lag k & ACF(k) & T-STAT & P-value \tabularnewline
1 & -0.032707 & -0.1534 & 0.439736 \tabularnewline
2 & -0.169631 & -0.7956 & 0.217371 \tabularnewline
3 & -0.050278 & -0.2358 & 0.407876 \tabularnewline
4 & -0.300102 & -1.4076 & 0.086611 \tabularnewline
5 & -0.28907 & -1.3559 & 0.09445 \tabularnewline
6 & 0.120667 & 0.566 & 0.288569 \tabularnewline
7 & 0.228493 & 1.0717 & 0.14773 \tabularnewline
8 & 0.178732 & 0.8383 & 0.205432 \tabularnewline
9 & 0.053493 & 0.2509 & 0.402108 \tabularnewline
10 & -0.07364 & -0.3454 & 0.366536 \tabularnewline
11 & -0.029765 & -0.1396 & 0.44512 \tabularnewline
12 & -0.322854 & -1.5143 & 0.07209 \tabularnewline
13 & -0.067862 & -0.3183 & 0.376629 \tabularnewline
14 & 0.136916 & 0.6422 & 0.263691 \tabularnewline
15 & 0.048943 & 0.2296 & 0.410277 \tabularnewline
16 & 0.083818 & 0.3931 & 0.349 \tabularnewline
17 & 0.135746 & 0.6367 & 0.265443 \tabularnewline
18 & -0.155448 & -0.7291 & 0.236811 \tabularnewline
19 & -0.019673 & -0.0923 & 0.463657 \tabularnewline
20 & 0.023255 & 0.1091 & 0.457066 \tabularnewline
21 & 0.000969 & 0.0045 & 0.498207 \tabularnewline
22 & NA & NA & NA \tabularnewline
23 & NA & NA & NA \tabularnewline
24 & NA & NA & NA \tabularnewline
25 & NA & NA & NA \tabularnewline
26 & NA & NA & NA \tabularnewline
27 & NA & NA & NA \tabularnewline
28 & NA & NA & NA \tabularnewline
29 & NA & NA & NA \tabularnewline
30 & NA & NA & NA \tabularnewline
31 & NA & NA & NA \tabularnewline
32 & NA & NA & NA \tabularnewline
33 & NA & NA & NA \tabularnewline
34 & NA & NA & NA \tabularnewline
35 & NA & NA & NA \tabularnewline
36 & NA & NA & NA \tabularnewline
\hline
\end{tabular}
%Source: https://freestatistics.org/blog/index.php?pk=32236&T=1

[TABLE]
[ROW][C]Autocorrelation Function[/C][/ROW]
[ROW][C]Time lag k[/C][C]ACF(k)[/C][C]T-STAT[/C][C]P-value[/C][/ROW]
[ROW][C]1[/C][C]-0.032707[/C][C]-0.1534[/C][C]0.439736[/C][/ROW]
[ROW][C]2[/C][C]-0.169631[/C][C]-0.7956[/C][C]0.217371[/C][/ROW]
[ROW][C]3[/C][C]-0.050278[/C][C]-0.2358[/C][C]0.407876[/C][/ROW]
[ROW][C]4[/C][C]-0.300102[/C][C]-1.4076[/C][C]0.086611[/C][/ROW]
[ROW][C]5[/C][C]-0.28907[/C][C]-1.3559[/C][C]0.09445[/C][/ROW]
[ROW][C]6[/C][C]0.120667[/C][C]0.566[/C][C]0.288569[/C][/ROW]
[ROW][C]7[/C][C]0.228493[/C][C]1.0717[/C][C]0.14773[/C][/ROW]
[ROW][C]8[/C][C]0.178732[/C][C]0.8383[/C][C]0.205432[/C][/ROW]
[ROW][C]9[/C][C]0.053493[/C][C]0.2509[/C][C]0.402108[/C][/ROW]
[ROW][C]10[/C][C]-0.07364[/C][C]-0.3454[/C][C]0.366536[/C][/ROW]
[ROW][C]11[/C][C]-0.029765[/C][C]-0.1396[/C][C]0.44512[/C][/ROW]
[ROW][C]12[/C][C]-0.322854[/C][C]-1.5143[/C][C]0.07209[/C][/ROW]
[ROW][C]13[/C][C]-0.067862[/C][C]-0.3183[/C][C]0.376629[/C][/ROW]
[ROW][C]14[/C][C]0.136916[/C][C]0.6422[/C][C]0.263691[/C][/ROW]
[ROW][C]15[/C][C]0.048943[/C][C]0.2296[/C][C]0.410277[/C][/ROW]
[ROW][C]16[/C][C]0.083818[/C][C]0.3931[/C][C]0.349[/C][/ROW]
[ROW][C]17[/C][C]0.135746[/C][C]0.6367[/C][C]0.265443[/C][/ROW]
[ROW][C]18[/C][C]-0.155448[/C][C]-0.7291[/C][C]0.236811[/C][/ROW]
[ROW][C]19[/C][C]-0.019673[/C][C]-0.0923[/C][C]0.463657[/C][/ROW]
[ROW][C]20[/C][C]0.023255[/C][C]0.1091[/C][C]0.457066[/C][/ROW]
[ROW][C]21[/C][C]0.000969[/C][C]0.0045[/C][C]0.498207[/C][/ROW]
[ROW][C]22[/C][C]NA[/C][C]NA[/C][C]NA[/C][/ROW]
[ROW][C]23[/C][C]NA[/C][C]NA[/C][C]NA[/C][/ROW]
[ROW][C]24[/C][C]NA[/C][C]NA[/C][C]NA[/C][/ROW]
[ROW][C]25[/C][C]NA[/C][C]NA[/C][C]NA[/C][/ROW]
[ROW][C]26[/C][C]NA[/C][C]NA[/C][C]NA[/C][/ROW]
[ROW][C]27[/C][C]NA[/C][C]NA[/C][C]NA[/C][/ROW]
[ROW][C]28[/C][C]NA[/C][C]NA[/C][C]NA[/C][/ROW]
[ROW][C]29[/C][C]NA[/C][C]NA[/C][C]NA[/C][/ROW]
[ROW][C]30[/C][C]NA[/C][C]NA[/C][C]NA[/C][/ROW]
[ROW][C]31[/C][C]NA[/C][C]NA[/C][C]NA[/C][/ROW]
[ROW][C]32[/C][C]NA[/C][C]NA[/C][C]NA[/C][/ROW]
[ROW][C]33[/C][C]NA[/C][C]NA[/C][C]NA[/C][/ROW]
[ROW][C]34[/C][C]NA[/C][C]NA[/C][C]NA[/C][/ROW]
[ROW][C]35[/C][C]NA[/C][C]NA[/C][C]NA[/C][/ROW]
[ROW][C]36[/C][C]NA[/C][C]NA[/C][C]NA[/C][/ROW]
[/TABLE]
Source: https://freestatistics.org/blog/index.php?pk=32236&T=1

Globally Unique Identifier (entire table): ba.freestatistics.org/blog/index.php?pk=32236&T=1

As an alternative you can also use a QR Code:  

The GUIDs for individual cells are displayed in the table below:

Autocorrelation Function
Time lag kACF(k)T-STATP-value
1-0.032707-0.15340.439736
2-0.169631-0.79560.217371
3-0.050278-0.23580.407876
4-0.300102-1.40760.086611
5-0.28907-1.35590.09445
60.1206670.5660.288569
70.2284931.07170.14773
80.1787320.83830.205432
90.0534930.25090.402108
10-0.07364-0.34540.366536
11-0.029765-0.13960.44512
12-0.322854-1.51430.07209
13-0.067862-0.31830.376629
140.1369160.64220.263691
150.0489430.22960.410277
160.0838180.39310.349
170.1357460.63670.265443
18-0.155448-0.72910.236811
19-0.019673-0.09230.463657
200.0232550.10910.457066
210.0009690.00450.498207
22NANANA
23NANANA
24NANANA
25NANANA
26NANANA
27NANANA
28NANANA
29NANANA
30NANANA
31NANANA
32NANANA
33NANANA
34NANANA
35NANANA
36NANANA


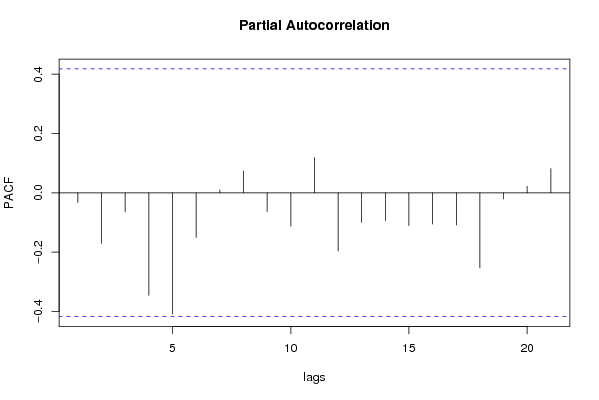
Partial Autocorrelation Function
Time lag kPACF(k)T-STATP-value
1-0.032707-0.15340.439736
2-0.170884-0.80150.215703
3-0.064308-0.30160.382883
4-0.345937-1.62260.059461
5-0.408601-1.91650.034191
6-0.15073-0.7070.243498
70.0095760.04490.48229
80.0738340.34630.366199
9-0.063124-0.29610.384974
10-0.112145-0.5260.302073
110.1189460.55790.29127
12-0.196398-0.92120.183472
13-0.099489-0.46660.322672
14-0.094116-0.44140.3316
15-0.110744-0.51940.304321
16-0.105337-0.49410.313076
17-0.108809-0.51040.307442
18-0.25332-1.18820.123717
19-0.02082-0.09770.461546
200.0217650.10210.459807
210.0819020.38420.352276
22NANANA
23NANANA
24NANANA
25NANANA
26NANANA
27NANANA
28NANANA
29NANANA
30NANANA
31NANANA
32NANANA
33NANANA
34NANANA
35NANANA
36NANANA

\begin{tabular}{lllllllll}
\hline
Partial Autocorrelation Function \tabularnewline
Time lag k & PACF(k) & T-STAT & P-value \tabularnewline
1 & -0.032707 & -0.1534 & 0.439736 \tabularnewline
2 & -0.170884 & -0.8015 & 0.215703 \tabularnewline
3 & -0.064308 & -0.3016 & 0.382883 \tabularnewline
4 & -0.345937 & -1.6226 & 0.059461 \tabularnewline
5 & -0.408601 & -1.9165 & 0.034191 \tabularnewline
6 & -0.15073 & -0.707 & 0.243498 \tabularnewline
7 & 0.009576 & 0.0449 & 0.48229 \tabularnewline
8 & 0.073834 & 0.3463 & 0.366199 \tabularnewline
9 & -0.063124 & -0.2961 & 0.384974 \tabularnewline
10 & -0.112145 & -0.526 & 0.302073 \tabularnewline
11 & 0.118946 & 0.5579 & 0.29127 \tabularnewline
12 & -0.196398 & -0.9212 & 0.183472 \tabularnewline
13 & -0.099489 & -0.4666 & 0.322672 \tabularnewline
14 & -0.094116 & -0.4414 & 0.3316 \tabularnewline
15 & -0.110744 & -0.5194 & 0.304321 \tabularnewline
16 & -0.105337 & -0.4941 & 0.313076 \tabularnewline
17 & -0.108809 & -0.5104 & 0.307442 \tabularnewline
18 & -0.25332 & -1.1882 & 0.123717 \tabularnewline
19 & -0.02082 & -0.0977 & 0.461546 \tabularnewline
20 & 0.021765 & 0.1021 & 0.459807 \tabularnewline
21 & 0.081902 & 0.3842 & 0.352276 \tabularnewline
22 & NA & NA & NA \tabularnewline
23 & NA & NA & NA \tabularnewline
24 & NA & NA & NA \tabularnewline
25 & NA & NA & NA \tabularnewline
26 & NA & NA & NA \tabularnewline
27 & NA & NA & NA \tabularnewline
28 & NA & NA & NA \tabularnewline
29 & NA & NA & NA \tabularnewline
30 & NA & NA & NA \tabularnewline
31 & NA & NA & NA \tabularnewline
32 & NA & NA & NA \tabularnewline
33 & NA & NA & NA \tabularnewline
34 & NA & NA & NA \tabularnewline
35 & NA & NA & NA \tabularnewline
36 & NA & NA & NA \tabularnewline
\hline
\end{tabular}
%Source: https://freestatistics.org/blog/index.php?pk=32236&T=2

[TABLE]
[ROW][C]Partial Autocorrelation Function[/C][/ROW]
[ROW][C]Time lag k[/C][C]PACF(k)[/C][C]T-STAT[/C][C]P-value[/C][/ROW]
[ROW][C]1[/C][C]-0.032707[/C][C]-0.1534[/C][C]0.439736[/C][/ROW]
[ROW][C]2[/C][C]-0.170884[/C][C]-0.8015[/C][C]0.215703[/C][/ROW]
[ROW][C]3[/C][C]-0.064308[/C][C]-0.3016[/C][C]0.382883[/C][/ROW]
[ROW][C]4[/C][C]-0.345937[/C][C]-1.6226[/C][C]0.059461[/C][/ROW]
[ROW][C]5[/C][C]-0.408601[/C][C]-1.9165[/C][C]0.034191[/C][/ROW]
[ROW][C]6[/C][C]-0.15073[/C][C]-0.707[/C][C]0.243498[/C][/ROW]
[ROW][C]7[/C][C]0.009576[/C][C]0.0449[/C][C]0.48229[/C][/ROW]
[ROW][C]8[/C][C]0.073834[/C][C]0.3463[/C][C]0.366199[/C][/ROW]
[ROW][C]9[/C][C]-0.063124[/C][C]-0.2961[/C][C]0.384974[/C][/ROW]
[ROW][C]10[/C][C]-0.112145[/C][C]-0.526[/C][C]0.302073[/C][/ROW]
[ROW][C]11[/C][C]0.118946[/C][C]0.5579[/C][C]0.29127[/C][/ROW]
[ROW][C]12[/C][C]-0.196398[/C][C]-0.9212[/C][C]0.183472[/C][/ROW]
[ROW][C]13[/C][C]-0.099489[/C][C]-0.4666[/C][C]0.322672[/C][/ROW]
[ROW][C]14[/C][C]-0.094116[/C][C]-0.4414[/C][C]0.3316[/C][/ROW]
[ROW][C]15[/C][C]-0.110744[/C][C]-0.5194[/C][C]0.304321[/C][/ROW]
[ROW][C]16[/C][C]-0.105337[/C][C]-0.4941[/C][C]0.313076[/C][/ROW]
[ROW][C]17[/C][C]-0.108809[/C][C]-0.5104[/C][C]0.307442[/C][/ROW]
[ROW][C]18[/C][C]-0.25332[/C][C]-1.1882[/C][C]0.123717[/C][/ROW]
[ROW][C]19[/C][C]-0.02082[/C][C]-0.0977[/C][C]0.461546[/C][/ROW]
[ROW][C]20[/C][C]0.021765[/C][C]0.1021[/C][C]0.459807[/C][/ROW]
[ROW][C]21[/C][C]0.081902[/C][C]0.3842[/C][C]0.352276[/C][/ROW]
[ROW][C]22[/C][C]NA[/C][C]NA[/C][C]NA[/C][/ROW]
[ROW][C]23[/C][C]NA[/C][C]NA[/C][C]NA[/C][/ROW]
[ROW][C]24[/C][C]NA[/C][C]NA[/C][C]NA[/C][/ROW]
[ROW][C]25[/C][C]NA[/C][C]NA[/C][C]NA[/C][/ROW]
[ROW][C]26[/C][C]NA[/C][C]NA[/C][C]NA[/C][/ROW]
[ROW][C]27[/C][C]NA[/C][C]NA[/C][C]NA[/C][/ROW]
[ROW][C]28[/C][C]NA[/C][C]NA[/C][C]NA[/C][/ROW]
[ROW][C]29[/C][C]NA[/C][C]NA[/C][C]NA[/C][/ROW]
[ROW][C]30[/C][C]NA[/C][C]NA[/C][C]NA[/C][/ROW]
[ROW][C]31[/C][C]NA[/C][C]NA[/C][C]NA[/C][/ROW]
[ROW][C]32[/C][C]NA[/C][C]NA[/C][C]NA[/C][/ROW]
[ROW][C]33[/C][C]NA[/C][C]NA[/C][C]NA[/C][/ROW]
[ROW][C]34[/C][C]NA[/C][C]NA[/C][C]NA[/C][/ROW]
[ROW][C]35[/C][C]NA[/C][C]NA[/C][C]NA[/C][/ROW]
[ROW][C]36[/C][C]NA[/C][C]NA[/C][C]NA[/C][/ROW]
[/TABLE]
Source: https://freestatistics.org/blog/index.php?pk=32236&T=2

Globally Unique Identifier (entire table): ba.freestatistics.org/blog/index.php?pk=32236&T=2

As an alternative you can also use a QR Code:  

The GUIDs for individual cells are displayed in the table below:

Partial Autocorrelation Function
Time lag kPACF(k)T-STATP-value
1-0.032707-0.15340.439736
2-0.170884-0.80150.215703
3-0.064308-0.30160.382883
4-0.345937-1.62260.059461
5-0.408601-1.91650.034191
6-0.15073-0.7070.243498
70.0095760.04490.48229
80.0738340.34630.366199
9-0.063124-0.29610.384974
10-0.112145-0.5260.302073
110.1189460.55790.29127
12-0.196398-0.92120.183472
13-0.099489-0.46660.322672
14-0.094116-0.44140.3316
15-0.110744-0.51940.304321
16-0.105337-0.49410.313076
17-0.108809-0.51040.307442
18-0.25332-1.18820.123717
19-0.02082-0.09770.461546
200.0217650.10210.459807
210.0819020.38420.352276
22NANANA
23NANANA
24NANANA
25NANANA
26NANANA
27NANANA
28NANANA
29NANANA
30NANANA
31NANANA
32NANANA
33NANANA
34NANANA
35NANANA
36NANANA


Parameters (Session):
par1 = 1 ; par2 = 1 ; par3 = 1 ; par4 = 12 ;
Parameters (R input):
par1 = 36 ; par2 = 1 ; par3 = 2 ; par4 = 2 ; par5 = 12 ;
R code (references can be found in the software module):
if (par1 == 'Default') {
par1 = 10*log10(length(x))
} else {
par1 <- as.numeric(par1)
}
par2 <- as.numeric(par2)
par3 <- as.numeric(par3)
par4 <- as.numeric(par4)
par5 <- as.numeric(par5)
if (par2 == 0) {
x <- log(x)
} else {
x <- (x ^ par2 - 1) / par2
}
if (par3 > 0) x <- diff(x,lag=1,difference=par3)
if (par4 > 0) x <- diff(x,lag=par5,difference=par4)
bitmap(file='pic1.png')
racf <- acf(x,par1,main='Autocorrelation',xlab='lags',ylab='ACF')
dev.off()
bitmap(file='pic2.png')
rpacf <- pacf(x,par1,main='Partial Autocorrelation',xlab='lags',ylab='PACF')
dev.off()
(myacf <- c(racf$acf))
(mypacf <- c(rpacf$acf))
lengthx <- length(x)
sqrtn <- sqrt(lengthx)
load(file='createtable')
a<-table.start()
a<-table.row.start(a)
a<-table.element(a,'Autocorrelation Function',4,TRUE)
a<-table.row.end(a)
a<-table.row.start(a)
a<-table.element(a,'Time lag k',header=TRUE)
a<-table.element(a,hyperlink('basics.htm','ACF(k)','click here for more information about the Autocorrelation Function'),header=TRUE)
a<-table.element(a,'T-STAT',header=TRUE)
a<-table.element(a,'P-value',header=TRUE)
a<-table.row.end(a)
for (i in 2:(par1+1)) {
a<-table.row.start(a)
a<-table.element(a,i-1,header=TRUE)
a<-table.element(a,round(myacf[i],6))
mytstat <- myacf[i]*sqrtn
a<-table.element(a,round(mytstat,4))
a<-table.element(a,round(1-pt(abs(mytstat),lengthx),6))
a<-table.row.end(a)
}
a<-table.end(a)
table.save(a,file='mytable.tab')
a<-table.start()
a<-table.row.start(a)
a<-table.element(a,'Partial Autocorrelation Function',4,TRUE)
a<-table.row.end(a)
a<-table.row.start(a)
a<-table.element(a,'Time lag k',header=TRUE)
a<-table.element(a,hyperlink('basics.htm','PACF(k)','click here for more information about the Partial Autocorrelation Function'),header=TRUE)
a<-table.element(a,'T-STAT',header=TRUE)
a<-table.element(a,'P-value',header=TRUE)
a<-table.row.end(a)
for (i in 1:par1) {
a<-table.row.start(a)
a<-table.element(a,i,header=TRUE)
a<-table.element(a,round(mypacf[i],6))
mytstat <- mypacf[i]*sqrtn
a<-table.element(a,round(mytstat,4))
a<-table.element(a,round(1-pt(abs(mytstat),lengthx),6))
a<-table.row.end(a)
}
a<-table.end(a)
table.save(a,file='mytable1.tab')