Free Statistics

of Irreproducible Research!

Author's title

Author*The author of this computation has been verified*
R Software Modulerwasp_autocorrelation.wasp
Title produced by software(Partial) Autocorrelation Function
Date of computationThu, 11 Dec 2008 05:56:18 -0700
Cite this page as followsStatistical Computations at FreeStatistics.org, Office for Research Development and Education, URL https://freestatistics.org/blog/index.php?v=date/2008/Dec/11/t1229000817gw4zm2acuwnmmrt.htm/, Retrieved Fri, 17 May 2024 02:02:06 +0000
Statistical Computations at FreeStatistics.org, Office for Research Development and Education, URL https://freestatistics.org/blog/index.php?pk=32210, Retrieved Fri, 17 May 2024 02:02:06 +0000
QR Codes:

Original text written by user:
IsPrivate?No (this computation is public)
User-defined keywords
Estimated Impact167
Family? (F = Feedback message, R = changed R code, M = changed R Module, P = changed Parameters, D = changed Data)
-       [(Partial) Autocorrelation Function] [VAC paper autocor...] [2008-12-11 12:56:18] [490fee4f334e2e025c95681783e3fd0b] [Current]
Feedback Forum

Post a new message
Dataseries X:
124.1
124.4
115.7
108.3
102.3
104.6
104
103.5
96
96.6
95.4
92.1
93
90.4
93.3
97.1
111
114.1
113.3
111
107.2
118.3
134.1
139
116.7
112.5
122.8
130
125.6
123.8
135.8
136.4
135.3
149.5
159.6
161.4
175.2
199.5
245
257.8


Summary of computational transaction
Raw Inputview raw input (R code)
Raw Outputview raw output of R engine
Computing time1 seconds
R Server'Gwilym Jenkins' @ 72.249.127.135

\begin{tabular}{lllllllll}
\hline
Summary of computational transaction \tabularnewline
Raw Input & view raw input (R code)  \tabularnewline
Raw Output & view raw output of R engine  \tabularnewline
Computing time & 1 seconds \tabularnewline
R Server & 'Gwilym Jenkins' @ 72.249.127.135 \tabularnewline
\hline
\end{tabular}
%Source: https://freestatistics.org/blog/index.php?pk=32210&T=0

[TABLE]
[ROW][C]Summary of computational transaction[/C][/ROW]
[ROW][C]Raw Input[/C][C]view raw input (R code) [/C][/ROW]
[ROW][C]Raw Output[/C][C]view raw output of R engine [/C][/ROW]
[ROW][C]Computing time[/C][C]1 seconds[/C][/ROW]
[ROW][C]R Server[/C][C]'Gwilym Jenkins' @ 72.249.127.135[/C][/ROW]
[/TABLE]
Source: https://freestatistics.org/blog/index.php?pk=32210&T=0

Globally Unique Identifier (entire table): ba.freestatistics.org/blog/index.php?pk=32210&T=0

As an alternative you can also use a QR Code:  

The GUIDs for individual cells are displayed in the table below:

Summary of computational transaction
Raw Inputview raw input (R code)
Raw Outputview raw output of R engine
Computing time1 seconds
R Server'Gwilym Jenkins' @ 72.249.127.135


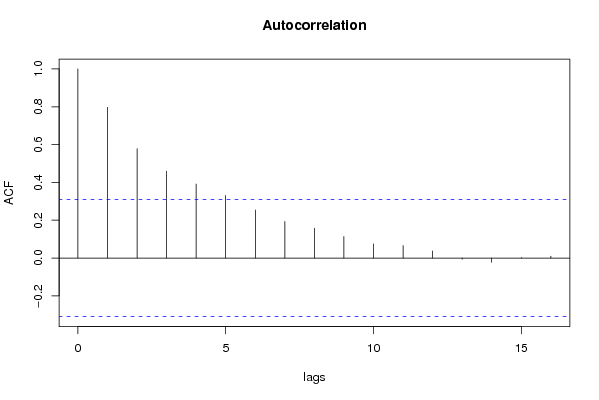
Autocorrelation Function
Time lag kACF(k)T-STATP-value
10.7974325.04345e-06
20.5784243.65830.000366
30.4596562.90710.002962
40.3914622.47580.008812
50.3309492.09310.021364
60.253531.60350.05835
70.1936251.22460.113946
80.1581791.00040.161563
90.1136830.7190.238162
100.0748430.47330.319269
110.0658370.41640.339675
120.0379260.23990.405831
13-0.006343-0.04010.484099
14-0.022277-0.14090.444332
150.00230.01450.494233
160.0099010.06260.47519

\begin{tabular}{lllllllll}
\hline
Autocorrelation Function \tabularnewline
Time lag k & ACF(k) & T-STAT & P-value \tabularnewline
1 & 0.797432 & 5.0434 & 5e-06 \tabularnewline
2 & 0.578424 & 3.6583 & 0.000366 \tabularnewline
3 & 0.459656 & 2.9071 & 0.002962 \tabularnewline
4 & 0.391462 & 2.4758 & 0.008812 \tabularnewline
5 & 0.330949 & 2.0931 & 0.021364 \tabularnewline
6 & 0.25353 & 1.6035 & 0.05835 \tabularnewline
7 & 0.193625 & 1.2246 & 0.113946 \tabularnewline
8 & 0.158179 & 1.0004 & 0.161563 \tabularnewline
9 & 0.113683 & 0.719 & 0.238162 \tabularnewline
10 & 0.074843 & 0.4733 & 0.319269 \tabularnewline
11 & 0.065837 & 0.4164 & 0.339675 \tabularnewline
12 & 0.037926 & 0.2399 & 0.405831 \tabularnewline
13 & -0.006343 & -0.0401 & 0.484099 \tabularnewline
14 & -0.022277 & -0.1409 & 0.444332 \tabularnewline
15 & 0.0023 & 0.0145 & 0.494233 \tabularnewline
16 & 0.009901 & 0.0626 & 0.47519 \tabularnewline
\hline
\end{tabular}
%Source: https://freestatistics.org/blog/index.php?pk=32210&T=1

[TABLE]
[ROW][C]Autocorrelation Function[/C][/ROW]
[ROW][C]Time lag k[/C][C]ACF(k)[/C][C]T-STAT[/C][C]P-value[/C][/ROW]
[ROW][C]1[/C][C]0.797432[/C][C]5.0434[/C][C]5e-06[/C][/ROW]
[ROW][C]2[/C][C]0.578424[/C][C]3.6583[/C][C]0.000366[/C][/ROW]
[ROW][C]3[/C][C]0.459656[/C][C]2.9071[/C][C]0.002962[/C][/ROW]
[ROW][C]4[/C][C]0.391462[/C][C]2.4758[/C][C]0.008812[/C][/ROW]
[ROW][C]5[/C][C]0.330949[/C][C]2.0931[/C][C]0.021364[/C][/ROW]
[ROW][C]6[/C][C]0.25353[/C][C]1.6035[/C][C]0.05835[/C][/ROW]
[ROW][C]7[/C][C]0.193625[/C][C]1.2246[/C][C]0.113946[/C][/ROW]
[ROW][C]8[/C][C]0.158179[/C][C]1.0004[/C][C]0.161563[/C][/ROW]
[ROW][C]9[/C][C]0.113683[/C][C]0.719[/C][C]0.238162[/C][/ROW]
[ROW][C]10[/C][C]0.074843[/C][C]0.4733[/C][C]0.319269[/C][/ROW]
[ROW][C]11[/C][C]0.065837[/C][C]0.4164[/C][C]0.339675[/C][/ROW]
[ROW][C]12[/C][C]0.037926[/C][C]0.2399[/C][C]0.405831[/C][/ROW]
[ROW][C]13[/C][C]-0.006343[/C][C]-0.0401[/C][C]0.484099[/C][/ROW]
[ROW][C]14[/C][C]-0.022277[/C][C]-0.1409[/C][C]0.444332[/C][/ROW]
[ROW][C]15[/C][C]0.0023[/C][C]0.0145[/C][C]0.494233[/C][/ROW]
[ROW][C]16[/C][C]0.009901[/C][C]0.0626[/C][C]0.47519[/C][/ROW]
[/TABLE]
Source: https://freestatistics.org/blog/index.php?pk=32210&T=1

Globally Unique Identifier (entire table): ba.freestatistics.org/blog/index.php?pk=32210&T=1

As an alternative you can also use a QR Code:  

The GUIDs for individual cells are displayed in the table below:

Autocorrelation Function
Time lag kACF(k)T-STATP-value
10.7974325.04345e-06
20.5784243.65830.000366
30.4596562.90710.002962
40.3914622.47580.008812
50.3309492.09310.021364
60.253531.60350.05835
70.1936251.22460.113946
80.1581791.00040.161563
90.1136830.7190.238162
100.0748430.47330.319269
110.0658370.41640.339675
120.0379260.23990.405831
13-0.006343-0.04010.484099
14-0.022277-0.14090.444332
150.00230.01450.494233
160.0099010.06260.47519


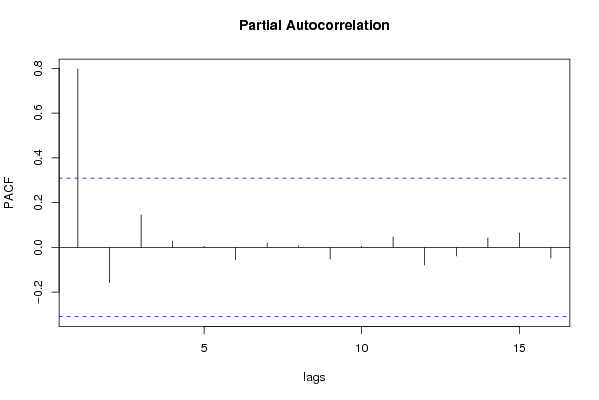
Partial Autocorrelation Function
Time lag kPACF(k)T-STATP-value
10.7974325.04345e-06
2-0.15785-0.99830.16206
30.1449680.91690.182357
40.0278050.17590.430648
50.0048240.03050.487907
6-0.05605-0.35450.362417
70.0193850.12260.451519
80.0064210.04060.483903
9-0.052367-0.33120.371111
100.0052460.03320.486849
110.0460710.29140.386133
12-0.07847-0.49630.311204
13-0.038568-0.24390.404268
140.0416150.26320.396875
150.0641860.40590.343473
16-0.048158-0.30460.381133

\begin{tabular}{lllllllll}
\hline
Partial Autocorrelation Function \tabularnewline
Time lag k & PACF(k) & T-STAT & P-value \tabularnewline
1 & 0.797432 & 5.0434 & 5e-06 \tabularnewline
2 & -0.15785 & -0.9983 & 0.16206 \tabularnewline
3 & 0.144968 & 0.9169 & 0.182357 \tabularnewline
4 & 0.027805 & 0.1759 & 0.430648 \tabularnewline
5 & 0.004824 & 0.0305 & 0.487907 \tabularnewline
6 & -0.05605 & -0.3545 & 0.362417 \tabularnewline
7 & 0.019385 & 0.1226 & 0.451519 \tabularnewline
8 & 0.006421 & 0.0406 & 0.483903 \tabularnewline
9 & -0.052367 & -0.3312 & 0.371111 \tabularnewline
10 & 0.005246 & 0.0332 & 0.486849 \tabularnewline
11 & 0.046071 & 0.2914 & 0.386133 \tabularnewline
12 & -0.07847 & -0.4963 & 0.311204 \tabularnewline
13 & -0.038568 & -0.2439 & 0.404268 \tabularnewline
14 & 0.041615 & 0.2632 & 0.396875 \tabularnewline
15 & 0.064186 & 0.4059 & 0.343473 \tabularnewline
16 & -0.048158 & -0.3046 & 0.381133 \tabularnewline
\hline
\end{tabular}
%Source: https://freestatistics.org/blog/index.php?pk=32210&T=2

[TABLE]
[ROW][C]Partial Autocorrelation Function[/C][/ROW]
[ROW][C]Time lag k[/C][C]PACF(k)[/C][C]T-STAT[/C][C]P-value[/C][/ROW]
[ROW][C]1[/C][C]0.797432[/C][C]5.0434[/C][C]5e-06[/C][/ROW]
[ROW][C]2[/C][C]-0.15785[/C][C]-0.9983[/C][C]0.16206[/C][/ROW]
[ROW][C]3[/C][C]0.144968[/C][C]0.9169[/C][C]0.182357[/C][/ROW]
[ROW][C]4[/C][C]0.027805[/C][C]0.1759[/C][C]0.430648[/C][/ROW]
[ROW][C]5[/C][C]0.004824[/C][C]0.0305[/C][C]0.487907[/C][/ROW]
[ROW][C]6[/C][C]-0.05605[/C][C]-0.3545[/C][C]0.362417[/C][/ROW]
[ROW][C]7[/C][C]0.019385[/C][C]0.1226[/C][C]0.451519[/C][/ROW]
[ROW][C]8[/C][C]0.006421[/C][C]0.0406[/C][C]0.483903[/C][/ROW]
[ROW][C]9[/C][C]-0.052367[/C][C]-0.3312[/C][C]0.371111[/C][/ROW]
[ROW][C]10[/C][C]0.005246[/C][C]0.0332[/C][C]0.486849[/C][/ROW]
[ROW][C]11[/C][C]0.046071[/C][C]0.2914[/C][C]0.386133[/C][/ROW]
[ROW][C]12[/C][C]-0.07847[/C][C]-0.4963[/C][C]0.311204[/C][/ROW]
[ROW][C]13[/C][C]-0.038568[/C][C]-0.2439[/C][C]0.404268[/C][/ROW]
[ROW][C]14[/C][C]0.041615[/C][C]0.2632[/C][C]0.396875[/C][/ROW]
[ROW][C]15[/C][C]0.064186[/C][C]0.4059[/C][C]0.343473[/C][/ROW]
[ROW][C]16[/C][C]-0.048158[/C][C]-0.3046[/C][C]0.381133[/C][/ROW]
[/TABLE]
Source: https://freestatistics.org/blog/index.php?pk=32210&T=2

Globally Unique Identifier (entire table): ba.freestatistics.org/blog/index.php?pk=32210&T=2

As an alternative you can also use a QR Code:  

The GUIDs for individual cells are displayed in the table below:

Partial Autocorrelation Function
Time lag kPACF(k)T-STATP-value
10.7974325.04345e-06
2-0.15785-0.99830.16206
30.1449680.91690.182357
40.0278050.17590.430648
50.0048240.03050.487907
6-0.05605-0.35450.362417
70.0193850.12260.451519
80.0064210.04060.483903
9-0.052367-0.33120.371111
100.0052460.03320.486849
110.0460710.29140.386133
12-0.07847-0.49630.311204
13-0.038568-0.24390.404268
140.0416150.26320.396875
150.0641860.40590.343473
16-0.048158-0.30460.381133


Parameters (Session):
par1 = Default ; par2 = 1 ; par3 = 0 ; par4 = 0 ; par5 = 4 ;
Parameters (R input):
par1 = Default ; par2 = 1 ; par3 = 0 ; par4 = 0 ; par5 = 4 ;
R code (references can be found in the software module):
if (par1 == 'Default') {
par1 = 10*log10(length(x))
} else {
par1 <- as.numeric(par1)
}
par2 <- as.numeric(par2)
par3 <- as.numeric(par3)
par4 <- as.numeric(par4)
par5 <- as.numeric(par5)
if (par2 == 0) {
x <- log(x)
} else {
x <- (x ^ par2 - 1) / par2
}
if (par3 > 0) x <- diff(x,lag=1,difference=par3)
if (par4 > 0) x <- diff(x,lag=par5,difference=par4)
bitmap(file='pic1.png')
racf <- acf(x,par1,main='Autocorrelation',xlab='lags',ylab='ACF')
dev.off()
bitmap(file='pic2.png')
rpacf <- pacf(x,par1,main='Partial Autocorrelation',xlab='lags',ylab='PACF')
dev.off()
(myacf <- c(racf$acf))
(mypacf <- c(rpacf$acf))
lengthx <- length(x)
sqrtn <- sqrt(lengthx)
load(file='createtable')
a<-table.start()
a<-table.row.start(a)
a<-table.element(a,'Autocorrelation Function',4,TRUE)
a<-table.row.end(a)
a<-table.row.start(a)
a<-table.element(a,'Time lag k',header=TRUE)
a<-table.element(a,hyperlink('basics.htm','ACF(k)','click here for more information about the Autocorrelation Function'),header=TRUE)
a<-table.element(a,'T-STAT',header=TRUE)
a<-table.element(a,'P-value',header=TRUE)
a<-table.row.end(a)
for (i in 2:(par1+1)) {
a<-table.row.start(a)
a<-table.element(a,i-1,header=TRUE)
a<-table.element(a,round(myacf[i],6))
mytstat <- myacf[i]*sqrtn
a<-table.element(a,round(mytstat,4))
a<-table.element(a,round(1-pt(abs(mytstat),lengthx),6))
a<-table.row.end(a)
}
a<-table.end(a)
table.save(a,file='mytable.tab')
a<-table.start()
a<-table.row.start(a)
a<-table.element(a,'Partial Autocorrelation Function',4,TRUE)
a<-table.row.end(a)
a<-table.row.start(a)
a<-table.element(a,'Time lag k',header=TRUE)
a<-table.element(a,hyperlink('basics.htm','PACF(k)','click here for more information about the Partial Autocorrelation Function'),header=TRUE)
a<-table.element(a,'T-STAT',header=TRUE)
a<-table.element(a,'P-value',header=TRUE)
a<-table.row.end(a)
for (i in 1:par1) {
a<-table.row.start(a)
a<-table.element(a,i,header=TRUE)
a<-table.element(a,round(mypacf[i],6))
mytstat <- mypacf[i]*sqrtn
a<-table.element(a,round(mytstat,4))
a<-table.element(a,round(1-pt(abs(mytstat),lengthx),6))
a<-table.row.end(a)
}
a<-table.end(a)
table.save(a,file='mytable1.tab')