Free Statistics

of Irreproducible Research!

Author's title

Author*The author of this computation has been verified*
R Software Modulerwasp_autocorrelation.wasp
Title produced by software(Partial) Autocorrelation Function
Date of computationWed, 10 Dec 2008 14:11:19 -0700
Cite this page as followsStatistical Computations at FreeStatistics.org, Office for Research Development and Education, URL https://freestatistics.org/blog/index.php?v=date/2008/Dec/10/t122894352255kmbzoofjezwu7.htm/, Retrieved Fri, 17 May 2024 05:45:08 +0000
Statistical Computations at FreeStatistics.org, Office for Research Development and Education, URL https://freestatistics.org/blog/index.php?pk=32123, Retrieved Fri, 17 May 2024 05:45:08 +0000
QR Codes:

Original text written by user:
IsPrivate?No (this computation is public)
User-defined keywords
Estimated Impact176
Family? (F = Feedback message, R = changed R code, M = changed R Module, P = changed Parameters, D = changed Data)
-       [(Partial) Autocorrelation Function] [ACF werkloosheid ...] [2008-12-10 21:11:19] [270782e2502ae87124d0ebdcd1862d6a] [Current]
-   P     [(Partial) Autocorrelation Function] [ACF werkloosheid ...] [2008-12-14 11:32:04] [57fa5e3679c393aa19449b2f1be9928b]
-           [(Partial) Autocorrelation Function] [] [2008-12-21 20:52:13] [ffbe22449df335faef31f462015daa42]
-           [(Partial) Autocorrelation Function] [] [2008-12-21 21:31:41] [a4ee3bef49b119f4bd2e925060c84f5e]
Feedback Forum

Post a new message
Dataseries X:
451
450
444
429
421
400
389
384
432
446
431
423
416
416
413
399
386
374
365
365
418
428
424
421
417
423
423
419
406
398
390
391
444
460
455
456
452
459
461
451
443
439
430
436
488
506
502
501
501
515
521
520
512
509
505
511
570
592
594
586
586
592
594
586
572
563
555
554
601
622
617
606
595
599
600
592
575
567
555
555
608
631
629
624
610
616
621
604
584
574
555
545
599
620
608
590
579
580
579
572
560
551
537
541
588
607
599
578
563
566
561
554
540
526
512
505
554
584
569
540
522
526
527
516
503
489
479
475
524
552
532
511
492
492
493
481
462
457
442
439
488
521
501
485
464
460
467
460
448
443
436
431
484
510
513
503
471
471
476
475
470
461
455
456
517
525
523
519
509
512
519
517
510
509
501
507
569
580
578
565
547
555
562
561
555
544
537
543
594
611
613
611
594
595
591
589
584
573
567
569
621
629
628
612
595
597
593
590
580
574
573
573
620
626
620
588
566
557
561
549
532
526
511
499
555
565
542
527
510
514
517
508
493
490
469
478
528
534
518
506
502


Summary of computational transaction
Raw Inputview raw input (R code)
Raw Outputview raw output of R engine
Computing time2 seconds
R Server'Gwilym Jenkins' @ 72.249.127.135

\begin{tabular}{lllllllll}
\hline
Summary of computational transaction \tabularnewline
Raw Input & view raw input (R code)  \tabularnewline
Raw Output & view raw output of R engine  \tabularnewline
Computing time & 2 seconds \tabularnewline
R Server & 'Gwilym Jenkins' @ 72.249.127.135 \tabularnewline
\hline
\end{tabular}
%Source: https://freestatistics.org/blog/index.php?pk=32123&T=0

[TABLE]
[ROW][C]Summary of computational transaction[/C][/ROW]
[ROW][C]Raw Input[/C][C]view raw input (R code) [/C][/ROW]
[ROW][C]Raw Output[/C][C]view raw output of R engine [/C][/ROW]
[ROW][C]Computing time[/C][C]2 seconds[/C][/ROW]
[ROW][C]R Server[/C][C]'Gwilym Jenkins' @ 72.249.127.135[/C][/ROW]
[/TABLE]
Source: https://freestatistics.org/blog/index.php?pk=32123&T=0

Globally Unique Identifier (entire table): ba.freestatistics.org/blog/index.php?pk=32123&T=0

As an alternative you can also use a QR Code:  

The GUIDs for individual cells are displayed in the table below:

Summary of computational transaction
Raw Inputview raw input (R code)
Raw Outputview raw output of R engine
Computing time2 seconds
R Server'Gwilym Jenkins' @ 72.249.127.135


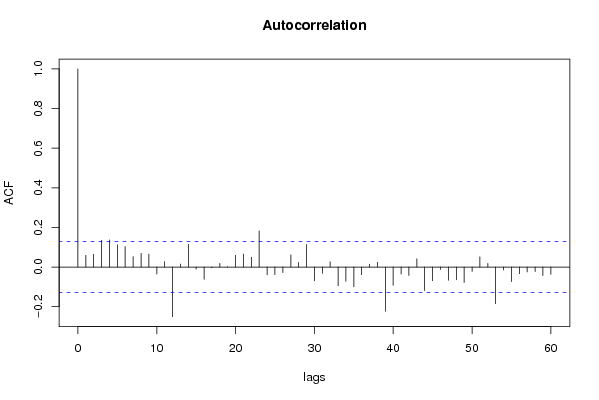
Autocorrelation Function
Time lag kACF(k)T-STATP-value
10.0592070.8940.186129
20.0640040.96640.167426
30.1347432.03460.021526
40.1364942.0610.020218
50.112211.69430.045783
60.1032471.5590.060191
70.0520610.78610.216313
80.0695071.04950.147523
90.0650960.98290.163343
10-0.035495-0.5360.296255
110.0275530.4160.338886
12-0.250591-3.78389.9e-05
130.0152390.23010.409106
140.1144281.72780.042687
15-0.010686-0.16140.435979
16-0.062056-0.9370.17487
17-0.003729-0.05630.477576
180.0182610.27570.391502
190.001650.02490.490072
200.0589710.89040.187082
210.0655870.99030.161527
220.0494030.7460.228229
230.1820912.74950.003223
24-0.039391-0.59480.276287
25-0.038908-0.58750.278724
26-0.02819-0.42570.335377
270.0616130.93030.176592
280.0234170.35360.361987
290.1133371.71140.044188
30-0.069541-1.05010.147403
31-0.032007-0.48330.314673
320.0263190.39740.345719
33-0.095158-1.43690.076064
34-0.072476-1.09440.137475
35-0.099694-1.50530.06681
36-0.038606-0.58290.280255
370.0143020.2160.414606
380.0236730.35740.360544
39-0.223579-3.3760.000432
40-0.092164-1.39160.082693
41-0.035859-0.54150.294358
42-0.042747-0.64550.259636
430.0414060.62520.266229
44-0.118945-1.7960.036907
45-0.068833-1.03940.14987
46-0.013071-0.19740.42186
47-0.066472-1.00370.158293
48-0.064378-0.97210.16602
49-0.078068-1.17880.119854
50-0.022488-0.33960.367249
510.0518250.78250.217357
520.0179170.27050.393495
53-0.185329-2.79840.002788
54-0.014888-0.22480.411168
55-0.073184-1.1050.135152
56-0.033903-0.51190.3046
57-0.02504-0.37810.352856
58-0.022734-0.34330.365852
59-0.043211-0.65250.257375
60-0.036833-0.55620.289323

\begin{tabular}{lllllllll}
\hline
Autocorrelation Function \tabularnewline
Time lag k & ACF(k) & T-STAT & P-value \tabularnewline
1 & 0.059207 & 0.894 & 0.186129 \tabularnewline
2 & 0.064004 & 0.9664 & 0.167426 \tabularnewline
3 & 0.134743 & 2.0346 & 0.021526 \tabularnewline
4 & 0.136494 & 2.061 & 0.020218 \tabularnewline
5 & 0.11221 & 1.6943 & 0.045783 \tabularnewline
6 & 0.103247 & 1.559 & 0.060191 \tabularnewline
7 & 0.052061 & 0.7861 & 0.216313 \tabularnewline
8 & 0.069507 & 1.0495 & 0.147523 \tabularnewline
9 & 0.065096 & 0.9829 & 0.163343 \tabularnewline
10 & -0.035495 & -0.536 & 0.296255 \tabularnewline
11 & 0.027553 & 0.416 & 0.338886 \tabularnewline
12 & -0.250591 & -3.7838 & 9.9e-05 \tabularnewline
13 & 0.015239 & 0.2301 & 0.409106 \tabularnewline
14 & 0.114428 & 1.7278 & 0.042687 \tabularnewline
15 & -0.010686 & -0.1614 & 0.435979 \tabularnewline
16 & -0.062056 & -0.937 & 0.17487 \tabularnewline
17 & -0.003729 & -0.0563 & 0.477576 \tabularnewline
18 & 0.018261 & 0.2757 & 0.391502 \tabularnewline
19 & 0.00165 & 0.0249 & 0.490072 \tabularnewline
20 & 0.058971 & 0.8904 & 0.187082 \tabularnewline
21 & 0.065587 & 0.9903 & 0.161527 \tabularnewline
22 & 0.049403 & 0.746 & 0.228229 \tabularnewline
23 & 0.182091 & 2.7495 & 0.003223 \tabularnewline
24 & -0.039391 & -0.5948 & 0.276287 \tabularnewline
25 & -0.038908 & -0.5875 & 0.278724 \tabularnewline
26 & -0.02819 & -0.4257 & 0.335377 \tabularnewline
27 & 0.061613 & 0.9303 & 0.176592 \tabularnewline
28 & 0.023417 & 0.3536 & 0.361987 \tabularnewline
29 & 0.113337 & 1.7114 & 0.044188 \tabularnewline
30 & -0.069541 & -1.0501 & 0.147403 \tabularnewline
31 & -0.032007 & -0.4833 & 0.314673 \tabularnewline
32 & 0.026319 & 0.3974 & 0.345719 \tabularnewline
33 & -0.095158 & -1.4369 & 0.076064 \tabularnewline
34 & -0.072476 & -1.0944 & 0.137475 \tabularnewline
35 & -0.099694 & -1.5053 & 0.06681 \tabularnewline
36 & -0.038606 & -0.5829 & 0.280255 \tabularnewline
37 & 0.014302 & 0.216 & 0.414606 \tabularnewline
38 & 0.023673 & 0.3574 & 0.360544 \tabularnewline
39 & -0.223579 & -3.376 & 0.000432 \tabularnewline
40 & -0.092164 & -1.3916 & 0.082693 \tabularnewline
41 & -0.035859 & -0.5415 & 0.294358 \tabularnewline
42 & -0.042747 & -0.6455 & 0.259636 \tabularnewline
43 & 0.041406 & 0.6252 & 0.266229 \tabularnewline
44 & -0.118945 & -1.796 & 0.036907 \tabularnewline
45 & -0.068833 & -1.0394 & 0.14987 \tabularnewline
46 & -0.013071 & -0.1974 & 0.42186 \tabularnewline
47 & -0.066472 & -1.0037 & 0.158293 \tabularnewline
48 & -0.064378 & -0.9721 & 0.16602 \tabularnewline
49 & -0.078068 & -1.1788 & 0.119854 \tabularnewline
50 & -0.022488 & -0.3396 & 0.367249 \tabularnewline
51 & 0.051825 & 0.7825 & 0.217357 \tabularnewline
52 & 0.017917 & 0.2705 & 0.393495 \tabularnewline
53 & -0.185329 & -2.7984 & 0.002788 \tabularnewline
54 & -0.014888 & -0.2248 & 0.411168 \tabularnewline
55 & -0.073184 & -1.105 & 0.135152 \tabularnewline
56 & -0.033903 & -0.5119 & 0.3046 \tabularnewline
57 & -0.02504 & -0.3781 & 0.352856 \tabularnewline
58 & -0.022734 & -0.3433 & 0.365852 \tabularnewline
59 & -0.043211 & -0.6525 & 0.257375 \tabularnewline
60 & -0.036833 & -0.5562 & 0.289323 \tabularnewline
\hline
\end{tabular}
%Source: https://freestatistics.org/blog/index.php?pk=32123&T=1

[TABLE]
[ROW][C]Autocorrelation Function[/C][/ROW]
[ROW][C]Time lag k[/C][C]ACF(k)[/C][C]T-STAT[/C][C]P-value[/C][/ROW]
[ROW][C]1[/C][C]0.059207[/C][C]0.894[/C][C]0.186129[/C][/ROW]
[ROW][C]2[/C][C]0.064004[/C][C]0.9664[/C][C]0.167426[/C][/ROW]
[ROW][C]3[/C][C]0.134743[/C][C]2.0346[/C][C]0.021526[/C][/ROW]
[ROW][C]4[/C][C]0.136494[/C][C]2.061[/C][C]0.020218[/C][/ROW]
[ROW][C]5[/C][C]0.11221[/C][C]1.6943[/C][C]0.045783[/C][/ROW]
[ROW][C]6[/C][C]0.103247[/C][C]1.559[/C][C]0.060191[/C][/ROW]
[ROW][C]7[/C][C]0.052061[/C][C]0.7861[/C][C]0.216313[/C][/ROW]
[ROW][C]8[/C][C]0.069507[/C][C]1.0495[/C][C]0.147523[/C][/ROW]
[ROW][C]9[/C][C]0.065096[/C][C]0.9829[/C][C]0.163343[/C][/ROW]
[ROW][C]10[/C][C]-0.035495[/C][C]-0.536[/C][C]0.296255[/C][/ROW]
[ROW][C]11[/C][C]0.027553[/C][C]0.416[/C][C]0.338886[/C][/ROW]
[ROW][C]12[/C][C]-0.250591[/C][C]-3.7838[/C][C]9.9e-05[/C][/ROW]
[ROW][C]13[/C][C]0.015239[/C][C]0.2301[/C][C]0.409106[/C][/ROW]
[ROW][C]14[/C][C]0.114428[/C][C]1.7278[/C][C]0.042687[/C][/ROW]
[ROW][C]15[/C][C]-0.010686[/C][C]-0.1614[/C][C]0.435979[/C][/ROW]
[ROW][C]16[/C][C]-0.062056[/C][C]-0.937[/C][C]0.17487[/C][/ROW]
[ROW][C]17[/C][C]-0.003729[/C][C]-0.0563[/C][C]0.477576[/C][/ROW]
[ROW][C]18[/C][C]0.018261[/C][C]0.2757[/C][C]0.391502[/C][/ROW]
[ROW][C]19[/C][C]0.00165[/C][C]0.0249[/C][C]0.490072[/C][/ROW]
[ROW][C]20[/C][C]0.058971[/C][C]0.8904[/C][C]0.187082[/C][/ROW]
[ROW][C]21[/C][C]0.065587[/C][C]0.9903[/C][C]0.161527[/C][/ROW]
[ROW][C]22[/C][C]0.049403[/C][C]0.746[/C][C]0.228229[/C][/ROW]
[ROW][C]23[/C][C]0.182091[/C][C]2.7495[/C][C]0.003223[/C][/ROW]
[ROW][C]24[/C][C]-0.039391[/C][C]-0.5948[/C][C]0.276287[/C][/ROW]
[ROW][C]25[/C][C]-0.038908[/C][C]-0.5875[/C][C]0.278724[/C][/ROW]
[ROW][C]26[/C][C]-0.02819[/C][C]-0.4257[/C][C]0.335377[/C][/ROW]
[ROW][C]27[/C][C]0.061613[/C][C]0.9303[/C][C]0.176592[/C][/ROW]
[ROW][C]28[/C][C]0.023417[/C][C]0.3536[/C][C]0.361987[/C][/ROW]
[ROW][C]29[/C][C]0.113337[/C][C]1.7114[/C][C]0.044188[/C][/ROW]
[ROW][C]30[/C][C]-0.069541[/C][C]-1.0501[/C][C]0.147403[/C][/ROW]
[ROW][C]31[/C][C]-0.032007[/C][C]-0.4833[/C][C]0.314673[/C][/ROW]
[ROW][C]32[/C][C]0.026319[/C][C]0.3974[/C][C]0.345719[/C][/ROW]
[ROW][C]33[/C][C]-0.095158[/C][C]-1.4369[/C][C]0.076064[/C][/ROW]
[ROW][C]34[/C][C]-0.072476[/C][C]-1.0944[/C][C]0.137475[/C][/ROW]
[ROW][C]35[/C][C]-0.099694[/C][C]-1.5053[/C][C]0.06681[/C][/ROW]
[ROW][C]36[/C][C]-0.038606[/C][C]-0.5829[/C][C]0.280255[/C][/ROW]
[ROW][C]37[/C][C]0.014302[/C][C]0.216[/C][C]0.414606[/C][/ROW]
[ROW][C]38[/C][C]0.023673[/C][C]0.3574[/C][C]0.360544[/C][/ROW]
[ROW][C]39[/C][C]-0.223579[/C][C]-3.376[/C][C]0.000432[/C][/ROW]
[ROW][C]40[/C][C]-0.092164[/C][C]-1.3916[/C][C]0.082693[/C][/ROW]
[ROW][C]41[/C][C]-0.035859[/C][C]-0.5415[/C][C]0.294358[/C][/ROW]
[ROW][C]42[/C][C]-0.042747[/C][C]-0.6455[/C][C]0.259636[/C][/ROW]
[ROW][C]43[/C][C]0.041406[/C][C]0.6252[/C][C]0.266229[/C][/ROW]
[ROW][C]44[/C][C]-0.118945[/C][C]-1.796[/C][C]0.036907[/C][/ROW]
[ROW][C]45[/C][C]-0.068833[/C][C]-1.0394[/C][C]0.14987[/C][/ROW]
[ROW][C]46[/C][C]-0.013071[/C][C]-0.1974[/C][C]0.42186[/C][/ROW]
[ROW][C]47[/C][C]-0.066472[/C][C]-1.0037[/C][C]0.158293[/C][/ROW]
[ROW][C]48[/C][C]-0.064378[/C][C]-0.9721[/C][C]0.16602[/C][/ROW]
[ROW][C]49[/C][C]-0.078068[/C][C]-1.1788[/C][C]0.119854[/C][/ROW]
[ROW][C]50[/C][C]-0.022488[/C][C]-0.3396[/C][C]0.367249[/C][/ROW]
[ROW][C]51[/C][C]0.051825[/C][C]0.7825[/C][C]0.217357[/C][/ROW]
[ROW][C]52[/C][C]0.017917[/C][C]0.2705[/C][C]0.393495[/C][/ROW]
[ROW][C]53[/C][C]-0.185329[/C][C]-2.7984[/C][C]0.002788[/C][/ROW]
[ROW][C]54[/C][C]-0.014888[/C][C]-0.2248[/C][C]0.411168[/C][/ROW]
[ROW][C]55[/C][C]-0.073184[/C][C]-1.105[/C][C]0.135152[/C][/ROW]
[ROW][C]56[/C][C]-0.033903[/C][C]-0.5119[/C][C]0.3046[/C][/ROW]
[ROW][C]57[/C][C]-0.02504[/C][C]-0.3781[/C][C]0.352856[/C][/ROW]
[ROW][C]58[/C][C]-0.022734[/C][C]-0.3433[/C][C]0.365852[/C][/ROW]
[ROW][C]59[/C][C]-0.043211[/C][C]-0.6525[/C][C]0.257375[/C][/ROW]
[ROW][C]60[/C][C]-0.036833[/C][C]-0.5562[/C][C]0.289323[/C][/ROW]
[/TABLE]
Source: https://freestatistics.org/blog/index.php?pk=32123&T=1

Globally Unique Identifier (entire table): ba.freestatistics.org/blog/index.php?pk=32123&T=1

As an alternative you can also use a QR Code:  

The GUIDs for individual cells are displayed in the table below:

Autocorrelation Function
Time lag kACF(k)T-STATP-value
10.0592070.8940.186129
20.0640040.96640.167426
30.1347432.03460.021526
40.1364942.0610.020218
50.112211.69430.045783
60.1032471.5590.060191
70.0520610.78610.216313
80.0695071.04950.147523
90.0650960.98290.163343
10-0.035495-0.5360.296255
110.0275530.4160.338886
12-0.250591-3.78389.9e-05
130.0152390.23010.409106
140.1144281.72780.042687
15-0.010686-0.16140.435979
16-0.062056-0.9370.17487
17-0.003729-0.05630.477576
180.0182610.27570.391502
190.001650.02490.490072
200.0589710.89040.187082
210.0655870.99030.161527
220.0494030.7460.228229
230.1820912.74950.003223
24-0.039391-0.59480.276287
25-0.038908-0.58750.278724
26-0.02819-0.42570.335377
270.0616130.93030.176592
280.0234170.35360.361987
290.1133371.71140.044188
30-0.069541-1.05010.147403
31-0.032007-0.48330.314673
320.0263190.39740.345719
33-0.095158-1.43690.076064
34-0.072476-1.09440.137475
35-0.099694-1.50530.06681
36-0.038606-0.58290.280255
370.0143020.2160.414606
380.0236730.35740.360544
39-0.223579-3.3760.000432
40-0.092164-1.39160.082693
41-0.035859-0.54150.294358
42-0.042747-0.64550.259636
430.0414060.62520.266229
44-0.118945-1.7960.036907
45-0.068833-1.03940.14987
46-0.013071-0.19740.42186
47-0.066472-1.00370.158293
48-0.064378-0.97210.16602
49-0.078068-1.17880.119854
50-0.022488-0.33960.367249
510.0518250.78250.217357
520.0179170.27050.393495
53-0.185329-2.79840.002788
54-0.014888-0.22480.411168
55-0.073184-1.1050.135152
56-0.033903-0.51190.3046
57-0.02504-0.37810.352856
58-0.022734-0.34330.365852
59-0.043211-0.65250.257375
60-0.036833-0.55620.289323


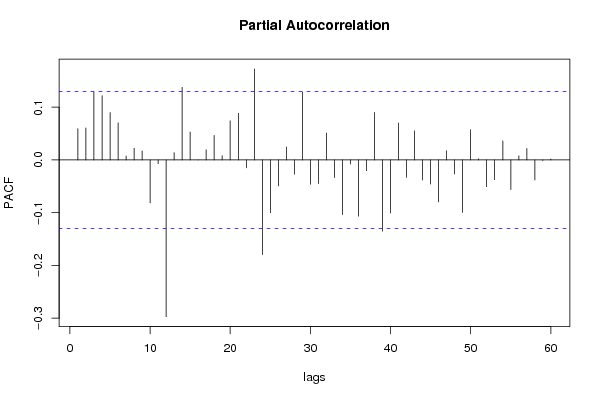
Partial Autocorrelation Function
Time lag kPACF(k)T-STATP-value
10.0592070.8940.186129
20.0607110.91670.18013
30.1285111.94050.026777
40.1218881.84050.0335
50.0898371.35650.088139
60.0702781.06120.144866
70.0072460.10940.456485
80.0222460.33590.368623
90.0170480.25740.398546
10-0.081325-1.2280.110361
11-0.007231-0.10920.456575
12-0.29704-4.48526e-06
130.0138530.20920.417247
140.1376962.07920.01936
150.0527970.79720.213076
16-1.9e-05-3e-040.499887
170.019230.29040.385902
180.0465030.70220.24164
190.0081440.1230.451119
200.074181.12010.131927
210.088571.33740.091217
22-0.014988-0.22630.41058
230.1724522.6040.00491
24-0.179258-2.70670.003655
25-0.100208-1.51310.065819
26-0.049176-0.74250.229262
270.0245560.37080.355571
28-0.027133-0.40970.341207
290.1285931.94170.026702
30-0.046307-0.69920.242562
31-0.044759-0.67580.249913
320.0510320.77060.220881
33-0.033489-0.50570.306787
34-0.103639-1.56490.059495
35-0.007927-0.11970.452413
36-0.106524-1.60850.054557
37-0.020427-0.30840.379012
380.0900191.35930.087703
39-0.13516-2.04090.021208
40-0.100743-1.52120.064799
410.0700761.05810.14556
42-0.033084-0.49960.308933
430.0552930.83490.202324
44-0.037935-0.57280.283672
45-0.04584-0.69220.244768
46-0.079573-1.20150.115398
470.0172470.26040.397386
48-0.026583-0.40140.344251
49-0.099556-1.50330.067078
500.0572670.86470.194053
510.0021420.03230.487114
52-0.050798-0.7670.221927
53-0.037475-0.56590.286024
540.0361240.54550.292983
55-0.056099-0.84710.19892
560.0078710.11890.452749
570.0216540.3270.371996
58-0.03826-0.57770.282016
59-0.001129-0.01710.493204
600.001570.02370.490553

\begin{tabular}{lllllllll}
\hline
Partial Autocorrelation Function \tabularnewline
Time lag k & PACF(k) & T-STAT & P-value \tabularnewline
1 & 0.059207 & 0.894 & 0.186129 \tabularnewline
2 & 0.060711 & 0.9167 & 0.18013 \tabularnewline
3 & 0.128511 & 1.9405 & 0.026777 \tabularnewline
4 & 0.121888 & 1.8405 & 0.0335 \tabularnewline
5 & 0.089837 & 1.3565 & 0.088139 \tabularnewline
6 & 0.070278 & 1.0612 & 0.144866 \tabularnewline
7 & 0.007246 & 0.1094 & 0.456485 \tabularnewline
8 & 0.022246 & 0.3359 & 0.368623 \tabularnewline
9 & 0.017048 & 0.2574 & 0.398546 \tabularnewline
10 & -0.081325 & -1.228 & 0.110361 \tabularnewline
11 & -0.007231 & -0.1092 & 0.456575 \tabularnewline
12 & -0.29704 & -4.4852 & 6e-06 \tabularnewline
13 & 0.013853 & 0.2092 & 0.417247 \tabularnewline
14 & 0.137696 & 2.0792 & 0.01936 \tabularnewline
15 & 0.052797 & 0.7972 & 0.213076 \tabularnewline
16 & -1.9e-05 & -3e-04 & 0.499887 \tabularnewline
17 & 0.01923 & 0.2904 & 0.385902 \tabularnewline
18 & 0.046503 & 0.7022 & 0.24164 \tabularnewline
19 & 0.008144 & 0.123 & 0.451119 \tabularnewline
20 & 0.07418 & 1.1201 & 0.131927 \tabularnewline
21 & 0.08857 & 1.3374 & 0.091217 \tabularnewline
22 & -0.014988 & -0.2263 & 0.41058 \tabularnewline
23 & 0.172452 & 2.604 & 0.00491 \tabularnewline
24 & -0.179258 & -2.7067 & 0.003655 \tabularnewline
25 & -0.100208 & -1.5131 & 0.065819 \tabularnewline
26 & -0.049176 & -0.7425 & 0.229262 \tabularnewline
27 & 0.024556 & 0.3708 & 0.355571 \tabularnewline
28 & -0.027133 & -0.4097 & 0.341207 \tabularnewline
29 & 0.128593 & 1.9417 & 0.026702 \tabularnewline
30 & -0.046307 & -0.6992 & 0.242562 \tabularnewline
31 & -0.044759 & -0.6758 & 0.249913 \tabularnewline
32 & 0.051032 & 0.7706 & 0.220881 \tabularnewline
33 & -0.033489 & -0.5057 & 0.306787 \tabularnewline
34 & -0.103639 & -1.5649 & 0.059495 \tabularnewline
35 & -0.007927 & -0.1197 & 0.452413 \tabularnewline
36 & -0.106524 & -1.6085 & 0.054557 \tabularnewline
37 & -0.020427 & -0.3084 & 0.379012 \tabularnewline
38 & 0.090019 & 1.3593 & 0.087703 \tabularnewline
39 & -0.13516 & -2.0409 & 0.021208 \tabularnewline
40 & -0.100743 & -1.5212 & 0.064799 \tabularnewline
41 & 0.070076 & 1.0581 & 0.14556 \tabularnewline
42 & -0.033084 & -0.4996 & 0.308933 \tabularnewline
43 & 0.055293 & 0.8349 & 0.202324 \tabularnewline
44 & -0.037935 & -0.5728 & 0.283672 \tabularnewline
45 & -0.04584 & -0.6922 & 0.244768 \tabularnewline
46 & -0.079573 & -1.2015 & 0.115398 \tabularnewline
47 & 0.017247 & 0.2604 & 0.397386 \tabularnewline
48 & -0.026583 & -0.4014 & 0.344251 \tabularnewline
49 & -0.099556 & -1.5033 & 0.067078 \tabularnewline
50 & 0.057267 & 0.8647 & 0.194053 \tabularnewline
51 & 0.002142 & 0.0323 & 0.487114 \tabularnewline
52 & -0.050798 & -0.767 & 0.221927 \tabularnewline
53 & -0.037475 & -0.5659 & 0.286024 \tabularnewline
54 & 0.036124 & 0.5455 & 0.292983 \tabularnewline
55 & -0.056099 & -0.8471 & 0.19892 \tabularnewline
56 & 0.007871 & 0.1189 & 0.452749 \tabularnewline
57 & 0.021654 & 0.327 & 0.371996 \tabularnewline
58 & -0.03826 & -0.5777 & 0.282016 \tabularnewline
59 & -0.001129 & -0.0171 & 0.493204 \tabularnewline
60 & 0.00157 & 0.0237 & 0.490553 \tabularnewline
\hline
\end{tabular}
%Source: https://freestatistics.org/blog/index.php?pk=32123&T=2

[TABLE]
[ROW][C]Partial Autocorrelation Function[/C][/ROW]
[ROW][C]Time lag k[/C][C]PACF(k)[/C][C]T-STAT[/C][C]P-value[/C][/ROW]
[ROW][C]1[/C][C]0.059207[/C][C]0.894[/C][C]0.186129[/C][/ROW]
[ROW][C]2[/C][C]0.060711[/C][C]0.9167[/C][C]0.18013[/C][/ROW]
[ROW][C]3[/C][C]0.128511[/C][C]1.9405[/C][C]0.026777[/C][/ROW]
[ROW][C]4[/C][C]0.121888[/C][C]1.8405[/C][C]0.0335[/C][/ROW]
[ROW][C]5[/C][C]0.089837[/C][C]1.3565[/C][C]0.088139[/C][/ROW]
[ROW][C]6[/C][C]0.070278[/C][C]1.0612[/C][C]0.144866[/C][/ROW]
[ROW][C]7[/C][C]0.007246[/C][C]0.1094[/C][C]0.456485[/C][/ROW]
[ROW][C]8[/C][C]0.022246[/C][C]0.3359[/C][C]0.368623[/C][/ROW]
[ROW][C]9[/C][C]0.017048[/C][C]0.2574[/C][C]0.398546[/C][/ROW]
[ROW][C]10[/C][C]-0.081325[/C][C]-1.228[/C][C]0.110361[/C][/ROW]
[ROW][C]11[/C][C]-0.007231[/C][C]-0.1092[/C][C]0.456575[/C][/ROW]
[ROW][C]12[/C][C]-0.29704[/C][C]-4.4852[/C][C]6e-06[/C][/ROW]
[ROW][C]13[/C][C]0.013853[/C][C]0.2092[/C][C]0.417247[/C][/ROW]
[ROW][C]14[/C][C]0.137696[/C][C]2.0792[/C][C]0.01936[/C][/ROW]
[ROW][C]15[/C][C]0.052797[/C][C]0.7972[/C][C]0.213076[/C][/ROW]
[ROW][C]16[/C][C]-1.9e-05[/C][C]-3e-04[/C][C]0.499887[/C][/ROW]
[ROW][C]17[/C][C]0.01923[/C][C]0.2904[/C][C]0.385902[/C][/ROW]
[ROW][C]18[/C][C]0.046503[/C][C]0.7022[/C][C]0.24164[/C][/ROW]
[ROW][C]19[/C][C]0.008144[/C][C]0.123[/C][C]0.451119[/C][/ROW]
[ROW][C]20[/C][C]0.07418[/C][C]1.1201[/C][C]0.131927[/C][/ROW]
[ROW][C]21[/C][C]0.08857[/C][C]1.3374[/C][C]0.091217[/C][/ROW]
[ROW][C]22[/C][C]-0.014988[/C][C]-0.2263[/C][C]0.41058[/C][/ROW]
[ROW][C]23[/C][C]0.172452[/C][C]2.604[/C][C]0.00491[/C][/ROW]
[ROW][C]24[/C][C]-0.179258[/C][C]-2.7067[/C][C]0.003655[/C][/ROW]
[ROW][C]25[/C][C]-0.100208[/C][C]-1.5131[/C][C]0.065819[/C][/ROW]
[ROW][C]26[/C][C]-0.049176[/C][C]-0.7425[/C][C]0.229262[/C][/ROW]
[ROW][C]27[/C][C]0.024556[/C][C]0.3708[/C][C]0.355571[/C][/ROW]
[ROW][C]28[/C][C]-0.027133[/C][C]-0.4097[/C][C]0.341207[/C][/ROW]
[ROW][C]29[/C][C]0.128593[/C][C]1.9417[/C][C]0.026702[/C][/ROW]
[ROW][C]30[/C][C]-0.046307[/C][C]-0.6992[/C][C]0.242562[/C][/ROW]
[ROW][C]31[/C][C]-0.044759[/C][C]-0.6758[/C][C]0.249913[/C][/ROW]
[ROW][C]32[/C][C]0.051032[/C][C]0.7706[/C][C]0.220881[/C][/ROW]
[ROW][C]33[/C][C]-0.033489[/C][C]-0.5057[/C][C]0.306787[/C][/ROW]
[ROW][C]34[/C][C]-0.103639[/C][C]-1.5649[/C][C]0.059495[/C][/ROW]
[ROW][C]35[/C][C]-0.007927[/C][C]-0.1197[/C][C]0.452413[/C][/ROW]
[ROW][C]36[/C][C]-0.106524[/C][C]-1.6085[/C][C]0.054557[/C][/ROW]
[ROW][C]37[/C][C]-0.020427[/C][C]-0.3084[/C][C]0.379012[/C][/ROW]
[ROW][C]38[/C][C]0.090019[/C][C]1.3593[/C][C]0.087703[/C][/ROW]
[ROW][C]39[/C][C]-0.13516[/C][C]-2.0409[/C][C]0.021208[/C][/ROW]
[ROW][C]40[/C][C]-0.100743[/C][C]-1.5212[/C][C]0.064799[/C][/ROW]
[ROW][C]41[/C][C]0.070076[/C][C]1.0581[/C][C]0.14556[/C][/ROW]
[ROW][C]42[/C][C]-0.033084[/C][C]-0.4996[/C][C]0.308933[/C][/ROW]
[ROW][C]43[/C][C]0.055293[/C][C]0.8349[/C][C]0.202324[/C][/ROW]
[ROW][C]44[/C][C]-0.037935[/C][C]-0.5728[/C][C]0.283672[/C][/ROW]
[ROW][C]45[/C][C]-0.04584[/C][C]-0.6922[/C][C]0.244768[/C][/ROW]
[ROW][C]46[/C][C]-0.079573[/C][C]-1.2015[/C][C]0.115398[/C][/ROW]
[ROW][C]47[/C][C]0.017247[/C][C]0.2604[/C][C]0.397386[/C][/ROW]
[ROW][C]48[/C][C]-0.026583[/C][C]-0.4014[/C][C]0.344251[/C][/ROW]
[ROW][C]49[/C][C]-0.099556[/C][C]-1.5033[/C][C]0.067078[/C][/ROW]
[ROW][C]50[/C][C]0.057267[/C][C]0.8647[/C][C]0.194053[/C][/ROW]
[ROW][C]51[/C][C]0.002142[/C][C]0.0323[/C][C]0.487114[/C][/ROW]
[ROW][C]52[/C][C]-0.050798[/C][C]-0.767[/C][C]0.221927[/C][/ROW]
[ROW][C]53[/C][C]-0.037475[/C][C]-0.5659[/C][C]0.286024[/C][/ROW]
[ROW][C]54[/C][C]0.036124[/C][C]0.5455[/C][C]0.292983[/C][/ROW]
[ROW][C]55[/C][C]-0.056099[/C][C]-0.8471[/C][C]0.19892[/C][/ROW]
[ROW][C]56[/C][C]0.007871[/C][C]0.1189[/C][C]0.452749[/C][/ROW]
[ROW][C]57[/C][C]0.021654[/C][C]0.327[/C][C]0.371996[/C][/ROW]
[ROW][C]58[/C][C]-0.03826[/C][C]-0.5777[/C][C]0.282016[/C][/ROW]
[ROW][C]59[/C][C]-0.001129[/C][C]-0.0171[/C][C]0.493204[/C][/ROW]
[ROW][C]60[/C][C]0.00157[/C][C]0.0237[/C][C]0.490553[/C][/ROW]
[/TABLE]
Source: https://freestatistics.org/blog/index.php?pk=32123&T=2

Globally Unique Identifier (entire table): ba.freestatistics.org/blog/index.php?pk=32123&T=2

As an alternative you can also use a QR Code:  

The GUIDs for individual cells are displayed in the table below:

Partial Autocorrelation Function
Time lag kPACF(k)T-STATP-value
10.0592070.8940.186129
20.0607110.91670.18013
30.1285111.94050.026777
40.1218881.84050.0335
50.0898371.35650.088139
60.0702781.06120.144866
70.0072460.10940.456485
80.0222460.33590.368623
90.0170480.25740.398546
10-0.081325-1.2280.110361
11-0.007231-0.10920.456575
12-0.29704-4.48526e-06
130.0138530.20920.417247
140.1376962.07920.01936
150.0527970.79720.213076
16-1.9e-05-3e-040.499887
170.019230.29040.385902
180.0465030.70220.24164
190.0081440.1230.451119
200.074181.12010.131927
210.088571.33740.091217
22-0.014988-0.22630.41058
230.1724522.6040.00491
24-0.179258-2.70670.003655
25-0.100208-1.51310.065819
26-0.049176-0.74250.229262
270.0245560.37080.355571
28-0.027133-0.40970.341207
290.1285931.94170.026702
30-0.046307-0.69920.242562
31-0.044759-0.67580.249913
320.0510320.77060.220881
33-0.033489-0.50570.306787
34-0.103639-1.56490.059495
35-0.007927-0.11970.452413
36-0.106524-1.60850.054557
37-0.020427-0.30840.379012
380.0900191.35930.087703
39-0.13516-2.04090.021208
40-0.100743-1.52120.064799
410.0700761.05810.14556
42-0.033084-0.49960.308933
430.0552930.83490.202324
44-0.037935-0.57280.283672
45-0.04584-0.69220.244768
46-0.079573-1.20150.115398
470.0172470.26040.397386
48-0.026583-0.40140.344251
49-0.099556-1.50330.067078
500.0572670.86470.194053
510.0021420.03230.487114
52-0.050798-0.7670.221927
53-0.037475-0.56590.286024
540.0361240.54550.292983
55-0.056099-0.84710.19892
560.0078710.11890.452749
570.0216540.3270.371996
58-0.03826-0.57770.282016
59-0.001129-0.01710.493204
600.001570.02370.490553


Parameters (Session):
par1 = 60 ; par2 = 1.1 ; par3 = 1 ; par4 = 1 ; par5 = 12 ;
Parameters (R input):
par1 = 60 ; par2 = 1.1 ; par3 = 1 ; par4 = 1 ; par5 = 12 ;
R code (references can be found in the software module):
if (par1 == 'Default') {
par1 = 10*log10(length(x))
} else {
par1 <- as.numeric(par1)
}
par2 <- as.numeric(par2)
par3 <- as.numeric(par3)
par4 <- as.numeric(par4)
par5 <- as.numeric(par5)
if (par2 == 0) {
x <- log(x)
} else {
x <- (x ^ par2 - 1) / par2
}
if (par3 > 0) x <- diff(x,lag=1,difference=par3)
if (par4 > 0) x <- diff(x,lag=par5,difference=par4)
bitmap(file='pic1.png')
racf <- acf(x,par1,main='Autocorrelation',xlab='lags',ylab='ACF')
dev.off()
bitmap(file='pic2.png')
rpacf <- pacf(x,par1,main='Partial Autocorrelation',xlab='lags',ylab='PACF')
dev.off()
(myacf <- c(racf$acf))
(mypacf <- c(rpacf$acf))
lengthx <- length(x)
sqrtn <- sqrt(lengthx)
load(file='createtable')
a<-table.start()
a<-table.row.start(a)
a<-table.element(a,'Autocorrelation Function',4,TRUE)
a<-table.row.end(a)
a<-table.row.start(a)
a<-table.element(a,'Time lag k',header=TRUE)
a<-table.element(a,hyperlink('basics.htm','ACF(k)','click here for more information about the Autocorrelation Function'),header=TRUE)
a<-table.element(a,'T-STAT',header=TRUE)
a<-table.element(a,'P-value',header=TRUE)
a<-table.row.end(a)
for (i in 2:(par1+1)) {
a<-table.row.start(a)
a<-table.element(a,i-1,header=TRUE)
a<-table.element(a,round(myacf[i],6))
mytstat <- myacf[i]*sqrtn
a<-table.element(a,round(mytstat,4))
a<-table.element(a,round(1-pt(abs(mytstat),lengthx),6))
a<-table.row.end(a)
}
a<-table.end(a)
table.save(a,file='mytable.tab')
a<-table.start()
a<-table.row.start(a)
a<-table.element(a,'Partial Autocorrelation Function',4,TRUE)
a<-table.row.end(a)
a<-table.row.start(a)
a<-table.element(a,'Time lag k',header=TRUE)
a<-table.element(a,hyperlink('basics.htm','PACF(k)','click here for more information about the Partial Autocorrelation Function'),header=TRUE)
a<-table.element(a,'T-STAT',header=TRUE)
a<-table.element(a,'P-value',header=TRUE)
a<-table.row.end(a)
for (i in 1:par1) {
a<-table.row.start(a)
a<-table.element(a,i,header=TRUE)
a<-table.element(a,round(mypacf[i],6))
mytstat <- mypacf[i]*sqrtn
a<-table.element(a,round(mytstat,4))
a<-table.element(a,round(1-pt(abs(mytstat),lengthx),6))
a<-table.row.end(a)
}
a<-table.end(a)
table.save(a,file='mytable1.tab')