Free Statistics
of Irreproducible Research!
Description of Statistical Computation | |||||||||||||||||||||
|---|---|---|---|---|---|---|---|---|---|---|---|---|---|---|---|---|---|---|---|---|---|
| Author's title | |||||||||||||||||||||
| Author | *The author of this computation has been verified* | ||||||||||||||||||||
| R Software Module | rwasp_backtobackhist.wasp | ||||||||||||||||||||
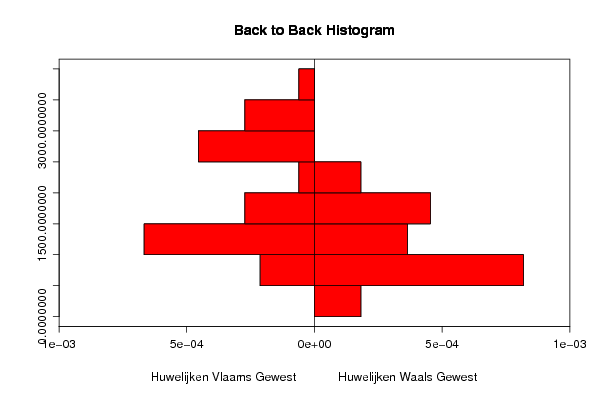
| Title produced by software | Back to Back Histogram | ||||||||||||||||||||
| Date of computation | Wed, 10 Dec 2008 06:53:09 -0700 | ||||||||||||||||||||
| Cite this page as follows | Statistical Computations at FreeStatistics.org, Office for Research Development and Education, URL https://freestatistics.org/blog/index.php?v=date/2008/Dec/10/t1228917360zzvw4zhpjmelkb8.htm/, Retrieved Fri, 17 May 2024 01:42:02 +0000 | ||||||||||||||||||||
| Statistical Computations at FreeStatistics.org, Office for Research Development and Education, URL https://freestatistics.org/blog/index.php?pk=31957, Retrieved Fri, 17 May 2024 01:42:02 +0000 | |||||||||||||||||||||
| QR Codes: | |||||||||||||||||||||
|
| |||||||||||||||||||||
| Original text written by user: | |||||||||||||||||||||
| IsPrivate? | No (this computation is public) | ||||||||||||||||||||
| User-defined keywords | |||||||||||||||||||||
| Estimated Impact | 154 | ||||||||||||||||||||
Tree of Dependent Computations | |||||||||||||||||||||
| Family? (F = Feedback message, R = changed R code, M = changed R Module, P = changed Parameters, D = changed Data) | |||||||||||||||||||||
| - [Back to Back Histogram] [B2B Histogram] [2008-12-10 13:53:09] [5f3e73ccf1ddc75508eed47fa51813d3] [Current] | |||||||||||||||||||||
| Feedback Forum | |||||||||||||||||||||
Post a new message | |||||||||||||||||||||
Dataset | |||||||||||||||||||||
| Dataseries X: | |||||||||||||||||||||
632 1270 1211 1469 2570 2765 2487 3644 2501 1629 987 1100 690 1378 1376 1736 2800 2671 2508 3590 2691 1629 1020 1224 787 1424 1232 2021 2782 2682 3284 3194 2736 1701 1089 1240 799 1163 1180 1960 2914 2658 3254 3222 2987 1604 1032 1283 774 1109 1453 1849 2800 3310 3060 3422 3448 1670 1022 1391 767 1172 1498 1623 2646 3439 | |||||||||||||||||||||
| Dataseries Y: | |||||||||||||||||||||
357 600 667 839 1295 1956 1584 2243 1582 954 645 655 405 554 702 869 1364 1716 1625 2114 1556 1012 596 677 470 679 629 1068 1377 1660 1930 1828 1687 1008 591 669 475 593 641 1087 1238 1609 2016 1953 1771 1045 675 716 437 553 659 1169 1343 1649 2016 1909 2085 976 595 797 456 630 755 885 1309 2016 | |||||||||||||||||||||
Tables (Output of Computation) | |||||||||||||||||||||
| |||||||||||||||||||||
Figures (Output of Computation) | |||||||||||||||||||||
Input Parameters & R Code | |||||||||||||||||||||
| Parameters (Session): | |||||||||||||||||||||
| par1 = red ; par2 = red ; par3 = TRUE ; par4 = Huwelijken Vlaams Gewest ; par5 = Huwelijken Waals Gewest ; | |||||||||||||||||||||
| Parameters (R input): | |||||||||||||||||||||
| par1 = red ; par2 = red ; par3 = TRUE ; par4 = Huwelijken Vlaams Gewest ; par5 = Huwelijken Waals Gewest ; | |||||||||||||||||||||
| R code (references can be found in the software module): | |||||||||||||||||||||
if (par3 == 'TRUE') par3 <- TRUE | |||||||||||||||||||||