Free Statistics

of Irreproducible Research!

Author's title

Author*The author of this computation has been verified*
R Software Modulerwasp_arimaforecasting.wasp
Title produced by softwareARIMA Forecasting
Date of computationWed, 10 Dec 2008 06:13:40 -0700
Cite this page as followsStatistical Computations at FreeStatistics.org, Office for Research Development and Education, URL https://freestatistics.org/blog/index.php?v=date/2008/Dec/10/t1228914868yl5k5pan40yn7w8.htm/, Retrieved Fri, 17 May 2024 02:40:28 +0000
Statistical Computations at FreeStatistics.org, Office for Research Development and Education, URL https://freestatistics.org/blog/index.php?pk=31941, Retrieved Fri, 17 May 2024 02:40:28 +0000
QR Codes:

Original text written by user:
IsPrivate?No (this computation is public)
User-defined keywords
Estimated Impact229
Family? (F = Feedback message, R = changed R code, M = changed R Module, P = changed Parameters, D = changed Data)
F     [Harrell-Davis Quantiles] [Q7 95% confidence...] [2007-10-20 15:02:46] [b731da8b544846036771bbf9bf2f34ce]
- RMPD  [Univariate Data Series] [Tijdreeks 2] [2008-10-27 17:40:40] [2d4aec5ed1856c4828162be37be304d9]
F RMPD      [ARIMA Forecasting] [Tijdreeks 2 Arima...] [2008-12-10 13:13:40] [d7f41258beeebb8716e3f5d39f3cdc01] [Current]
Feedback Forum
2008-12-22 19:18:52 [Jan Van Riet] [reply
Je trekt een juiste conclusie ivm de cijfers in de tabellen.
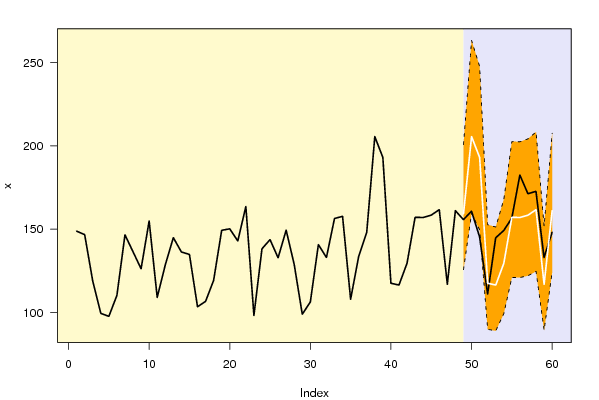
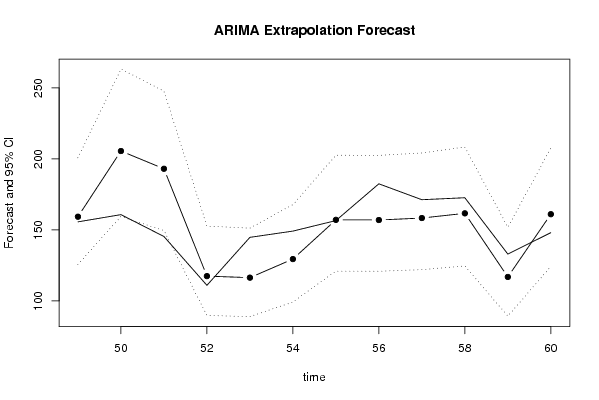
Het vermelden waard is ook dat als je naar de grafiek kijkt, je een vrij grote spreiding ziet van het betrouwbaarheidsinterval. Dit valt ook op als je naar de cijfers in de tabel kijkt (het verschil left bound-upper bound is vaak groot).
Dit wijst erop dat deze tijdreeks moeilijk te voorspellen is.
2008-12-22 19:22:08 [Jan Van Riet] [reply
step 2:

Er is geen trend, noch is er seizonaliteit waar te nemen.
Een business cycle zou nog kunnen, aangezien de tijdreeks continu op en neer gaat (zoals een sinusfunctie).
2008-12-22 19:30:15 [Jan Van Riet] [reply
Uit de waarden van PE (lage waarden)lees ik af dat als er verschillen zijn tussen de werkelijke waarden van de tijdreeks en de voorspelde waarden, dat die significant zijn en dus niet toe te schrijven aan het toeval.
2008-12-22 19:35:06 [Jan Van Riet] [reply
step 4:

Uit de kolom P(F[t]>Y[t-s]) met onderaan vooral waarden 0,5 leid ik af dat deze tijdreeks toch vrij onvoorspelbaar is op de langere termijn.
Verder is de kans op dalen groter dan op stijgen in de toekomst (zie kolom hier links naast).
Je conclusie ivm de onderliggende assumptie klopt wel.

Post a new message
Dataseries X:
148.8
146.7
118.8
99.4
97.6
110.2
146.6
136.4
126.2
154.9
109
128.5
144.9
136.3
134.8
103.4
106.6
119.2
149.3
150.2
142.9
163.6
98.2
138.2
143.7
132.8
149.4
128.8
98.9
106.2
140.7
133
156.4
157.7
107.9
133.6
148.1
205.6
193.1
117.5
116.4
129.5
157.1
157
158.4
161.7
116.9
161.1
155.7
160.8
145.4
111
144.8
149.2
156.6
182.5
171.3
172.7
133
148.1


Summary of computational transaction
Raw Inputview raw input (R code)
Raw Outputview raw output of R engine
Computing time3 seconds
R Server'Herman Ole Andreas Wold' @ 193.190.124.10:1001

\begin{tabular}{lllllllll}
\hline
Summary of computational transaction \tabularnewline
Raw Input & view raw input (R code)  \tabularnewline
Raw Output & view raw output of R engine  \tabularnewline
Computing time & 3 seconds \tabularnewline
R Server & 'Herman Ole Andreas Wold' @ 193.190.124.10:1001 \tabularnewline
\hline
\end{tabular}
%Source: https://freestatistics.org/blog/index.php?pk=31941&T=0

[TABLE]
[ROW][C]Summary of computational transaction[/C][/ROW]
[ROW][C]Raw Input[/C][C]view raw input (R code) [/C][/ROW]
[ROW][C]Raw Output[/C][C]view raw output of R engine [/C][/ROW]
[ROW][C]Computing time[/C][C]3 seconds[/C][/ROW]
[ROW][C]R Server[/C][C]'Herman Ole Andreas Wold' @ 193.190.124.10:1001[/C][/ROW]
[/TABLE]
Source: https://freestatistics.org/blog/index.php?pk=31941&T=0

Globally Unique Identifier (entire table): ba.freestatistics.org/blog/index.php?pk=31941&T=0

As an alternative you can also use a QR Code:  

The GUIDs for individual cells are displayed in the table below:

Summary of computational transaction
Raw Inputview raw input (R code)
Raw Outputview raw output of R engine
Computing time3 seconds
R Server'Herman Ole Andreas Wold' @ 193.190.124.10:1001


Univariate ARIMA Extrapolation Forecast
timeY[t]F[t]95% LB95% UBp-value(H0: Y[t] = F[t])P(F[t]>Y[t-1])P(F[t]>Y[t-s])P(F[t]>Y[48])
36133.6-------
37148.1-------
38205.6-------
39193.1-------
40117.5-------
41116.400000000000-------
42129.5-------
43157.1-------
44157-------
45158.4-------
46161.7-------
47116.9-------
48161.1-------
49155.7159.3384125.7145200.85020.43180.46690.70220.4669
50160.8205.6159.4736263.40480.06440.95470.50.9343
51145.4193.1149.5356247.77160.04360.87660.50.8744
52111117.589.7983152.66860.35860.060.50.0076
53144.8116.488.9349151.27620.05520.61920.50.006
54149.2129.599.2305167.840.15690.21710.50.0531
55156.6157.1121.0022202.61610.49140.63310.50.4316
56182.5157120.9232202.49040.1360.50690.50.4299
57171.3158.4122.0301204.25050.29070.15150.50.4541
58172.7161.7124.6402208.39790.32220.34350.50.51
59133116.989.3273151.90920.18379e-040.50.0067
60148.1161.1124.1656207.6440.2920.88170.50.5

\begin{tabular}{lllllllll}
\hline
Univariate ARIMA Extrapolation Forecast \tabularnewline
time & Y[t] & F[t] & 95% LB & 95% UB & p-value(H0: Y[t] = F[t]) & P(F[t]>Y[t-1]) & P(F[t]>Y[t-s]) & P(F[t]>Y[48]) \tabularnewline
36 & 133.6 & - & - & - & - & - & - & - \tabularnewline
37 & 148.1 & - & - & - & - & - & - & - \tabularnewline
38 & 205.6 & - & - & - & - & - & - & - \tabularnewline
39 & 193.1 & - & - & - & - & - & - & - \tabularnewline
40 & 117.5 & - & - & - & - & - & - & - \tabularnewline
41 & 116.400000000000 & - & - & - & - & - & - & - \tabularnewline
42 & 129.5 & - & - & - & - & - & - & - \tabularnewline
43 & 157.1 & - & - & - & - & - & - & - \tabularnewline
44 & 157 & - & - & - & - & - & - & - \tabularnewline
45 & 158.4 & - & - & - & - & - & - & - \tabularnewline
46 & 161.7 & - & - & - & - & - & - & - \tabularnewline
47 & 116.9 & - & - & - & - & - & - & - \tabularnewline
48 & 161.1 & - & - & - & - & - & - & - \tabularnewline
49 & 155.7 & 159.3384 & 125.7145 & 200.8502 & 0.4318 & 0.4669 & 0.7022 & 0.4669 \tabularnewline
50 & 160.8 & 205.6 & 159.4736 & 263.4048 & 0.0644 & 0.9547 & 0.5 & 0.9343 \tabularnewline
51 & 145.4 & 193.1 & 149.5356 & 247.7716 & 0.0436 & 0.8766 & 0.5 & 0.8744 \tabularnewline
52 & 111 & 117.5 & 89.7983 & 152.6686 & 0.3586 & 0.06 & 0.5 & 0.0076 \tabularnewline
53 & 144.8 & 116.4 & 88.9349 & 151.2762 & 0.0552 & 0.6192 & 0.5 & 0.006 \tabularnewline
54 & 149.2 & 129.5 & 99.2305 & 167.84 & 0.1569 & 0.2171 & 0.5 & 0.0531 \tabularnewline
55 & 156.6 & 157.1 & 121.0022 & 202.6161 & 0.4914 & 0.6331 & 0.5 & 0.4316 \tabularnewline
56 & 182.5 & 157 & 120.9232 & 202.4904 & 0.136 & 0.5069 & 0.5 & 0.4299 \tabularnewline
57 & 171.3 & 158.4 & 122.0301 & 204.2505 & 0.2907 & 0.1515 & 0.5 & 0.4541 \tabularnewline
58 & 172.7 & 161.7 & 124.6402 & 208.3979 & 0.3222 & 0.3435 & 0.5 & 0.51 \tabularnewline
59 & 133 & 116.9 & 89.3273 & 151.9092 & 0.1837 & 9e-04 & 0.5 & 0.0067 \tabularnewline
60 & 148.1 & 161.1 & 124.1656 & 207.644 & 0.292 & 0.8817 & 0.5 & 0.5 \tabularnewline
\hline
\end{tabular}
%Source: https://freestatistics.org/blog/index.php?pk=31941&T=1

[TABLE]
[ROW][C]Univariate ARIMA Extrapolation Forecast[/C][/ROW]
[ROW][C]time[/C][C]Y[t][/C][C]F[t][/C][C]95% LB[/C][C]95% UB[/C][C]p-value(H0: Y[t] = F[t])[/C][C]P(F[t]>Y[t-1])[/C][C]P(F[t]>Y[t-s])[/C][C]P(F[t]>Y[48])[/C][/ROW]
[ROW][C]36[/C][C]133.6[/C][C]-[/C][C]-[/C][C]-[/C][C]-[/C][C]-[/C][C]-[/C][C]-[/C][/ROW]
[ROW][C]37[/C][C]148.1[/C][C]-[/C][C]-[/C][C]-[/C][C]-[/C][C]-[/C][C]-[/C][C]-[/C][/ROW]
[ROW][C]38[/C][C]205.6[/C][C]-[/C][C]-[/C][C]-[/C][C]-[/C][C]-[/C][C]-[/C][C]-[/C][/ROW]
[ROW][C]39[/C][C]193.1[/C][C]-[/C][C]-[/C][C]-[/C][C]-[/C][C]-[/C][C]-[/C][C]-[/C][/ROW]
[ROW][C]40[/C][C]117.5[/C][C]-[/C][C]-[/C][C]-[/C][C]-[/C][C]-[/C][C]-[/C][C]-[/C][/ROW]
[ROW][C]41[/C][C]116.400000000000[/C][C]-[/C][C]-[/C][C]-[/C][C]-[/C][C]-[/C][C]-[/C][C]-[/C][/ROW]
[ROW][C]42[/C][C]129.5[/C][C]-[/C][C]-[/C][C]-[/C][C]-[/C][C]-[/C][C]-[/C][C]-[/C][/ROW]
[ROW][C]43[/C][C]157.1[/C][C]-[/C][C]-[/C][C]-[/C][C]-[/C][C]-[/C][C]-[/C][C]-[/C][/ROW]
[ROW][C]44[/C][C]157[/C][C]-[/C][C]-[/C][C]-[/C][C]-[/C][C]-[/C][C]-[/C][C]-[/C][/ROW]
[ROW][C]45[/C][C]158.4[/C][C]-[/C][C]-[/C][C]-[/C][C]-[/C][C]-[/C][C]-[/C][C]-[/C][/ROW]
[ROW][C]46[/C][C]161.7[/C][C]-[/C][C]-[/C][C]-[/C][C]-[/C][C]-[/C][C]-[/C][C]-[/C][/ROW]
[ROW][C]47[/C][C]116.9[/C][C]-[/C][C]-[/C][C]-[/C][C]-[/C][C]-[/C][C]-[/C][C]-[/C][/ROW]
[ROW][C]48[/C][C]161.1[/C][C]-[/C][C]-[/C][C]-[/C][C]-[/C][C]-[/C][C]-[/C][C]-[/C][/ROW]
[ROW][C]49[/C][C]155.7[/C][C]159.3384[/C][C]125.7145[/C][C]200.8502[/C][C]0.4318[/C][C]0.4669[/C][C]0.7022[/C][C]0.4669[/C][/ROW]
[ROW][C]50[/C][C]160.8[/C][C]205.6[/C][C]159.4736[/C][C]263.4048[/C][C]0.0644[/C][C]0.9547[/C][C]0.5[/C][C]0.9343[/C][/ROW]
[ROW][C]51[/C][C]145.4[/C][C]193.1[/C][C]149.5356[/C][C]247.7716[/C][C]0.0436[/C][C]0.8766[/C][C]0.5[/C][C]0.8744[/C][/ROW]
[ROW][C]52[/C][C]111[/C][C]117.5[/C][C]89.7983[/C][C]152.6686[/C][C]0.3586[/C][C]0.06[/C][C]0.5[/C][C]0.0076[/C][/ROW]
[ROW][C]53[/C][C]144.8[/C][C]116.4[/C][C]88.9349[/C][C]151.2762[/C][C]0.0552[/C][C]0.6192[/C][C]0.5[/C][C]0.006[/C][/ROW]
[ROW][C]54[/C][C]149.2[/C][C]129.5[/C][C]99.2305[/C][C]167.84[/C][C]0.1569[/C][C]0.2171[/C][C]0.5[/C][C]0.0531[/C][/ROW]
[ROW][C]55[/C][C]156.6[/C][C]157.1[/C][C]121.0022[/C][C]202.6161[/C][C]0.4914[/C][C]0.6331[/C][C]0.5[/C][C]0.4316[/C][/ROW]
[ROW][C]56[/C][C]182.5[/C][C]157[/C][C]120.9232[/C][C]202.4904[/C][C]0.136[/C][C]0.5069[/C][C]0.5[/C][C]0.4299[/C][/ROW]
[ROW][C]57[/C][C]171.3[/C][C]158.4[/C][C]122.0301[/C][C]204.2505[/C][C]0.2907[/C][C]0.1515[/C][C]0.5[/C][C]0.4541[/C][/ROW]
[ROW][C]58[/C][C]172.7[/C][C]161.7[/C][C]124.6402[/C][C]208.3979[/C][C]0.3222[/C][C]0.3435[/C][C]0.5[/C][C]0.51[/C][/ROW]
[ROW][C]59[/C][C]133[/C][C]116.9[/C][C]89.3273[/C][C]151.9092[/C][C]0.1837[/C][C]9e-04[/C][C]0.5[/C][C]0.0067[/C][/ROW]
[ROW][C]60[/C][C]148.1[/C][C]161.1[/C][C]124.1656[/C][C]207.644[/C][C]0.292[/C][C]0.8817[/C][C]0.5[/C][C]0.5[/C][/ROW]
[/TABLE]
Source: https://freestatistics.org/blog/index.php?pk=31941&T=1

Globally Unique Identifier (entire table): ba.freestatistics.org/blog/index.php?pk=31941&T=1

As an alternative you can also use a QR Code:  

The GUIDs for individual cells are displayed in the table below:

Univariate ARIMA Extrapolation Forecast
timeY[t]F[t]95% LB95% UBp-value(H0: Y[t] = F[t])P(F[t]>Y[t-1])P(F[t]>Y[t-s])P(F[t]>Y[48])
36133.6-------
37148.1-------
38205.6-------
39193.1-------
40117.5-------
41116.400000000000-------
42129.5-------
43157.1-------
44157-------
45158.4-------
46161.7-------
47116.9-------
48161.1-------
49155.7159.3384125.7145200.85020.43180.46690.70220.4669
50160.8205.6159.4736263.40480.06440.95470.50.9343
51145.4193.1149.5356247.77160.04360.87660.50.8744
52111117.589.7983152.66860.35860.060.50.0076
53144.8116.488.9349151.27620.05520.61920.50.006
54149.2129.599.2305167.840.15690.21710.50.0531
55156.6157.1121.0022202.61610.49140.63310.50.4316
56182.5157120.9232202.49040.1360.50690.50.4299
57171.3158.4122.0301204.25050.29070.15150.50.4541
58172.7161.7124.6402208.39790.32220.34350.50.51
59133116.989.3273151.90920.18379e-040.50.0067
60148.1161.1124.1656207.6440.2920.88170.50.5


Univariate ARIMA Extrapolation Forecast Performance
time% S.E.PEMAPESq.EMSERMSE
490.1329-0.02280.001913.2381.10321.0503
500.1434-0.21790.01822007.04167.253312.9326
510.1445-0.2470.02062275.29189.607513.7698
520.1527-0.05530.004642.253.52081.8764
530.15290.2440.0203806.5667.21338.1984
540.15110.15210.0127388.0932.34085.6869
550.1478-0.00323e-040.250.02080.1443
560.14780.16240.0135650.2554.18757.3612
570.14770.08140.0068166.4113.86753.7239
580.14730.0680.005712110.08333.1754
590.15280.13770.0115259.2121.60084.6477
600.1474-0.08070.006716914.08333.7528

\begin{tabular}{lllllllll}
\hline
Univariate ARIMA Extrapolation Forecast Performance \tabularnewline
time & % S.E. & PE & MAPE & Sq.E & MSE & RMSE \tabularnewline
49 & 0.1329 & -0.0228 & 0.0019 & 13.238 & 1.1032 & 1.0503 \tabularnewline
50 & 0.1434 & -0.2179 & 0.0182 & 2007.04 & 167.2533 & 12.9326 \tabularnewline
51 & 0.1445 & -0.247 & 0.0206 & 2275.29 & 189.6075 & 13.7698 \tabularnewline
52 & 0.1527 & -0.0553 & 0.0046 & 42.25 & 3.5208 & 1.8764 \tabularnewline
53 & 0.1529 & 0.244 & 0.0203 & 806.56 & 67.2133 & 8.1984 \tabularnewline
54 & 0.1511 & 0.1521 & 0.0127 & 388.09 & 32.3408 & 5.6869 \tabularnewline
55 & 0.1478 & -0.0032 & 3e-04 & 0.25 & 0.0208 & 0.1443 \tabularnewline
56 & 0.1478 & 0.1624 & 0.0135 & 650.25 & 54.1875 & 7.3612 \tabularnewline
57 & 0.1477 & 0.0814 & 0.0068 & 166.41 & 13.8675 & 3.7239 \tabularnewline
58 & 0.1473 & 0.068 & 0.0057 & 121 & 10.0833 & 3.1754 \tabularnewline
59 & 0.1528 & 0.1377 & 0.0115 & 259.21 & 21.6008 & 4.6477 \tabularnewline
60 & 0.1474 & -0.0807 & 0.0067 & 169 & 14.0833 & 3.7528 \tabularnewline
\hline
\end{tabular}
%Source: https://freestatistics.org/blog/index.php?pk=31941&T=2

[TABLE]
[ROW][C]Univariate ARIMA Extrapolation Forecast Performance[/C][/ROW]
[ROW][C]time[/C][C]% S.E.[/C][C]PE[/C][C]MAPE[/C][C]Sq.E[/C][C]MSE[/C][C]RMSE[/C][/ROW]
[ROW][C]49[/C][C]0.1329[/C][C]-0.0228[/C][C]0.0019[/C][C]13.238[/C][C]1.1032[/C][C]1.0503[/C][/ROW]
[ROW][C]50[/C][C]0.1434[/C][C]-0.2179[/C][C]0.0182[/C][C]2007.04[/C][C]167.2533[/C][C]12.9326[/C][/ROW]
[ROW][C]51[/C][C]0.1445[/C][C]-0.247[/C][C]0.0206[/C][C]2275.29[/C][C]189.6075[/C][C]13.7698[/C][/ROW]
[ROW][C]52[/C][C]0.1527[/C][C]-0.0553[/C][C]0.0046[/C][C]42.25[/C][C]3.5208[/C][C]1.8764[/C][/ROW]
[ROW][C]53[/C][C]0.1529[/C][C]0.244[/C][C]0.0203[/C][C]806.56[/C][C]67.2133[/C][C]8.1984[/C][/ROW]
[ROW][C]54[/C][C]0.1511[/C][C]0.1521[/C][C]0.0127[/C][C]388.09[/C][C]32.3408[/C][C]5.6869[/C][/ROW]
[ROW][C]55[/C][C]0.1478[/C][C]-0.0032[/C][C]3e-04[/C][C]0.25[/C][C]0.0208[/C][C]0.1443[/C][/ROW]
[ROW][C]56[/C][C]0.1478[/C][C]0.1624[/C][C]0.0135[/C][C]650.25[/C][C]54.1875[/C][C]7.3612[/C][/ROW]
[ROW][C]57[/C][C]0.1477[/C][C]0.0814[/C][C]0.0068[/C][C]166.41[/C][C]13.8675[/C][C]3.7239[/C][/ROW]
[ROW][C]58[/C][C]0.1473[/C][C]0.068[/C][C]0.0057[/C][C]121[/C][C]10.0833[/C][C]3.1754[/C][/ROW]
[ROW][C]59[/C][C]0.1528[/C][C]0.1377[/C][C]0.0115[/C][C]259.21[/C][C]21.6008[/C][C]4.6477[/C][/ROW]
[ROW][C]60[/C][C]0.1474[/C][C]-0.0807[/C][C]0.0067[/C][C]169[/C][C]14.0833[/C][C]3.7528[/C][/ROW]
[/TABLE]
Source: https://freestatistics.org/blog/index.php?pk=31941&T=2

Globally Unique Identifier (entire table): ba.freestatistics.org/blog/index.php?pk=31941&T=2

As an alternative you can also use a QR Code:  

The GUIDs for individual cells are displayed in the table below:

Univariate ARIMA Extrapolation Forecast Performance
time% S.E.PEMAPESq.EMSERMSE
490.1329-0.02280.001913.2381.10321.0503
500.1434-0.21790.01822007.04167.253312.9326
510.1445-0.2470.02062275.29189.607513.7698
520.1527-0.05530.004642.253.52081.8764
530.15290.2440.0203806.5667.21338.1984
540.15110.15210.0127388.0932.34085.6869
550.1478-0.00323e-040.250.02080.1443
560.14780.16240.0135650.2554.18757.3612
570.14770.08140.0068166.4113.86753.7239
580.14730.0680.005712110.08333.1754
590.15280.13770.0115259.2121.60084.6477
600.1474-0.08070.006716914.08333.7528


Parameters (Session):
par1 = 12 ; par2 = 0.1 ; par3 = 0 ; par4 = 1 ; par5 = 12 ; par6 = 0 ; par7 = 1 ; par8 = 0 ; par9 = 0 ; par10 = FALSE ;
Parameters (R input):
par1 = 12 ; par2 = 0.1 ; par3 = 0 ; par4 = 1 ; par5 = 12 ; par6 = 0 ; par7 = 1 ; par8 = 0 ; par9 = 0 ; par10 = FALSE ;
R code (references can be found in the software module):
par1 <- as.numeric(par1) #cut off periods
par2 <- as.numeric(par2) #lambda
par3 <- as.numeric(par3) #degree of non-seasonal differencing
par4 <- as.numeric(par4) #degree of seasonal differencing
par5 <- as.numeric(par5) #seasonal period
par6 <- as.numeric(par6) #p
par7 <- as.numeric(par7) #q
par8 <- as.numeric(par8) #P
par9 <- as.numeric(par9) #Q
if (par10 == 'TRUE') par10 <- TRUE
if (par10 == 'FALSE') par10 <- FALSE
if (par2 == 0) x <- log(x)
if (par2 != 0) x <- x^par2
lx <- length(x)
first <- lx - 2*par1
nx <- lx - par1
nx1 <- nx + 1
fx <- lx - nx
if (fx < 1) {
fx <- par5
nx1 <- lx + fx - 1
first <- lx - 2*fx
}
first <- 1
if (fx < 3) fx <- round(lx/10,0)
(arima.out <- arima(x[1:nx], order=c(par6,par3,par7), seasonal=list(order=c(par8,par4,par9), period=par5), include.mean=par10, method='ML'))
(forecast <- predict(arima.out,fx))
(lb <- forecast$pred - 1.96 * forecast$se)
(ub <- forecast$pred + 1.96 * forecast$se)
if (par2 == 0) {
x <- exp(x)
forecast$pred <- exp(forecast$pred)
lb <- exp(lb)
ub <- exp(ub)
}
if (par2 != 0) {
x <- x^(1/par2)
forecast$pred <- forecast$pred^(1/par2)
lb <- lb^(1/par2)
ub <- ub^(1/par2)
}
if (par2 < 0) {
olb <- lb
lb <- ub
ub <- olb
}
(actandfor <- c(x[1:nx], forecast$pred))
(perc.se <- (ub-forecast$pred)/1.96/forecast$pred)
bitmap(file='test1.png')
opar <- par(mar=c(4,4,2,2),las=1)
ylim <- c( min(x[first:nx],lb), max(x[first:nx],ub))
plot(x,ylim=ylim,type='n',xlim=c(first,lx))
usr <- par('usr')
rect(usr[1],usr[3],nx+1,usr[4],border=NA,col='lemonchiffon')
rect(nx1,usr[3],usr[2],usr[4],border=NA,col='lavender')
abline(h= (-3:3)*2 , col ='gray', lty =3)
polygon( c(nx1:lx,lx:nx1), c(lb,rev(ub)), col = 'orange', lty=2,border=NA)
lines(nx1:lx, lb , lty=2)
lines(nx1:lx, ub , lty=2)
lines(x, lwd=2)
lines(nx1:lx, forecast$pred , lwd=2 , col ='white')
box()
par(opar)
dev.off()
prob.dec <- array(NA, dim=fx)
prob.sdec <- array(NA, dim=fx)
prob.ldec <- array(NA, dim=fx)
prob.pval <- array(NA, dim=fx)
perf.pe <- array(0, dim=fx)
perf.mape <- array(0, dim=fx)
perf.se <- array(0, dim=fx)
perf.mse <- array(0, dim=fx)
perf.rmse <- array(0, dim=fx)
for (i in 1:fx) {
locSD <- (ub[i] - forecast$pred[i]) / 1.96
perf.pe[i] = (x[nx+i] - forecast$pred[i]) / forecast$pred[i]
perf.mape[i] = perf.mape[i] + abs(perf.pe[i])
perf.se[i] = (x[nx+i] - forecast$pred[i])^2
perf.mse[i] = perf.mse[i] + perf.se[i]
prob.dec[i] = pnorm((x[nx+i-1] - forecast$pred[i]) / locSD)
prob.sdec[i] = pnorm((x[nx+i-par5] - forecast$pred[i]) / locSD)
prob.ldec[i] = pnorm((x[nx] - forecast$pred[i]) / locSD)
prob.pval[i] = pnorm(abs(x[nx+i] - forecast$pred[i]) / locSD)
}
perf.mape = perf.mape / fx
perf.mse = perf.mse / fx
perf.rmse = sqrt(perf.mse)
bitmap(file='test2.png')
plot(forecast$pred, pch=19, type='b',main='ARIMA Extrapolation Forecast', ylab='Forecast and 95% CI', xlab='time',ylim=c(min(lb),max(ub)))
dum <- forecast$pred
dum[1:12] <- x[(nx+1):lx]
lines(dum, lty=1)
lines(ub,lty=3)
lines(lb,lty=3)
dev.off()
load(file='createtable')
a<-table.start()
a<-table.row.start(a)
a<-table.element(a,'Univariate ARIMA Extrapolation Forecast',9,TRUE)
a<-table.row.end(a)
a<-table.row.start(a)
a<-table.element(a,'time',1,header=TRUE)
a<-table.element(a,'Y[t]',1,header=TRUE)
a<-table.element(a,'F[t]',1,header=TRUE)
a<-table.element(a,'95% LB',1,header=TRUE)
a<-table.element(a,'95% UB',1,header=TRUE)
a<-table.element(a,'p-value
(H0: Y[t] = F[t])',1,header=TRUE)
a<-table.element(a,'P(F[t]>Y[t-1])',1,header=TRUE)
a<-table.element(a,'P(F[t]>Y[t-s])',1,header=TRUE)
mylab <- paste('P(F[t]>Y[',nx,sep='')
mylab <- paste(mylab,'])',sep='')
a<-table.element(a,mylab,1,header=TRUE)
a<-table.row.end(a)
for (i in (nx-par5):nx) {
a<-table.row.start(a)
a<-table.element(a,i,header=TRUE)
a<-table.element(a,x[i])
a<-table.element(a,'-')
a<-table.row.end(a)
}
for (i in 1:fx) {
a<-table.row.start(a)
a<-table.element(a,nx+i,header=TRUE)
a<-table.element(a,round(x[nx+i],4))
a<-table.element(a,round(forecast$pred[i],4))
a<-table.element(a,round(lb[i],4))
a<-table.element(a,round(ub[i],4))
a<-table.element(a,round((1-prob.pval[i]),4))
a<-table.element(a,round((1-prob.dec[i]),4))
a<-table.element(a,round((1-prob.sdec[i]),4))
a<-table.element(a,round((1-prob.ldec[i]),4))
a<-table.row.end(a)
}
a<-table.end(a)
table.save(a,file='mytable.tab')
a<-table.start()
a<-table.row.start(a)
a<-table.element(a,'Univariate ARIMA Extrapolation Forecast Performance',7,TRUE)
a<-table.row.end(a)
a<-table.row.start(a)
a<-table.element(a,'time',1,header=TRUE)
a<-table.element(a,'% S.E.',1,header=TRUE)
a<-table.element(a,'PE',1,header=TRUE)
a<-table.element(a,'MAPE',1,header=TRUE)
a<-table.element(a,'Sq.E',1,header=TRUE)
a<-table.element(a,'MSE',1,header=TRUE)
a<-table.element(a,'RMSE',1,header=TRUE)
a<-table.row.end(a)
for (i in 1:fx) {
a<-table.row.start(a)
a<-table.element(a,nx+i,header=TRUE)
a<-table.element(a,round(perc.se[i],4))
a<-table.element(a,round(perf.pe[i],4))
a<-table.element(a,round(perf.mape[i],4))
a<-table.element(a,round(perf.se[i],4))
a<-table.element(a,round(perf.mse[i],4))
a<-table.element(a,round(perf.rmse[i],4))
a<-table.row.end(a)
}
a<-table.end(a)
table.save(a,file='mytable1.tab')