Free Statistics

of Irreproducible Research!

Author's title

Author*The author of this computation has been verified*
R Software Modulerwasp_arimaforecasting.wasp
Title produced by softwareARIMA Forecasting
Date of computationTue, 09 Dec 2008 13:22:15 -0700
Cite this page as followsStatistical Computations at FreeStatistics.org, Office for Research Development and Education, URL https://freestatistics.org/blog/index.php?v=date/2008/Dec/09/t122885418126lkyuyks3se97d.htm/, Retrieved Fri, 17 May 2024 03:04:16 +0000
Statistical Computations at FreeStatistics.org, Office for Research Development and Education, URL https://freestatistics.org/blog/index.php?pk=31778, Retrieved Fri, 17 May 2024 03:04:16 +0000
QR Codes:

Original text written by user:
IsPrivate?No (this computation is public)
User-defined keywords
Estimated Impact134
Family? (F = Feedback message, R = changed R code, M = changed R Module, P = changed Parameters, D = changed Data)
F       [ARIMA Forecasting] [Paper: ARIMA fore...] [2008-12-09 20:22:15] [0831954c833179c36e9320daee0825b5] [Current]
-   P     [ARIMA Forecasting] [paper: forecast] [2008-12-18 13:33:58] [a18c43c8b63fa6800a53bb187b9ddd45]
Feedback Forum
2008-12-18 22:39:19 [Bob Leysen] [reply
Goed uitgelegd, ter verduidelijking:

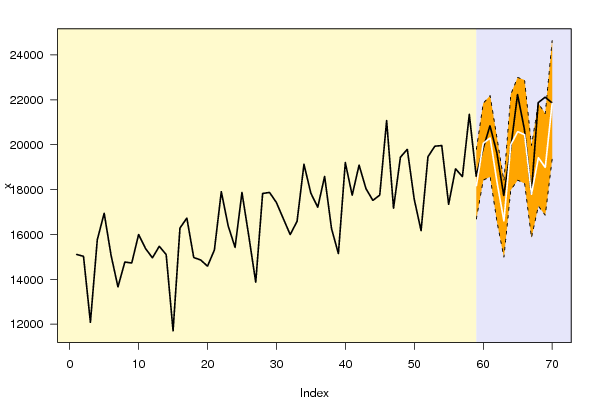
We merken in het blauwe deel (cfr +- index 58 tot einde) 2 stippellijnen. Deze twee lijnen geven respectievelijk de boven- en ondergrens weer (upper- and lowerbound). De zwarte lijn geeft de evolutie van de uitvoer weer zoals ze zich in werkelijkheid heeft voorgedaan en de witte lijn geeft de gemaakte voorspelling weer.

Het ‘betrouwbaarheidsinterval’ is relatief klein wat wil zeggen dat de kans vrij klein is dat er zich een grote afwijking voordoet. De vergelijking van de voorspelling tov de werkelijke gegevens leert ons dat het model als erg betrouwbaar kan worden beschouwd.
2008-12-18 22:41:31 [Bob Leysen] [reply
Step 2: ter verduidelijking

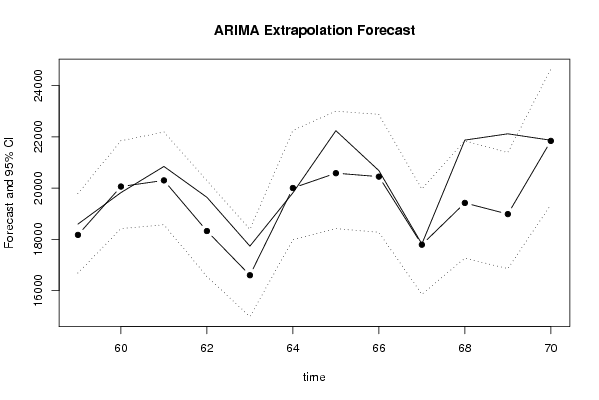
De interpretatie en analyse van de ARIMA Extrapolation Forecast leert ons dat in periode 68 en 69 de werkelijke waarden niet in het betrouwbaarheidsinterval vallen. De waar te nemen p – waarde voor beide periodes is ook erg klein, er moet dus een reden zijn waarom de werkelijke waarden het betrouwbaarheidsinterval overstijgen.

Wanneer we de datareeks verder onderzoeken kan worden vastgesteld dat de Totale Uitvoer van België een constante groei kent en dat er jaarlijks een seizonaliteit kan worden vastgesteld. Deze seizonaliteit doet zich voor in de periodes juli en augustus, de vakantieperiode.

Als de p – waarde HO=> Y{t} = F{t} kleiner is dan 5% dan is de werkelijke waarde significant verschillend van gemaakte voorspelling. Wanneer er dus een significante voorspelling dient gemaakt te worden moet de p – waarde groter zijn dan 5%. Dit is in het merendeel van de beschouwde periodes het geval, echter in periode 68 en 69 noteren we een p – waarde die kleiner is dan 5%.

Wanneer we het 95% betrouwbaarheidsinterval interpreteren merken we dat de betrokken periodes binnen de lower- en upperbound vallen.
2008-12-23 08:15:30 [Philippe Versluys] [reply
Knap gewerkt.

Post a new message
Dataseries X:
15107
15024
12083
15761
16943
15070
13660
14769
14725
15998
15371
14957
15470
15102
11704
16284
16727
14969
14861
14583
15306
17904
16379
15420
17871
15913
13867
17823
17872
17422
16705
15991
16584
19124
17839
17209
18587
16258
15142
19202
17747
19090
18040
17516
17752
21073
17170
19440
19795
17575
16165
19465
19932
19961
17343
18924
18574
21351
18595
19823
20844
19640
17735
19814
22239
20682
17819
21872
22117
21866


Summary of computational transaction
Raw Inputview raw input (R code)
Raw Outputview raw output of R engine
Computing time3 seconds
R Server'Herman Ole Andreas Wold' @ 193.190.124.10:1001

\begin{tabular}{lllllllll}
\hline
Summary of computational transaction \tabularnewline
Raw Input & view raw input (R code)  \tabularnewline
Raw Output & view raw output of R engine  \tabularnewline
Computing time & 3 seconds \tabularnewline
R Server & 'Herman Ole Andreas Wold' @ 193.190.124.10:1001 \tabularnewline
\hline
\end{tabular}
%Source: https://freestatistics.org/blog/index.php?pk=31778&T=0

[TABLE]
[ROW][C]Summary of computational transaction[/C][/ROW]
[ROW][C]Raw Input[/C][C]view raw input (R code) [/C][/ROW]
[ROW][C]Raw Output[/C][C]view raw output of R engine [/C][/ROW]
[ROW][C]Computing time[/C][C]3 seconds[/C][/ROW]
[ROW][C]R Server[/C][C]'Herman Ole Andreas Wold' @ 193.190.124.10:1001[/C][/ROW]
[/TABLE]
Source: https://freestatistics.org/blog/index.php?pk=31778&T=0

Globally Unique Identifier (entire table): ba.freestatistics.org/blog/index.php?pk=31778&T=0

As an alternative you can also use a QR Code:  

The GUIDs for individual cells are displayed in the table below:

Summary of computational transaction
Raw Inputview raw input (R code)
Raw Outputview raw output of R engine
Computing time3 seconds
R Server'Herman Ole Andreas Wold' @ 193.190.124.10:1001


Univariate ARIMA Extrapolation Forecast
timeY[t]F[t]95% LB95% UBp-value(H0: Y[t] = F[t])P(F[t]>Y[t-1])P(F[t]>Y[t-s])P(F[t]>Y[58])
4621073-------
4717170-------
4819440-------
4919795-------
5017575-------
5116165-------
5219465-------
5319932-------
5419961-------
5517343-------
5618924-------
5718574-------
5821351-------
591859518171.922916686.419319789.6730.30411e-040.88761e-04
601982320058.951418417.816721846.32070.39790.94580.75130.0783
612084420299.127318571.382822187.60850.28590.68940.69960.1375
621964018323.517216550.25720286.77160.09440.00590.77260.0013
631773516599.053514983.205418389.16120.10684e-040.68270
641981420002.812217983.893522248.380.43460.97610.68060.1196
652223920581.065218416.866722999.58250.08950.73290.70060.2663
662068220446.196918275.050322875.28410.42460.0740.65230.2327
671781917790.938215854.458219963.94180.48990.00460.65697e-04
682187219420.134317265.132521844.11950.02370.90230.65590.0592
692211718984.657716856.118721381.98210.00520.00910.63150.0265
702186621839.806119351.815924647.6680.49270.42330.63350.6335

\begin{tabular}{lllllllll}
\hline
Univariate ARIMA Extrapolation Forecast \tabularnewline
time & Y[t] & F[t] & 95% LB & 95% UB & p-value(H0: Y[t] = F[t]) & P(F[t]>Y[t-1]) & P(F[t]>Y[t-s]) & P(F[t]>Y[58]) \tabularnewline
46 & 21073 & - & - & - & - & - & - & - \tabularnewline
47 & 17170 & - & - & - & - & - & - & - \tabularnewline
48 & 19440 & - & - & - & - & - & - & - \tabularnewline
49 & 19795 & - & - & - & - & - & - & - \tabularnewline
50 & 17575 & - & - & - & - & - & - & - \tabularnewline
51 & 16165 & - & - & - & - & - & - & - \tabularnewline
52 & 19465 & - & - & - & - & - & - & - \tabularnewline
53 & 19932 & - & - & - & - & - & - & - \tabularnewline
54 & 19961 & - & - & - & - & - & - & - \tabularnewline
55 & 17343 & - & - & - & - & - & - & - \tabularnewline
56 & 18924 & - & - & - & - & - & - & - \tabularnewline
57 & 18574 & - & - & - & - & - & - & - \tabularnewline
58 & 21351 & - & - & - & - & - & - & - \tabularnewline
59 & 18595 & 18171.9229 & 16686.4193 & 19789.673 & 0.3041 & 1e-04 & 0.8876 & 1e-04 \tabularnewline
60 & 19823 & 20058.9514 & 18417.8167 & 21846.3207 & 0.3979 & 0.9458 & 0.7513 & 0.0783 \tabularnewline
61 & 20844 & 20299.1273 & 18571.3828 & 22187.6085 & 0.2859 & 0.6894 & 0.6996 & 0.1375 \tabularnewline
62 & 19640 & 18323.5172 & 16550.257 & 20286.7716 & 0.0944 & 0.0059 & 0.7726 & 0.0013 \tabularnewline
63 & 17735 & 16599.0535 & 14983.2054 & 18389.1612 & 0.1068 & 4e-04 & 0.6827 & 0 \tabularnewline
64 & 19814 & 20002.8122 & 17983.8935 & 22248.38 & 0.4346 & 0.9761 & 0.6806 & 0.1196 \tabularnewline
65 & 22239 & 20581.0652 & 18416.8667 & 22999.5825 & 0.0895 & 0.7329 & 0.7006 & 0.2663 \tabularnewline
66 & 20682 & 20446.1969 & 18275.0503 & 22875.2841 & 0.4246 & 0.074 & 0.6523 & 0.2327 \tabularnewline
67 & 17819 & 17790.9382 & 15854.4582 & 19963.9418 & 0.4899 & 0.0046 & 0.6569 & 7e-04 \tabularnewline
68 & 21872 & 19420.1343 & 17265.1325 & 21844.1195 & 0.0237 & 0.9023 & 0.6559 & 0.0592 \tabularnewline
69 & 22117 & 18984.6577 & 16856.1187 & 21381.9821 & 0.0052 & 0.0091 & 0.6315 & 0.0265 \tabularnewline
70 & 21866 & 21839.8061 & 19351.8159 & 24647.668 & 0.4927 & 0.4233 & 0.6335 & 0.6335 \tabularnewline
\hline
\end{tabular}
%Source: https://freestatistics.org/blog/index.php?pk=31778&T=1

[TABLE]
[ROW][C]Univariate ARIMA Extrapolation Forecast[/C][/ROW]
[ROW][C]time[/C][C]Y[t][/C][C]F[t][/C][C]95% LB[/C][C]95% UB[/C][C]p-value(H0: Y[t] = F[t])[/C][C]P(F[t]>Y[t-1])[/C][C]P(F[t]>Y[t-s])[/C][C]P(F[t]>Y[58])[/C][/ROW]
[ROW][C]46[/C][C]21073[/C][C]-[/C][C]-[/C][C]-[/C][C]-[/C][C]-[/C][C]-[/C][C]-[/C][/ROW]
[ROW][C]47[/C][C]17170[/C][C]-[/C][C]-[/C][C]-[/C][C]-[/C][C]-[/C][C]-[/C][C]-[/C][/ROW]
[ROW][C]48[/C][C]19440[/C][C]-[/C][C]-[/C][C]-[/C][C]-[/C][C]-[/C][C]-[/C][C]-[/C][/ROW]
[ROW][C]49[/C][C]19795[/C][C]-[/C][C]-[/C][C]-[/C][C]-[/C][C]-[/C][C]-[/C][C]-[/C][/ROW]
[ROW][C]50[/C][C]17575[/C][C]-[/C][C]-[/C][C]-[/C][C]-[/C][C]-[/C][C]-[/C][C]-[/C][/ROW]
[ROW][C]51[/C][C]16165[/C][C]-[/C][C]-[/C][C]-[/C][C]-[/C][C]-[/C][C]-[/C][C]-[/C][/ROW]
[ROW][C]52[/C][C]19465[/C][C]-[/C][C]-[/C][C]-[/C][C]-[/C][C]-[/C][C]-[/C][C]-[/C][/ROW]
[ROW][C]53[/C][C]19932[/C][C]-[/C][C]-[/C][C]-[/C][C]-[/C][C]-[/C][C]-[/C][C]-[/C][/ROW]
[ROW][C]54[/C][C]19961[/C][C]-[/C][C]-[/C][C]-[/C][C]-[/C][C]-[/C][C]-[/C][C]-[/C][/ROW]
[ROW][C]55[/C][C]17343[/C][C]-[/C][C]-[/C][C]-[/C][C]-[/C][C]-[/C][C]-[/C][C]-[/C][/ROW]
[ROW][C]56[/C][C]18924[/C][C]-[/C][C]-[/C][C]-[/C][C]-[/C][C]-[/C][C]-[/C][C]-[/C][/ROW]
[ROW][C]57[/C][C]18574[/C][C]-[/C][C]-[/C][C]-[/C][C]-[/C][C]-[/C][C]-[/C][C]-[/C][/ROW]
[ROW][C]58[/C][C]21351[/C][C]-[/C][C]-[/C][C]-[/C][C]-[/C][C]-[/C][C]-[/C][C]-[/C][/ROW]
[ROW][C]59[/C][C]18595[/C][C]18171.9229[/C][C]16686.4193[/C][C]19789.673[/C][C]0.3041[/C][C]1e-04[/C][C]0.8876[/C][C]1e-04[/C][/ROW]
[ROW][C]60[/C][C]19823[/C][C]20058.9514[/C][C]18417.8167[/C][C]21846.3207[/C][C]0.3979[/C][C]0.9458[/C][C]0.7513[/C][C]0.0783[/C][/ROW]
[ROW][C]61[/C][C]20844[/C][C]20299.1273[/C][C]18571.3828[/C][C]22187.6085[/C][C]0.2859[/C][C]0.6894[/C][C]0.6996[/C][C]0.1375[/C][/ROW]
[ROW][C]62[/C][C]19640[/C][C]18323.5172[/C][C]16550.257[/C][C]20286.7716[/C][C]0.0944[/C][C]0.0059[/C][C]0.7726[/C][C]0.0013[/C][/ROW]
[ROW][C]63[/C][C]17735[/C][C]16599.0535[/C][C]14983.2054[/C][C]18389.1612[/C][C]0.1068[/C][C]4e-04[/C][C]0.6827[/C][C]0[/C][/ROW]
[ROW][C]64[/C][C]19814[/C][C]20002.8122[/C][C]17983.8935[/C][C]22248.38[/C][C]0.4346[/C][C]0.9761[/C][C]0.6806[/C][C]0.1196[/C][/ROW]
[ROW][C]65[/C][C]22239[/C][C]20581.0652[/C][C]18416.8667[/C][C]22999.5825[/C][C]0.0895[/C][C]0.7329[/C][C]0.7006[/C][C]0.2663[/C][/ROW]
[ROW][C]66[/C][C]20682[/C][C]20446.1969[/C][C]18275.0503[/C][C]22875.2841[/C][C]0.4246[/C][C]0.074[/C][C]0.6523[/C][C]0.2327[/C][/ROW]
[ROW][C]67[/C][C]17819[/C][C]17790.9382[/C][C]15854.4582[/C][C]19963.9418[/C][C]0.4899[/C][C]0.0046[/C][C]0.6569[/C][C]7e-04[/C][/ROW]
[ROW][C]68[/C][C]21872[/C][C]19420.1343[/C][C]17265.1325[/C][C]21844.1195[/C][C]0.0237[/C][C]0.9023[/C][C]0.6559[/C][C]0.0592[/C][/ROW]
[ROW][C]69[/C][C]22117[/C][C]18984.6577[/C][C]16856.1187[/C][C]21381.9821[/C][C]0.0052[/C][C]0.0091[/C][C]0.6315[/C][C]0.0265[/C][/ROW]
[ROW][C]70[/C][C]21866[/C][C]21839.8061[/C][C]19351.8159[/C][C]24647.668[/C][C]0.4927[/C][C]0.4233[/C][C]0.6335[/C][C]0.6335[/C][/ROW]
[/TABLE]
Source: https://freestatistics.org/blog/index.php?pk=31778&T=1

Globally Unique Identifier (entire table): ba.freestatistics.org/blog/index.php?pk=31778&T=1

As an alternative you can also use a QR Code:  

The GUIDs for individual cells are displayed in the table below:

Univariate ARIMA Extrapolation Forecast
timeY[t]F[t]95% LB95% UBp-value(H0: Y[t] = F[t])P(F[t]>Y[t-1])P(F[t]>Y[t-s])P(F[t]>Y[58])
4621073-------
4717170-------
4819440-------
4919795-------
5017575-------
5116165-------
5219465-------
5319932-------
5419961-------
5517343-------
5618924-------
5718574-------
5821351-------
591859518171.922916686.419319789.6730.30411e-040.88761e-04
601982320058.951418417.816721846.32070.39790.94580.75130.0783
612084420299.127318571.382822187.60850.28590.68940.69960.1375
621964018323.517216550.25720286.77160.09440.00590.77260.0013
631773516599.053514983.205418389.16120.10684e-040.68270
641981420002.812217983.893522248.380.43460.97610.68060.1196
652223920581.065218416.866722999.58250.08950.73290.70060.2663
662068220446.196918275.050322875.28410.42460.0740.65230.2327
671781917790.938215854.458219963.94180.48990.00460.65697e-04
682187219420.134317265.132521844.11950.02370.90230.65590.0592
692211718984.657716856.118721381.98210.00520.00910.63150.0265
702186621839.806119351.815924647.6680.49270.42330.63350.6335


Univariate ARIMA Extrapolation Forecast Performance
time% S.E.PEMAPESq.EMSERMSE
590.04540.02330.0019178994.244814916.1871122.1318
600.0455-0.01180.00155673.04674639.420668.1133
610.04750.02680.0022296886.210624740.5175157.2912
620.05470.07180.0061733126.8706144427.2392380.0358
630.0550.06840.00571290374.3638107531.197327.9195
640.0573-0.00948e-0435650.04372970.83754.5054
650.060.08060.00672748747.7036229062.3086478.6045
660.06060.01150.00155603.11374633.592868.0705
670.06230.00161e-04787.465665.62218.1007
680.06370.12630.01056011645.3056500970.4421707.7927
690.06440.1650.01379811568.1889817630.6824904.2293
700.06560.00121e-04686.118557.17657.5615

\begin{tabular}{lllllllll}
\hline
Univariate ARIMA Extrapolation Forecast Performance \tabularnewline
time & % S.E. & PE & MAPE & Sq.E & MSE & RMSE \tabularnewline
59 & 0.0454 & 0.0233 & 0.0019 & 178994.2448 & 14916.1871 & 122.1318 \tabularnewline
60 & 0.0455 & -0.0118 & 0.001 & 55673.0467 & 4639.4206 & 68.1133 \tabularnewline
61 & 0.0475 & 0.0268 & 0.0022 & 296886.2106 & 24740.5175 & 157.2912 \tabularnewline
62 & 0.0547 & 0.0718 & 0.006 & 1733126.8706 & 144427.2392 & 380.0358 \tabularnewline
63 & 0.055 & 0.0684 & 0.0057 & 1290374.3638 & 107531.197 & 327.9195 \tabularnewline
64 & 0.0573 & -0.0094 & 8e-04 & 35650.0437 & 2970.837 & 54.5054 \tabularnewline
65 & 0.06 & 0.0806 & 0.0067 & 2748747.7036 & 229062.3086 & 478.6045 \tabularnewline
66 & 0.0606 & 0.0115 & 0.001 & 55603.1137 & 4633.5928 & 68.0705 \tabularnewline
67 & 0.0623 & 0.0016 & 1e-04 & 787.4656 & 65.6221 & 8.1007 \tabularnewline
68 & 0.0637 & 0.1263 & 0.0105 & 6011645.3056 & 500970.4421 & 707.7927 \tabularnewline
69 & 0.0644 & 0.165 & 0.0137 & 9811568.1889 & 817630.6824 & 904.2293 \tabularnewline
70 & 0.0656 & 0.0012 & 1e-04 & 686.1185 & 57.1765 & 7.5615 \tabularnewline
\hline
\end{tabular}
%Source: https://freestatistics.org/blog/index.php?pk=31778&T=2

[TABLE]
[ROW][C]Univariate ARIMA Extrapolation Forecast Performance[/C][/ROW]
[ROW][C]time[/C][C]% S.E.[/C][C]PE[/C][C]MAPE[/C][C]Sq.E[/C][C]MSE[/C][C]RMSE[/C][/ROW]
[ROW][C]59[/C][C]0.0454[/C][C]0.0233[/C][C]0.0019[/C][C]178994.2448[/C][C]14916.1871[/C][C]122.1318[/C][/ROW]
[ROW][C]60[/C][C]0.0455[/C][C]-0.0118[/C][C]0.001[/C][C]55673.0467[/C][C]4639.4206[/C][C]68.1133[/C][/ROW]
[ROW][C]61[/C][C]0.0475[/C][C]0.0268[/C][C]0.0022[/C][C]296886.2106[/C][C]24740.5175[/C][C]157.2912[/C][/ROW]
[ROW][C]62[/C][C]0.0547[/C][C]0.0718[/C][C]0.006[/C][C]1733126.8706[/C][C]144427.2392[/C][C]380.0358[/C][/ROW]
[ROW][C]63[/C][C]0.055[/C][C]0.0684[/C][C]0.0057[/C][C]1290374.3638[/C][C]107531.197[/C][C]327.9195[/C][/ROW]
[ROW][C]64[/C][C]0.0573[/C][C]-0.0094[/C][C]8e-04[/C][C]35650.0437[/C][C]2970.837[/C][C]54.5054[/C][/ROW]
[ROW][C]65[/C][C]0.06[/C][C]0.0806[/C][C]0.0067[/C][C]2748747.7036[/C][C]229062.3086[/C][C]478.6045[/C][/ROW]
[ROW][C]66[/C][C]0.0606[/C][C]0.0115[/C][C]0.001[/C][C]55603.1137[/C][C]4633.5928[/C][C]68.0705[/C][/ROW]
[ROW][C]67[/C][C]0.0623[/C][C]0.0016[/C][C]1e-04[/C][C]787.4656[/C][C]65.6221[/C][C]8.1007[/C][/ROW]
[ROW][C]68[/C][C]0.0637[/C][C]0.1263[/C][C]0.0105[/C][C]6011645.3056[/C][C]500970.4421[/C][C]707.7927[/C][/ROW]
[ROW][C]69[/C][C]0.0644[/C][C]0.165[/C][C]0.0137[/C][C]9811568.1889[/C][C]817630.6824[/C][C]904.2293[/C][/ROW]
[ROW][C]70[/C][C]0.0656[/C][C]0.0012[/C][C]1e-04[/C][C]686.1185[/C][C]57.1765[/C][C]7.5615[/C][/ROW]
[/TABLE]
Source: https://freestatistics.org/blog/index.php?pk=31778&T=2

Globally Unique Identifier (entire table): ba.freestatistics.org/blog/index.php?pk=31778&T=2

As an alternative you can also use a QR Code:  

The GUIDs for individual cells are displayed in the table below:

Univariate ARIMA Extrapolation Forecast Performance
time% S.E.PEMAPESq.EMSERMSE
590.04540.02330.0019178994.244814916.1871122.1318
600.0455-0.01180.00155673.04674639.420668.1133
610.04750.02680.0022296886.210624740.5175157.2912
620.05470.07180.0061733126.8706144427.2392380.0358
630.0550.06840.00571290374.3638107531.197327.9195
640.0573-0.00948e-0435650.04372970.83754.5054
650.060.08060.00672748747.7036229062.3086478.6045
660.06060.01150.00155603.11374633.592868.0705
670.06230.00161e-04787.465665.62218.1007
680.06370.12630.01056011645.3056500970.4421707.7927
690.06440.1650.01379811568.1889817630.6824904.2293
700.06560.00121e-04686.118557.17657.5615


Parameters (Session):
par1 = 12 ; par2 = 0.0 ; par3 = 0 ; par4 = 1 ; par5 = 12 ; par6 = 3 ; par7 = 0 ; par8 = 0 ; par9 = 0 ; par10 = FALSE ;
Parameters (R input):
par1 = 12 ; par2 = 0.0 ; par3 = 0 ; par4 = 1 ; par5 = 12 ; par6 = 3 ; par7 = 0 ; par8 = 0 ; par9 = 0 ; par10 = FALSE ;
R code (references can be found in the software module):
par1 <- as.numeric(par1) #cut off periods
par2 <- as.numeric(par2) #lambda
par3 <- as.numeric(par3) #degree of non-seasonal differencing
par4 <- as.numeric(par4) #degree of seasonal differencing
par5 <- as.numeric(par5) #seasonal period
par6 <- as.numeric(par6) #p
par7 <- as.numeric(par7) #q
par8 <- as.numeric(par8) #P
par9 <- as.numeric(par9) #Q
if (par10 == 'TRUE') par10 <- TRUE
if (par10 == 'FALSE') par10 <- FALSE
if (par2 == 0) x <- log(x)
if (par2 != 0) x <- x^par2
lx <- length(x)
first <- lx - 2*par1
nx <- lx - par1
nx1 <- nx + 1
fx <- lx - nx
if (fx < 1) {
fx <- par5
nx1 <- lx + fx - 1
first <- lx - 2*fx
}
first <- 1
if (fx < 3) fx <- round(lx/10,0)
(arima.out <- arima(x[1:nx], order=c(par6,par3,par7), seasonal=list(order=c(par8,par4,par9), period=par5), include.mean=par10, method='ML'))
(forecast <- predict(arima.out,fx))
(lb <- forecast$pred - 1.96 * forecast$se)
(ub <- forecast$pred + 1.96 * forecast$se)
if (par2 == 0) {
x <- exp(x)
forecast$pred <- exp(forecast$pred)
lb <- exp(lb)
ub <- exp(ub)
}
if (par2 != 0) {
x <- x^(1/par2)
forecast$pred <- forecast$pred^(1/par2)
lb <- lb^(1/par2)
ub <- ub^(1/par2)
}
if (par2 < 0) {
olb <- lb
lb <- ub
ub <- olb
}
(actandfor <- c(x[1:nx], forecast$pred))
(perc.se <- (ub-forecast$pred)/1.96/forecast$pred)
bitmap(file='test1.png')
opar <- par(mar=c(4,4,2,2),las=1)
ylim <- c( min(x[first:nx],lb), max(x[first:nx],ub))
plot(x,ylim=ylim,type='n',xlim=c(first,lx))
usr <- par('usr')
rect(usr[1],usr[3],nx+1,usr[4],border=NA,col='lemonchiffon')
rect(nx1,usr[3],usr[2],usr[4],border=NA,col='lavender')
abline(h= (-3:3)*2 , col ='gray', lty =3)
polygon( c(nx1:lx,lx:nx1), c(lb,rev(ub)), col = 'orange', lty=2,border=NA)
lines(nx1:lx, lb , lty=2)
lines(nx1:lx, ub , lty=2)
lines(x, lwd=2)
lines(nx1:lx, forecast$pred , lwd=2 , col ='white')
box()
par(opar)
dev.off()
prob.dec <- array(NA, dim=fx)
prob.sdec <- array(NA, dim=fx)
prob.ldec <- array(NA, dim=fx)
prob.pval <- array(NA, dim=fx)
perf.pe <- array(0, dim=fx)
perf.mape <- array(0, dim=fx)
perf.se <- array(0, dim=fx)
perf.mse <- array(0, dim=fx)
perf.rmse <- array(0, dim=fx)
for (i in 1:fx) {
locSD <- (ub[i] - forecast$pred[i]) / 1.96
perf.pe[i] = (x[nx+i] - forecast$pred[i]) / forecast$pred[i]
perf.mape[i] = perf.mape[i] + abs(perf.pe[i])
perf.se[i] = (x[nx+i] - forecast$pred[i])^2
perf.mse[i] = perf.mse[i] + perf.se[i]
prob.dec[i] = pnorm((x[nx+i-1] - forecast$pred[i]) / locSD)
prob.sdec[i] = pnorm((x[nx+i-par5] - forecast$pred[i]) / locSD)
prob.ldec[i] = pnorm((x[nx] - forecast$pred[i]) / locSD)
prob.pval[i] = pnorm(abs(x[nx+i] - forecast$pred[i]) / locSD)
}
perf.mape = perf.mape / fx
perf.mse = perf.mse / fx
perf.rmse = sqrt(perf.mse)
bitmap(file='test2.png')
plot(forecast$pred, pch=19, type='b',main='ARIMA Extrapolation Forecast', ylab='Forecast and 95% CI', xlab='time',ylim=c(min(lb),max(ub)))
dum <- forecast$pred
dum[1:12] <- x[(nx+1):lx]
lines(dum, lty=1)
lines(ub,lty=3)
lines(lb,lty=3)
dev.off()
load(file='createtable')
a<-table.start()
a<-table.row.start(a)
a<-table.element(a,'Univariate ARIMA Extrapolation Forecast',9,TRUE)
a<-table.row.end(a)
a<-table.row.start(a)
a<-table.element(a,'time',1,header=TRUE)
a<-table.element(a,'Y[t]',1,header=TRUE)
a<-table.element(a,'F[t]',1,header=TRUE)
a<-table.element(a,'95% LB',1,header=TRUE)
a<-table.element(a,'95% UB',1,header=TRUE)
a<-table.element(a,'p-value
(H0: Y[t] = F[t])',1,header=TRUE)
a<-table.element(a,'P(F[t]>Y[t-1])',1,header=TRUE)
a<-table.element(a,'P(F[t]>Y[t-s])',1,header=TRUE)
mylab <- paste('P(F[t]>Y[',nx,sep='')
mylab <- paste(mylab,'])',sep='')
a<-table.element(a,mylab,1,header=TRUE)
a<-table.row.end(a)
for (i in (nx-par5):nx) {
a<-table.row.start(a)
a<-table.element(a,i,header=TRUE)
a<-table.element(a,x[i])
a<-table.element(a,'-')
a<-table.row.end(a)
}
for (i in 1:fx) {
a<-table.row.start(a)
a<-table.element(a,nx+i,header=TRUE)
a<-table.element(a,round(x[nx+i],4))
a<-table.element(a,round(forecast$pred[i],4))
a<-table.element(a,round(lb[i],4))
a<-table.element(a,round(ub[i],4))
a<-table.element(a,round((1-prob.pval[i]),4))
a<-table.element(a,round((1-prob.dec[i]),4))
a<-table.element(a,round((1-prob.sdec[i]),4))
a<-table.element(a,round((1-prob.ldec[i]),4))
a<-table.row.end(a)
}
a<-table.end(a)
table.save(a,file='mytable.tab')
a<-table.start()
a<-table.row.start(a)
a<-table.element(a,'Univariate ARIMA Extrapolation Forecast Performance',7,TRUE)
a<-table.row.end(a)
a<-table.row.start(a)
a<-table.element(a,'time',1,header=TRUE)
a<-table.element(a,'% S.E.',1,header=TRUE)
a<-table.element(a,'PE',1,header=TRUE)
a<-table.element(a,'MAPE',1,header=TRUE)
a<-table.element(a,'Sq.E',1,header=TRUE)
a<-table.element(a,'MSE',1,header=TRUE)
a<-table.element(a,'RMSE',1,header=TRUE)
a<-table.row.end(a)
for (i in 1:fx) {
a<-table.row.start(a)
a<-table.element(a,nx+i,header=TRUE)
a<-table.element(a,round(perc.se[i],4))
a<-table.element(a,round(perf.pe[i],4))
a<-table.element(a,round(perf.mape[i],4))
a<-table.element(a,round(perf.se[i],4))
a<-table.element(a,round(perf.mse[i],4))
a<-table.element(a,round(perf.rmse[i],4))
a<-table.row.end(a)
}
a<-table.end(a)
table.save(a,file='mytable1.tab')