Free Statistics

of Irreproducible Research!

Author's title

Author*Unverified author*
R Software Modulerwasp_arimabackwardselection.wasp
Title produced by softwareARIMA Backward Selection
Date of computationTue, 09 Dec 2008 13:14:49 -0700
Cite this page as followsStatistical Computations at FreeStatistics.org, Office for Research Development and Education, URL https://freestatistics.org/blog/index.php?v=date/2008/Dec/09/t1228853770eczz6c9c2076keb.htm/, Retrieved Fri, 17 May 2024 05:15:50 +0000
Statistical Computations at FreeStatistics.org, Office for Research Development and Education, URL https://freestatistics.org/blog/index.php?pk=31771, Retrieved Fri, 17 May 2024 05:15:50 +0000
QR Codes:

Original text written by user:
IsPrivate?No (this computation is public)
User-defined keywords
Estimated Impact157
Family? (F = Feedback message, R = changed R code, M = changed R Module, P = changed Parameters, D = changed Data)
F       [ARIMA Backward Selection] [Step5] [2008-12-09 20:14:49] [a413cf7744efd6bb212437a3916e2f23] [Current]
-   PD    [ARIMA Backward Selection] [verbetering] [2008-12-14 13:36:42] [3a9fc6d5b5e0e816787b7dbace57e7cd]
Feedback Forum
2008-12-14 13:38:54 [Gert-Jan Geudens] [reply
Foutieve berekening en geen conclusie. Hier kan je de berekening met de correcte parameters vinden :

http://www.freestatistics.org/blog/date/2008/Dec/14/t1229261865aitt6224danr9ov.htm
2008-12-15 14:30:40 [Jonas Scheltjens] [reply
De student heeft hier enkel de link en 3 grafieken gegeven zonder enige degelijke uitleg of verklaring. De berekening is ook fout. Aangezien het niet de taak is van de persoon die de assessments doet om deze taak voor de student te maken, verwijs ik dan ook voor de algemene en volledige uitleg voor deze Step naar Step 5 voor de unemployment data, dewelke ik zeer uitgebreid heb besproken en waar alle informatie in staat om deze vraag beter op te lossen.

Post a new message
Dataseries X:
1846,5
2796,3
2895,6
2472,2
2584,4
2630,4
2663,1
3176,2
2856,7
2551,4
3088,7
2628,3
2226,2
3023,6
3077,9
3084,1
2990,3
2949,6
3014,7
3517,7
3121,2
3067,4
3174,6
2676,3
2424
3195,1
3146,6
3506,7
3528,5
3365,1
3153
3843,3
3123,2
3361,1
3481,9
2970,5
2537
3257,6
3301,3
3391,6
2933,6
3283,2
3139,7
3486,4
3202,2
3294,4
3550,3
3279,3
2678,6
3451,4
3977,1
3814,8
3310,5
3971,8
4051,9
4057,6
4391,4
3628,9
4092,2
3822,5


Summary of computational transaction
Raw Inputview raw input (R code)
Raw Outputview raw output of R engine
Computing time4 seconds
R Server'Sir Ronald Aylmer Fisher' @ 193.190.124.24

\begin{tabular}{lllllllll}
\hline
Summary of computational transaction \tabularnewline
Raw Input & view raw input (R code)  \tabularnewline
Raw Output & view raw output of R engine  \tabularnewline
Computing time & 4 seconds \tabularnewline
R Server & 'Sir Ronald Aylmer Fisher' @ 193.190.124.24 \tabularnewline
\hline
\end{tabular}
%Source: https://freestatistics.org/blog/index.php?pk=31771&T=0

[TABLE]
[ROW][C]Summary of computational transaction[/C][/ROW]
[ROW][C]Raw Input[/C][C]view raw input (R code) [/C][/ROW]
[ROW][C]Raw Output[/C][C]view raw output of R engine [/C][/ROW]
[ROW][C]Computing time[/C][C]4 seconds[/C][/ROW]
[ROW][C]R Server[/C][C]'Sir Ronald Aylmer Fisher' @ 193.190.124.24[/C][/ROW]
[/TABLE]
Source: https://freestatistics.org/blog/index.php?pk=31771&T=0

Globally Unique Identifier (entire table): ba.freestatistics.org/blog/index.php?pk=31771&T=0

As an alternative you can also use a QR Code:  

The GUIDs for individual cells are displayed in the table below:

Summary of computational transaction
Raw Inputview raw input (R code)
Raw Outputview raw output of R engine
Computing time4 seconds
R Server'Sir Ronald Aylmer Fisher' @ 193.190.124.24


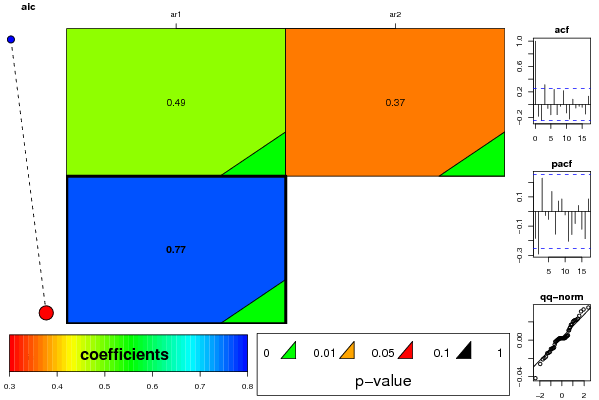
ARIMA Parameter Estimation and Backward Selection
Iterationar1ar2
Estimates ( 1 )0.48960.369
(p-val)(6e-04 )(0.009 )
Estimates ( 2 )0.76690
(p-val)(0 )(NA )
Estimates ( 3 )NANA
(p-val)(NA )(NA )

\begin{tabular}{lllllllll}
\hline
ARIMA Parameter Estimation and Backward Selection \tabularnewline
Iteration & ar1 & ar2 \tabularnewline
Estimates ( 1 ) & 0.4896 & 0.369 \tabularnewline
(p-val) & (6e-04 ) & (0.009 ) \tabularnewline
Estimates ( 2 ) & 0.7669 & 0 \tabularnewline
(p-val) & (0 ) & (NA ) \tabularnewline
Estimates ( 3 ) & NA & NA \tabularnewline
(p-val) & (NA ) & (NA ) \tabularnewline
\hline
\end{tabular}
%Source: https://freestatistics.org/blog/index.php?pk=31771&T=1

[TABLE]
[ROW][C]ARIMA Parameter Estimation and Backward Selection[/C][/ROW]
[ROW][C]Iteration[/C][C]ar1[/C][C]ar2[/C][/ROW]
[ROW][C]Estimates ( 1 )[/C][C]0.4896[/C][C]0.369[/C][/ROW]
[ROW][C](p-val)[/C][C](6e-04 )[/C][C](0.009 )[/C][/ROW]
[ROW][C]Estimates ( 2 )[/C][C]0.7669[/C][C]0[/C][/ROW]
[ROW][C](p-val)[/C][C](0 )[/C][C](NA )[/C][/ROW]
[ROW][C]Estimates ( 3 )[/C][C]NA[/C][C]NA[/C][/ROW]
[ROW][C](p-val)[/C][C](NA )[/C][C](NA )[/C][/ROW]
[/TABLE]
Source: https://freestatistics.org/blog/index.php?pk=31771&T=1

Globally Unique Identifier (entire table): ba.freestatistics.org/blog/index.php?pk=31771&T=1

As an alternative you can also use a QR Code:  

The GUIDs for individual cells are displayed in the table below:

ARIMA Parameter Estimation and Backward Selection
Iterationar1ar2
Estimates ( 1 )0.48960.369
(p-val)(6e-04 )(0.009 )
Estimates ( 2 )0.76690
(p-val)(0 )(NA )
Estimates ( 3 )NANA
(p-val)(NA )(NA )


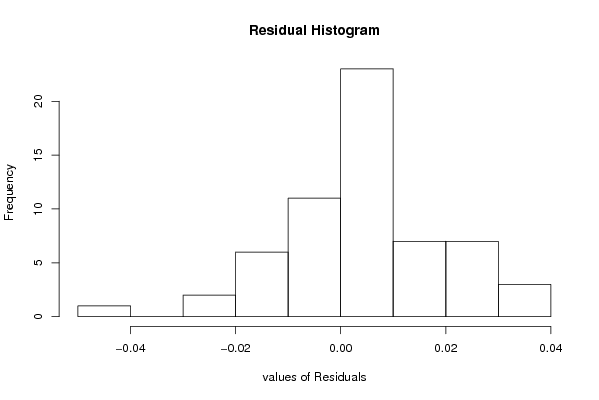
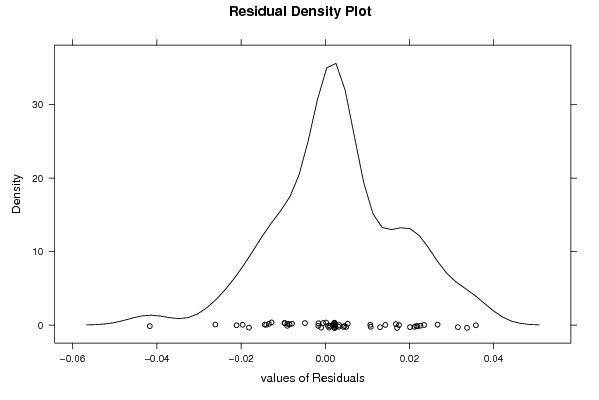
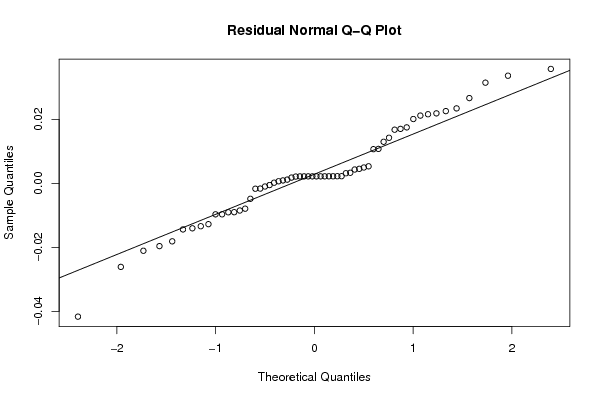
Estimated ARIMA Residuals
Value
0.00219765652532837
0.0234575151651479
-0.0127586662160822
-0.00968064030440188
0.0357880679057202
0.00331117398628239
-0.00849041168289552
0.00316698597346398
0.00020304549811367
-0.00167741548034556
0.0225994349043066
-0.0210815095644315
-0.0140524820286577
0.0142650090766487
0.00181367014729172
-0.00792085600554238
0.0218964313862209
0.0211986804133235
0.000653723405576123
-0.0181320731228203
0.00433278947049898
-0.0134033523358386
0.0130080516083662
0.0106979572816082
0.00533908707803787
-0.00901707408062391
-0.00904575085495685
0.00496391215931835
-0.0144106996094013
-0.0416903086898581
0.0175116974666683
0.017047215892791
-0.0196320372547736
0.0167819108582319
0.000921016237713346
0.00454649415548047
0.0216210218308923
-0.000524284671705288
-0.00098483834291585
0.0314930283613966
0.00116997999861379
-0.00163139723050332
0.0201269902692300
0.0266742036113286
-0.00967444702148113
0.0336730393744835
-0.0261217881487323
-0.00483113253742617
0.0107799067206797

\begin{tabular}{lllllllll}
\hline
Estimated ARIMA Residuals \tabularnewline
Value \tabularnewline
0.00219765652532837 \tabularnewline
0.0234575151651479 \tabularnewline
-0.0127586662160822 \tabularnewline
-0.00968064030440188 \tabularnewline
0.0357880679057202 \tabularnewline
0.00331117398628239 \tabularnewline
-0.00849041168289552 \tabularnewline
0.00316698597346398 \tabularnewline
0.00020304549811367 \tabularnewline
-0.00167741548034556 \tabularnewline
0.0225994349043066 \tabularnewline
-0.0210815095644315 \tabularnewline
-0.0140524820286577 \tabularnewline
0.0142650090766487 \tabularnewline
0.00181367014729172 \tabularnewline
-0.00792085600554238 \tabularnewline
0.0218964313862209 \tabularnewline
0.0211986804133235 \tabularnewline
0.000653723405576123 \tabularnewline
-0.0181320731228203 \tabularnewline
0.00433278947049898 \tabularnewline
-0.0134033523358386 \tabularnewline
0.0130080516083662 \tabularnewline
0.0106979572816082 \tabularnewline
0.00533908707803787 \tabularnewline
-0.00901707408062391 \tabularnewline
-0.00904575085495685 \tabularnewline
0.00496391215931835 \tabularnewline
-0.0144106996094013 \tabularnewline
-0.0416903086898581 \tabularnewline
0.0175116974666683 \tabularnewline
0.017047215892791 \tabularnewline
-0.0196320372547736 \tabularnewline
0.0167819108582319 \tabularnewline
0.000921016237713346 \tabularnewline
0.00454649415548047 \tabularnewline
0.0216210218308923 \tabularnewline
-0.000524284671705288 \tabularnewline
-0.00098483834291585 \tabularnewline
0.0314930283613966 \tabularnewline
0.00116997999861379 \tabularnewline
-0.00163139723050332 \tabularnewline
0.0201269902692300 \tabularnewline
0.0266742036113286 \tabularnewline
-0.00967444702148113 \tabularnewline
0.0336730393744835 \tabularnewline
-0.0261217881487323 \tabularnewline
-0.00483113253742617 \tabularnewline
0.0107799067206797 \tabularnewline
\hline
\end{tabular}
%Source: https://freestatistics.org/blog/index.php?pk=31771&T=2

[TABLE]
[ROW][C]Estimated ARIMA Residuals[/C][/ROW]
[ROW][C]Value[/C][/ROW]
[ROW][C]0.00219765652532837[/C][/ROW]
[ROW][C]0.0234575151651479[/C][/ROW]
[ROW][C]-0.0127586662160822[/C][/ROW]
[ROW][C]-0.00968064030440188[/C][/ROW]
[ROW][C]0.0357880679057202[/C][/ROW]
[ROW][C]0.00331117398628239[/C][/ROW]
[ROW][C]-0.00849041168289552[/C][/ROW]
[ROW][C]0.00316698597346398[/C][/ROW]
[ROW][C]0.00020304549811367[/C][/ROW]
[ROW][C]-0.00167741548034556[/C][/ROW]
[ROW][C]0.0225994349043066[/C][/ROW]
[ROW][C]-0.0210815095644315[/C][/ROW]
[ROW][C]-0.0140524820286577[/C][/ROW]
[ROW][C]0.0142650090766487[/C][/ROW]
[ROW][C]0.00181367014729172[/C][/ROW]
[ROW][C]-0.00792085600554238[/C][/ROW]
[ROW][C]0.0218964313862209[/C][/ROW]
[ROW][C]0.0211986804133235[/C][/ROW]
[ROW][C]0.000653723405576123[/C][/ROW]
[ROW][C]-0.0181320731228203[/C][/ROW]
[ROW][C]0.00433278947049898[/C][/ROW]
[ROW][C]-0.0134033523358386[/C][/ROW]
[ROW][C]0.0130080516083662[/C][/ROW]
[ROW][C]0.0106979572816082[/C][/ROW]
[ROW][C]0.00533908707803787[/C][/ROW]
[ROW][C]-0.00901707408062391[/C][/ROW]
[ROW][C]-0.00904575085495685[/C][/ROW]
[ROW][C]0.00496391215931835[/C][/ROW]
[ROW][C]-0.0144106996094013[/C][/ROW]
[ROW][C]-0.0416903086898581[/C][/ROW]
[ROW][C]0.0175116974666683[/C][/ROW]
[ROW][C]0.017047215892791[/C][/ROW]
[ROW][C]-0.0196320372547736[/C][/ROW]
[ROW][C]0.0167819108582319[/C][/ROW]
[ROW][C]0.000921016237713346[/C][/ROW]
[ROW][C]0.00454649415548047[/C][/ROW]
[ROW][C]0.0216210218308923[/C][/ROW]
[ROW][C]-0.000524284671705288[/C][/ROW]
[ROW][C]-0.00098483834291585[/C][/ROW]
[ROW][C]0.0314930283613966[/C][/ROW]
[ROW][C]0.00116997999861379[/C][/ROW]
[ROW][C]-0.00163139723050332[/C][/ROW]
[ROW][C]0.0201269902692300[/C][/ROW]
[ROW][C]0.0266742036113286[/C][/ROW]
[ROW][C]-0.00967444702148113[/C][/ROW]
[ROW][C]0.0336730393744835[/C][/ROW]
[ROW][C]-0.0261217881487323[/C][/ROW]
[ROW][C]-0.00483113253742617[/C][/ROW]
[ROW][C]0.0107799067206797[/C][/ROW]
[/TABLE]
Source: https://freestatistics.org/blog/index.php?pk=31771&T=2

Globally Unique Identifier (entire table): ba.freestatistics.org/blog/index.php?pk=31771&T=2

As an alternative you can also use a QR Code:  

The GUIDs for individual cells are displayed in the table below:

Estimated ARIMA Residuals
Value
0.00219765652532837
0.0234575151651479
-0.0127586662160822
-0.00968064030440188
0.0357880679057202
0.00331117398628239
-0.00849041168289552
0.00316698597346398
0.00020304549811367
-0.00167741548034556
0.0225994349043066
-0.0210815095644315
-0.0140524820286577
0.0142650090766487
0.00181367014729172
-0.00792085600554238
0.0218964313862209
0.0211986804133235
0.000653723405576123
-0.0181320731228203
0.00433278947049898
-0.0134033523358386
0.0130080516083662
0.0106979572816082
0.00533908707803787
-0.00901707408062391
-0.00904575085495685
0.00496391215931835
-0.0144106996094013
-0.0416903086898581
0.0175116974666683
0.017047215892791
-0.0196320372547736
0.0167819108582319
0.000921016237713346
0.00454649415548047
0.0216210218308923
-0.000524284671705288
-0.00098483834291585
0.0314930283613966
0.00116997999861379
-0.00163139723050332
0.0201269902692300
0.0266742036113286
-0.00967444702148113
0.0336730393744835
-0.0261217881487323
-0.00483113253742617
0.0107799067206797


Parameters (Session):
par1 = FALSE ; par2 = 0.1 ; par3 = 0 ; par4 = 1 ; par5 = 12 ; par6 = 2 ; par7 = 0 ; par8 = 0 ; par9 = 0 ;
Parameters (R input):
par1 = FALSE ; par2 = 0.1 ; par3 = 0 ; par4 = 1 ; par5 = 12 ; par6 = 2 ; par7 = 0 ; par8 = 0 ; par9 = 0 ;
R code (references can be found in the software module):
library(lattice)
if (par1 == 'TRUE') par1 <- TRUE
if (par1 == 'FALSE') par1 <- FALSE
par2 <- as.numeric(par2) #Box-Cox lambda transformation parameter
par3 <- as.numeric(par3) #degree of non-seasonal differencing
par4 <- as.numeric(par4) #degree of seasonal differencing
par5 <- as.numeric(par5) #seasonal period
par6 <- as.numeric(par6) #degree (p) of the non-seasonal AR(p) polynomial
par7 <- as.numeric(par7) #degree (q) of the non-seasonal MA(q) polynomial
par8 <- as.numeric(par8) #degree (P) of the seasonal AR(P) polynomial
par9 <- as.numeric(par9) #degree (Q) of the seasonal MA(Q) polynomial
armaGR <- function(arima.out, names, n){
try1 <- arima.out$coef
try2 <- sqrt(diag(arima.out$var.coef))
try.data.frame <- data.frame(matrix(NA,ncol=4,nrow=length(names)))
dimnames(try.data.frame) <- list(names,c('coef','std','tstat','pv'))
try.data.frame[,1] <- try1
for(i in 1:length(try2)) try.data.frame[which(rownames(try.data.frame)==names(try2)[i]),2] <- try2[i]
try.data.frame[,3] <- try.data.frame[,1] / try.data.frame[,2]
try.data.frame[,4] <- round((1-pt(abs(try.data.frame[,3]),df=n-(length(try2)+1)))*2,5)
vector <- rep(NA,length(names))
vector[is.na(try.data.frame[,4])] <- 0
maxi <- which.max(try.data.frame[,4])
continue <- max(try.data.frame[,4],na.rm=TRUE) > .05
vector[maxi] <- 0
list(summary=try.data.frame,next.vector=vector,continue=continue)
}
arimaSelect <- function(series, order=c(13,0,0), seasonal=list(order=c(2,0,0),period=12), include.mean=F){
nrc <- order[1]+order[3]+seasonal$order[1]+seasonal$order[3]
coeff <- matrix(NA, nrow=nrc*2, ncol=nrc)
pval <- matrix(NA, nrow=nrc*2, ncol=nrc)
mylist <- rep(list(NULL), nrc)
names <- NULL
if(order[1] > 0) names <- paste('ar',1:order[1],sep='')
if(order[3] > 0) names <- c( names , paste('ma',1:order[3],sep='') )
if(seasonal$order[1] > 0) names <- c(names, paste('sar',1:seasonal$order[1],sep=''))
if(seasonal$order[3] > 0) names <- c(names, paste('sma',1:seasonal$order[3],sep=''))
arima.out <- arima(series, order=order, seasonal=seasonal, include.mean=include.mean, method='ML')
mylist[[1]] <- arima.out
last.arma <- armaGR(arima.out, names, length(series))
mystop <- FALSE
i <- 1
coeff[i,] <- last.arma[[1]][,1]
pval [i,] <- last.arma[[1]][,4]
i <- 2
aic <- arima.out$aic
while(!mystop){
mylist[[i]] <- arima.out
arima.out <- arima(series, order=order, seasonal=seasonal, include.mean=include.mean, method='ML', fixed=last.arma$next.vector)
aic <- c(aic, arima.out$aic)
last.arma <- armaGR(arima.out, names, length(series))
mystop <- !last.arma$continue
coeff[i,] <- last.arma[[1]][,1]
pval [i,] <- last.arma[[1]][,4]
i <- i+1
}
list(coeff, pval, mylist, aic=aic)
}
arimaSelectplot <- function(arimaSelect.out,noms,choix){
noms <- names(arimaSelect.out[[3]][[1]]$coef)
coeff <- arimaSelect.out[[1]]
k <- min(which(is.na(coeff[,1])))-1
coeff <- coeff[1:k,]
pval <- arimaSelect.out[[2]][1:k,]
aic <- arimaSelect.out$aic[1:k]
coeff[coeff==0] <- NA
n <- ncol(coeff)
if(missing(choix)) choix <- k
layout(matrix(c(1,1,1,2,
3,3,3,2,
3,3,3,4,
5,6,7,7),nr=4),
widths=c(10,35,45,15),
heights=c(30,30,15,15))
couleurs <- rainbow(75)[1:50]#(50)
ticks <- pretty(coeff)
par(mar=c(1,1,3,1))
plot(aic,k:1-.5,type='o',pch=21,bg='blue',cex=2,axes=F,lty=2,xpd=NA)
points(aic[choix],k-choix+.5,pch=21,cex=4,bg=2,xpd=NA)
title('aic',line=2)
par(mar=c(3,0,0,0))
plot(0,axes=F,xlab='',ylab='',xlim=range(ticks),ylim=c(.1,1))
rect(xleft = min(ticks) + (0:49)/50*(max(ticks)-min(ticks)),
xright = min(ticks) + (1:50)/50*(max(ticks)-min(ticks)),
ytop = rep(1,50),
ybottom= rep(0,50),col=couleurs,border=NA)
axis(1,ticks)
rect(xleft=min(ticks),xright=max(ticks),ytop=1,ybottom=0)
text(mean(coeff,na.rm=T),.5,'coefficients',cex=2,font=2)
par(mar=c(1,1,3,1))
image(1:n,1:k,t(coeff[k:1,]),axes=F,col=couleurs,zlim=range(ticks))
for(i in 1:n) for(j in 1:k) if(!is.na(coeff[j,i])) {
if(pval[j,i]<.01) symb = 'green'
else if( (pval[j,i]<.05) & (pval[j,i]>=.01)) symb = 'orange'
else if( (pval[j,i]<.1) & (pval[j,i]>=.05)) symb = 'red'
else symb = 'black'
polygon(c(i+.5 ,i+.2 ,i+.5 ,i+.5),
c(k-j+0.5,k-j+0.5,k-j+0.8,k-j+0.5),
col=symb)
if(j==choix) {
rect(xleft=i-.5,
xright=i+.5,
ybottom=k-j+1.5,
ytop=k-j+.5,
lwd=4)
text(i,
k-j+1,
round(coeff[j,i],2),
cex=1.2,
font=2)
}
else{
rect(xleft=i-.5,xright=i+.5,ybottom=k-j+1.5,ytop=k-j+.5)
text(i,k-j+1,round(coeff[j,i],2),cex=1.2,font=1)
}
}
axis(3,1:n,noms)
par(mar=c(0.5,0,0,0.5))
plot(0,axes=F,xlab='',ylab='',type='n',xlim=c(0,8),ylim=c(-.2,.8))
cols <- c('green','orange','red','black')
niv <- c('0','0.01','0.05','0.1')
for(i in 0:3){
polygon(c(1+2*i ,1+2*i ,1+2*i-.5 ,1+2*i),
c(.4 ,.7 , .4 , .4),
col=cols[i+1])
text(2*i,0.5,niv[i+1],cex=1.5)
}
text(8,.5,1,cex=1.5)
text(4,0,'p-value',cex=2)
box()
residus <- arimaSelect.out[[3]][[choix]]$res
par(mar=c(1,2,4,1))
acf(residus,main='')
title('acf',line=.5)
par(mar=c(1,2,4,1))
pacf(residus,main='')
title('pacf',line=.5)
par(mar=c(2,2,4,1))
qqnorm(residus,main='')
title('qq-norm',line=.5)
qqline(residus)
residus
}
if (par2 == 0) x <- log(x)
if (par2 != 0) x <- x^par2
(selection <- arimaSelect(x, order=c(par6,par3,par7), seasonal=list(order=c(par8,par4,par9), period=par5)))
bitmap(file='test1.png')
resid <- arimaSelectplot(selection)
dev.off()
resid
bitmap(file='test2.png')
acf(resid,length(resid)/2, main='Residual Autocorrelation Function')
dev.off()
bitmap(file='test3.png')
pacf(resid,length(resid)/2, main='Residual Partial Autocorrelation Function')
dev.off()
bitmap(file='test4.png')
cpgram(resid, main='Residual Cumulative Periodogram')
dev.off()
bitmap(file='test5.png')
hist(resid, main='Residual Histogram', xlab='values of Residuals')
dev.off()
bitmap(file='test6.png')
densityplot(~resid,col='black',main='Residual Density Plot', xlab='values of Residuals')
dev.off()
bitmap(file='test7.png')
qqnorm(resid, main='Residual Normal Q-Q Plot')
qqline(resid)
dev.off()
ncols <- length(selection[[1]][1,])
nrows <- length(selection[[2]][,1])-1
load(file='createtable')
a<-table.start()
a<-table.row.start(a)
a<-table.element(a,'ARIMA Parameter Estimation and Backward Selection', ncols+1,TRUE)
a<-table.row.end(a)
a<-table.row.start(a)
a<-table.element(a,'Iteration', header=TRUE)
for (i in 1:ncols) {
a<-table.element(a,names(selection[[3]][[1]]$coef)[i],header=TRUE)
}
a<-table.row.end(a)
for (j in 1:nrows) {
a<-table.row.start(a)
mydum <- 'Estimates ('
mydum <- paste(mydum,j)
mydum <- paste(mydum,')')
a<-table.element(a,mydum, header=TRUE)
for (i in 1:ncols) {
a<-table.element(a,round(selection[[1]][j,i],4))
}
a<-table.row.end(a)
a<-table.row.start(a)
a<-table.element(a,'(p-val)', header=TRUE)
for (i in 1:ncols) {
mydum <- '('
mydum <- paste(mydum,round(selection[[2]][j,i],4),sep='')
mydum <- paste(mydum,')')
a<-table.element(a,mydum)
}
a<-table.row.end(a)
}
a<-table.end(a)
table.save(a,file='mytable.tab')
a<-table.start()
a<-table.row.start(a)
a<-table.element(a,'Estimated ARIMA Residuals', 1,TRUE)
a<-table.row.end(a)
a<-table.row.start(a)
a<-table.element(a,'Value', 1,TRUE)
a<-table.row.end(a)
for (i in (par4*par5+par3):length(resid)) {
a<-table.row.start(a)
a<-table.element(a,resid[i])
a<-table.row.end(a)
}
a<-table.end(a)
table.save(a,file='mytable1.tab')