Free Statistics

of Irreproducible Research!

Author's title

Author*Unverified author*
R Software Modulerwasp_autocorrelation.wasp
Title produced by software(Partial) Autocorrelation Function
Date of computationTue, 09 Dec 2008 11:41:47 -0700
Cite this page as followsStatistical Computations at FreeStatistics.org, Office for Research Development and Education, URL https://freestatistics.org/blog/index.php?v=date/2008/Dec/09/t1228848134yjnn5jihzcol2pw.htm/, Retrieved Fri, 17 May 2024 03:03:22 +0000
Statistical Computations at FreeStatistics.org, Office for Research Development and Education, URL https://freestatistics.org/blog/index.php?pk=31682, Retrieved Fri, 17 May 2024 03:03:22 +0000
QR Codes:

Original text written by user:
IsPrivate?No (this computation is public)
User-defined keywords
Estimated Impact207
Family? (F = Feedback message, R = changed R code, M = changed R Module, P = changed Parameters, D = changed Data)
F     [(Partial) Autocorrelation Function] [step acf] [2008-12-09 15:39:34] [74be16979710d4c4e7c6647856088456]
-   P     [(Partial) Autocorrelation Function] [step 3 acf] [2008-12-09 18:41:47] [d41d8cd98f00b204e9800998ecf8427e] [Current]
-   P       [(Partial) Autocorrelation Function] [step 2 met d=0] [2008-12-11 10:51:35] [74be16979710d4c4e7c6647856088456]
- RMP       [Spectral Analysis] [step 2 met d=0 sp...] [2008-12-11 10:50:31] [74be16979710d4c4e7c6647856088456]
-   P       [(Partial) Autocorrelation Function] [sdsdsd] [2008-12-11 11:20:34] [74be16979710d4c4e7c6647856088456]
Feedback Forum

Post a new message
Dataseries X:
105.2
91.5
75.3
60.5
80.4
84.5
93.9
78
92.3
90
72.1
76.9
76
88.7
55.4
46.6
90.9
84.9
89
90.2
72.3
83
71.6
75.4
85.1
81.2
68.7
68.4
93.7
96.6
101.8
93.6
88.9
114.1
82.3
96.4
104
88.2
85.2
87.1
85.5
89.1
105.2
82.9
86.8
112
97.4
88.9
109.4
87.8
90.5
79.3
114.9
118.8
125
96.1
116.7
119.5
104.1
121
127.3
117.7
108
89.4
137.4
142
137.3
122.8
126.1
147.6
115.7
139.2
151.2
123.8
109
112.1
136.4
135.5
138.7
137.5
141.5
143.6
146.5
200.7
196.2


Summary of computational transaction
Raw Inputview raw input (R code)
Raw Outputview raw output of R engine
Computing time2 seconds
R Server'Gwilym Jenkins' @ 72.249.127.135

\begin{tabular}{lllllllll}
\hline
Summary of computational transaction \tabularnewline
Raw Input & view raw input (R code)  \tabularnewline
Raw Output & view raw output of R engine  \tabularnewline
Computing time & 2 seconds \tabularnewline
R Server & 'Gwilym Jenkins' @ 72.249.127.135 \tabularnewline
\hline
\end{tabular}
%Source: https://freestatistics.org/blog/index.php?pk=31682&T=0

[TABLE]
[ROW][C]Summary of computational transaction[/C][/ROW]
[ROW][C]Raw Input[/C][C]view raw input (R code) [/C][/ROW]
[ROW][C]Raw Output[/C][C]view raw output of R engine [/C][/ROW]
[ROW][C]Computing time[/C][C]2 seconds[/C][/ROW]
[ROW][C]R Server[/C][C]'Gwilym Jenkins' @ 72.249.127.135[/C][/ROW]
[/TABLE]
Source: https://freestatistics.org/blog/index.php?pk=31682&T=0

Globally Unique Identifier (entire table): ba.freestatistics.org/blog/index.php?pk=31682&T=0

As an alternative you can also use a QR Code:  

The GUIDs for individual cells are displayed in the table below:

Summary of computational transaction
Raw Inputview raw input (R code)
Raw Outputview raw output of R engine
Computing time2 seconds
R Server'Gwilym Jenkins' @ 72.249.127.135


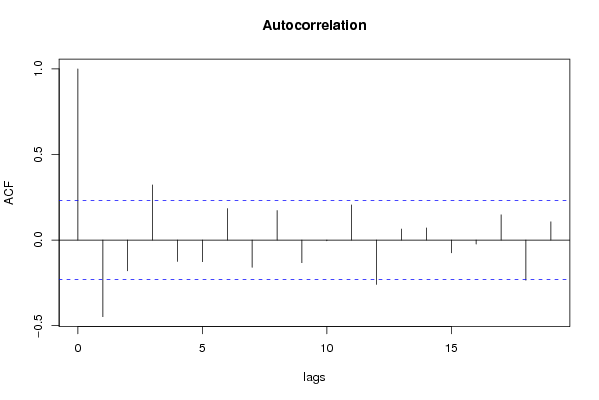
Autocorrelation Function
Time lag kACF(k)T-STATP-value
1-0.447318-3.79560.000152
2-0.17933-1.52170.066236
30.3219712.7320.003956
4-0.124937-1.06010.146316
5-0.126373-1.07230.143582
60.1841631.56270.061257
7-0.158811-1.34760.091013
80.1724691.46340.073849
9-0.132251-1.12220.132755
10-0.004065-0.03450.486289
110.2053321.74230.042863
12-0.259038-2.1980.015582
130.0647330.54930.292259
140.0710330.60270.27429
15-0.074573-0.63280.264444
16-0.023065-0.19570.422691
170.1480881.25660.106486
18-0.234233-1.98750.025334
190.1065350.9040.18451

\begin{tabular}{lllllllll}
\hline
Autocorrelation Function \tabularnewline
Time lag k & ACF(k) & T-STAT & P-value \tabularnewline
1 & -0.447318 & -3.7956 & 0.000152 \tabularnewline
2 & -0.17933 & -1.5217 & 0.066236 \tabularnewline
3 & 0.321971 & 2.732 & 0.003956 \tabularnewline
4 & -0.124937 & -1.0601 & 0.146316 \tabularnewline
5 & -0.126373 & -1.0723 & 0.143582 \tabularnewline
6 & 0.184163 & 1.5627 & 0.061257 \tabularnewline
7 & -0.158811 & -1.3476 & 0.091013 \tabularnewline
8 & 0.172469 & 1.4634 & 0.073849 \tabularnewline
9 & -0.132251 & -1.1222 & 0.132755 \tabularnewline
10 & -0.004065 & -0.0345 & 0.486289 \tabularnewline
11 & 0.205332 & 1.7423 & 0.042863 \tabularnewline
12 & -0.259038 & -2.198 & 0.015582 \tabularnewline
13 & 0.064733 & 0.5493 & 0.292259 \tabularnewline
14 & 0.071033 & 0.6027 & 0.27429 \tabularnewline
15 & -0.074573 & -0.6328 & 0.264444 \tabularnewline
16 & -0.023065 & -0.1957 & 0.422691 \tabularnewline
17 & 0.148088 & 1.2566 & 0.106486 \tabularnewline
18 & -0.234233 & -1.9875 & 0.025334 \tabularnewline
19 & 0.106535 & 0.904 & 0.18451 \tabularnewline
\hline
\end{tabular}
%Source: https://freestatistics.org/blog/index.php?pk=31682&T=1

[TABLE]
[ROW][C]Autocorrelation Function[/C][/ROW]
[ROW][C]Time lag k[/C][C]ACF(k)[/C][C]T-STAT[/C][C]P-value[/C][/ROW]
[ROW][C]1[/C][C]-0.447318[/C][C]-3.7956[/C][C]0.000152[/C][/ROW]
[ROW][C]2[/C][C]-0.17933[/C][C]-1.5217[/C][C]0.066236[/C][/ROW]
[ROW][C]3[/C][C]0.321971[/C][C]2.732[/C][C]0.003956[/C][/ROW]
[ROW][C]4[/C][C]-0.124937[/C][C]-1.0601[/C][C]0.146316[/C][/ROW]
[ROW][C]5[/C][C]-0.126373[/C][C]-1.0723[/C][C]0.143582[/C][/ROW]
[ROW][C]6[/C][C]0.184163[/C][C]1.5627[/C][C]0.061257[/C][/ROW]
[ROW][C]7[/C][C]-0.158811[/C][C]-1.3476[/C][C]0.091013[/C][/ROW]
[ROW][C]8[/C][C]0.172469[/C][C]1.4634[/C][C]0.073849[/C][/ROW]
[ROW][C]9[/C][C]-0.132251[/C][C]-1.1222[/C][C]0.132755[/C][/ROW]
[ROW][C]10[/C][C]-0.004065[/C][C]-0.0345[/C][C]0.486289[/C][/ROW]
[ROW][C]11[/C][C]0.205332[/C][C]1.7423[/C][C]0.042863[/C][/ROW]
[ROW][C]12[/C][C]-0.259038[/C][C]-2.198[/C][C]0.015582[/C][/ROW]
[ROW][C]13[/C][C]0.064733[/C][C]0.5493[/C][C]0.292259[/C][/ROW]
[ROW][C]14[/C][C]0.071033[/C][C]0.6027[/C][C]0.27429[/C][/ROW]
[ROW][C]15[/C][C]-0.074573[/C][C]-0.6328[/C][C]0.264444[/C][/ROW]
[ROW][C]16[/C][C]-0.023065[/C][C]-0.1957[/C][C]0.422691[/C][/ROW]
[ROW][C]17[/C][C]0.148088[/C][C]1.2566[/C][C]0.106486[/C][/ROW]
[ROW][C]18[/C][C]-0.234233[/C][C]-1.9875[/C][C]0.025334[/C][/ROW]
[ROW][C]19[/C][C]0.106535[/C][C]0.904[/C][C]0.18451[/C][/ROW]
[/TABLE]
Source: https://freestatistics.org/blog/index.php?pk=31682&T=1

Globally Unique Identifier (entire table): ba.freestatistics.org/blog/index.php?pk=31682&T=1

As an alternative you can also use a QR Code:  

The GUIDs for individual cells are displayed in the table below:

Autocorrelation Function
Time lag kACF(k)T-STATP-value
1-0.447318-3.79560.000152
2-0.17933-1.52170.066236
30.3219712.7320.003956
4-0.124937-1.06010.146316
5-0.126373-1.07230.143582
60.1841631.56270.061257
7-0.158811-1.34760.091013
80.1724691.46340.073849
9-0.132251-1.12220.132755
10-0.004065-0.03450.486289
110.2053321.74230.042863
12-0.259038-2.1980.015582
130.0647330.54930.292259
140.0710330.60270.27429
15-0.074573-0.63280.264444
16-0.023065-0.19570.422691
170.1480881.25660.106486
18-0.234233-1.98750.025334
190.1065350.9040.18451


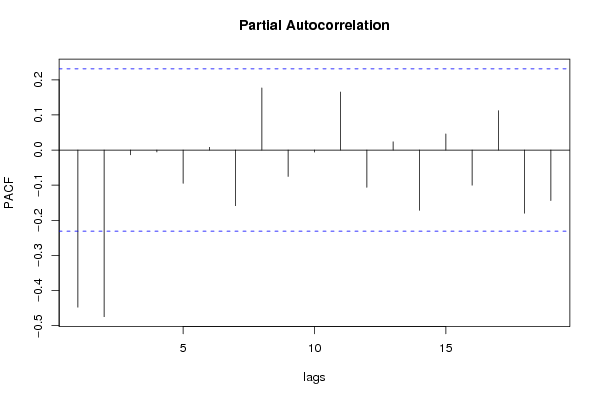
Partial Autocorrelation Function
Time lag kPACF(k)T-STATP-value
1-0.447318-3.79560.000152
2-0.474334-4.02497e-05
3-0.01367-0.1160.45399
4-0.005331-0.04520.482021
5-0.094556-0.80230.2125
60.0078250.06640.473622
7-0.15845-1.34450.091505
80.1769071.50110.06885
9-0.07507-0.6370.263075
10-0.005548-0.04710.481293
110.1653211.40280.082487
12-0.106113-0.90040.185455
130.0234590.19910.421391
14-0.171604-1.45610.074854
150.0459090.38960.349009
16-0.099898-0.84770.199718
170.1122820.95270.171954
18-0.179572-1.52370.065979
19-0.143856-1.22070.113099

\begin{tabular}{lllllllll}
\hline
Partial Autocorrelation Function \tabularnewline
Time lag k & PACF(k) & T-STAT & P-value \tabularnewline
1 & -0.447318 & -3.7956 & 0.000152 \tabularnewline
2 & -0.474334 & -4.0249 & 7e-05 \tabularnewline
3 & -0.01367 & -0.116 & 0.45399 \tabularnewline
4 & -0.005331 & -0.0452 & 0.482021 \tabularnewline
5 & -0.094556 & -0.8023 & 0.2125 \tabularnewline
6 & 0.007825 & 0.0664 & 0.473622 \tabularnewline
7 & -0.15845 & -1.3445 & 0.091505 \tabularnewline
8 & 0.176907 & 1.5011 & 0.06885 \tabularnewline
9 & -0.07507 & -0.637 & 0.263075 \tabularnewline
10 & -0.005548 & -0.0471 & 0.481293 \tabularnewline
11 & 0.165321 & 1.4028 & 0.082487 \tabularnewline
12 & -0.106113 & -0.9004 & 0.185455 \tabularnewline
13 & 0.023459 & 0.1991 & 0.421391 \tabularnewline
14 & -0.171604 & -1.4561 & 0.074854 \tabularnewline
15 & 0.045909 & 0.3896 & 0.349009 \tabularnewline
16 & -0.099898 & -0.8477 & 0.199718 \tabularnewline
17 & 0.112282 & 0.9527 & 0.171954 \tabularnewline
18 & -0.179572 & -1.5237 & 0.065979 \tabularnewline
19 & -0.143856 & -1.2207 & 0.113099 \tabularnewline
\hline
\end{tabular}
%Source: https://freestatistics.org/blog/index.php?pk=31682&T=2

[TABLE]
[ROW][C]Partial Autocorrelation Function[/C][/ROW]
[ROW][C]Time lag k[/C][C]PACF(k)[/C][C]T-STAT[/C][C]P-value[/C][/ROW]
[ROW][C]1[/C][C]-0.447318[/C][C]-3.7956[/C][C]0.000152[/C][/ROW]
[ROW][C]2[/C][C]-0.474334[/C][C]-4.0249[/C][C]7e-05[/C][/ROW]
[ROW][C]3[/C][C]-0.01367[/C][C]-0.116[/C][C]0.45399[/C][/ROW]
[ROW][C]4[/C][C]-0.005331[/C][C]-0.0452[/C][C]0.482021[/C][/ROW]
[ROW][C]5[/C][C]-0.094556[/C][C]-0.8023[/C][C]0.2125[/C][/ROW]
[ROW][C]6[/C][C]0.007825[/C][C]0.0664[/C][C]0.473622[/C][/ROW]
[ROW][C]7[/C][C]-0.15845[/C][C]-1.3445[/C][C]0.091505[/C][/ROW]
[ROW][C]8[/C][C]0.176907[/C][C]1.5011[/C][C]0.06885[/C][/ROW]
[ROW][C]9[/C][C]-0.07507[/C][C]-0.637[/C][C]0.263075[/C][/ROW]
[ROW][C]10[/C][C]-0.005548[/C][C]-0.0471[/C][C]0.481293[/C][/ROW]
[ROW][C]11[/C][C]0.165321[/C][C]1.4028[/C][C]0.082487[/C][/ROW]
[ROW][C]12[/C][C]-0.106113[/C][C]-0.9004[/C][C]0.185455[/C][/ROW]
[ROW][C]13[/C][C]0.023459[/C][C]0.1991[/C][C]0.421391[/C][/ROW]
[ROW][C]14[/C][C]-0.171604[/C][C]-1.4561[/C][C]0.074854[/C][/ROW]
[ROW][C]15[/C][C]0.045909[/C][C]0.3896[/C][C]0.349009[/C][/ROW]
[ROW][C]16[/C][C]-0.099898[/C][C]-0.8477[/C][C]0.199718[/C][/ROW]
[ROW][C]17[/C][C]0.112282[/C][C]0.9527[/C][C]0.171954[/C][/ROW]
[ROW][C]18[/C][C]-0.179572[/C][C]-1.5237[/C][C]0.065979[/C][/ROW]
[ROW][C]19[/C][C]-0.143856[/C][C]-1.2207[/C][C]0.113099[/C][/ROW]
[/TABLE]
Source: https://freestatistics.org/blog/index.php?pk=31682&T=2

Globally Unique Identifier (entire table): ba.freestatistics.org/blog/index.php?pk=31682&T=2

As an alternative you can also use a QR Code:  

The GUIDs for individual cells are displayed in the table below:

Partial Autocorrelation Function
Time lag kPACF(k)T-STATP-value
1-0.447318-3.79560.000152
2-0.474334-4.02497e-05
3-0.01367-0.1160.45399
4-0.005331-0.04520.482021
5-0.094556-0.80230.2125
60.0078250.06640.473622
7-0.15845-1.34450.091505
80.1769071.50110.06885
9-0.07507-0.6370.263075
10-0.005548-0.04710.481293
110.1653211.40280.082487
12-0.106113-0.90040.185455
130.0234590.19910.421391
14-0.171604-1.45610.074854
150.0459090.38960.349009
16-0.099898-0.84770.199718
170.1122820.95270.171954
18-0.179572-1.52370.065979
19-0.143856-1.22070.113099


Parameters (Session):
par1 = Default ; par2 = 0.0 ; par3 = 1 ; par4 = 1 ; par5 = 12 ;
Parameters (R input):
par1 = Default ; par2 = 0.0 ; par3 = 1 ; par4 = 1 ; par5 = 12 ;
R code (references can be found in the software module):
if (par1 == 'Default') {
par1 = 10*log10(length(x))
} else {
par1 <- as.numeric(par1)
}
par2 <- as.numeric(par2)
par3 <- as.numeric(par3)
par4 <- as.numeric(par4)
par5 <- as.numeric(par5)
if (par2 == 0) {
x <- log(x)
} else {
x <- (x ^ par2 - 1) / par2
}
if (par3 > 0) x <- diff(x,lag=1,difference=par3)
if (par4 > 0) x <- diff(x,lag=par5,difference=par4)
bitmap(file='pic1.png')
racf <- acf(x,par1,main='Autocorrelation',xlab='lags',ylab='ACF')
dev.off()
bitmap(file='pic2.png')
rpacf <- pacf(x,par1,main='Partial Autocorrelation',xlab='lags',ylab='PACF')
dev.off()
(myacf <- c(racf$acf))
(mypacf <- c(rpacf$acf))
lengthx <- length(x)
sqrtn <- sqrt(lengthx)
load(file='createtable')
a<-table.start()
a<-table.row.start(a)
a<-table.element(a,'Autocorrelation Function',4,TRUE)
a<-table.row.end(a)
a<-table.row.start(a)
a<-table.element(a,'Time lag k',header=TRUE)
a<-table.element(a,hyperlink('basics.htm','ACF(k)','click here for more information about the Autocorrelation Function'),header=TRUE)
a<-table.element(a,'T-STAT',header=TRUE)
a<-table.element(a,'P-value',header=TRUE)
a<-table.row.end(a)
for (i in 2:(par1+1)) {
a<-table.row.start(a)
a<-table.element(a,i-1,header=TRUE)
a<-table.element(a,round(myacf[i],6))
mytstat <- myacf[i]*sqrtn
a<-table.element(a,round(mytstat,4))
a<-table.element(a,round(1-pt(abs(mytstat),lengthx),6))
a<-table.row.end(a)
}
a<-table.end(a)
table.save(a,file='mytable.tab')
a<-table.start()
a<-table.row.start(a)
a<-table.element(a,'Partial Autocorrelation Function',4,TRUE)
a<-table.row.end(a)
a<-table.row.start(a)
a<-table.element(a,'Time lag k',header=TRUE)
a<-table.element(a,hyperlink('basics.htm','PACF(k)','click here for more information about the Partial Autocorrelation Function'),header=TRUE)
a<-table.element(a,'T-STAT',header=TRUE)
a<-table.element(a,'P-value',header=TRUE)
a<-table.row.end(a)
for (i in 1:par1) {
a<-table.row.start(a)
a<-table.element(a,i,header=TRUE)
a<-table.element(a,round(mypacf[i],6))
mytstat <- mypacf[i]*sqrtn
a<-table.element(a,round(mytstat,4))
a<-table.element(a,round(1-pt(abs(mytstat),lengthx),6))
a<-table.row.end(a)
}
a<-table.end(a)
table.save(a,file='mytable1.tab')