Free Statistics

of Irreproducible Research!

Author's title

Author*Unverified author*
R Software Modulerwasp_autocorrelation.wasp
Title produced by software(Partial) Autocorrelation Function
Date of computationTue, 09 Dec 2008 11:37:03 -0700
Cite this page as followsStatistical Computations at FreeStatistics.org, Office for Research Development and Education, URL https://freestatistics.org/blog/index.php?v=date/2008/Dec/09/t1228847855k2ecoq19m4ej09q.htm/, Retrieved Fri, 17 May 2024 03:41:14 +0000
Statistical Computations at FreeStatistics.org, Office for Research Development and Education, URL https://freestatistics.org/blog/index.php?pk=31678, Retrieved Fri, 17 May 2024 03:41:14 +0000
QR Codes:

Original text written by user:
IsPrivate?No (this computation is public)
User-defined keywords
Estimated Impact170
Family? (F = Feedback message, R = changed R code, M = changed R Module, P = changed Parameters, D = changed Data)
-     [Univariate Data Series] [data set] [2008-12-01 19:54:57] [b98453cac15ba1066b407e146608df68]
F RMP   [Standard Deviation-Mean Plot] [step 1] [2008-12-06 15:53:54] [74be16979710d4c4e7c6647856088456]
F RMPD      [(Partial) Autocorrelation Function] [step 2] [2008-12-09 18:37:03] [d41d8cd98f00b204e9800998ecf8427e] [Current]
Feedback Forum
2008-12-16 18:02:14 [6066575aa30c0611e452e930b1dff53d] [reply
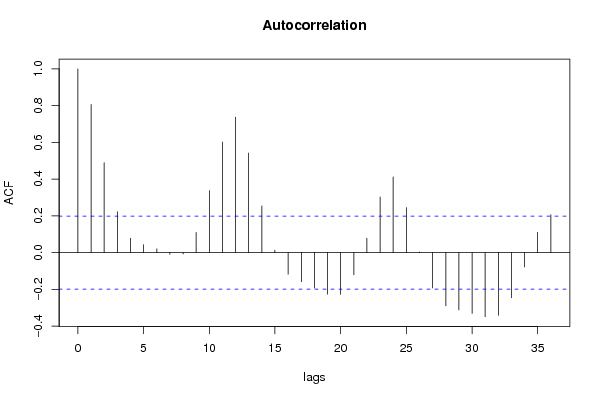
We zien inderdaad een piek op maand 12, 24 en 36. Deze hebben een dalend patroon. Het zal dus inderdaad nodig zijn om seizoenaal te differentiëren. We vermoeden een lange termijn trend, maar dit is niet zeker.

Post a new message
Dataseries X:
113438
109416
109406
105645
101328
97686
93093
91382
122257
139183
139887
131822
116805
113706
113012
110452
107005
102841
98173
98181
137277
147579
146571
138920
130340
128140
127059
122860
117702
113537
108366
111078
150739
159129
157928
147768
137507
136919
136151
133001
125554
119647
114158
116193
152803
161761
160942
149470
139208
134588
130322
126611
122401
117352
112135
112879
148729
157230
157221
146681
136524
132111
125326
122716
116615
113719
110737
112093
143565
149946
149147
134339
122683
115614
116566
111272
104609
101802
94542
93051
124129
130374
123946
114971
105531
104919
104782
101281
94545
93248
84031
87486
115867
120327
117008
108811
104519


Summary of computational transaction
Raw Inputview raw input (R code)
Raw Outputview raw output of R engine
Computing time3 seconds
R Server'Herman Ole Andreas Wold' @ 193.190.124.10:1001

\begin{tabular}{lllllllll}
\hline
Summary of computational transaction \tabularnewline
Raw Input & view raw input (R code)  \tabularnewline
Raw Output & view raw output of R engine  \tabularnewline
Computing time & 3 seconds \tabularnewline
R Server & 'Herman Ole Andreas Wold' @ 193.190.124.10:1001 \tabularnewline
\hline
\end{tabular}
%Source: https://freestatistics.org/blog/index.php?pk=31678&T=0

[TABLE]
[ROW][C]Summary of computational transaction[/C][/ROW]
[ROW][C]Raw Input[/C][C]view raw input (R code) [/C][/ROW]
[ROW][C]Raw Output[/C][C]view raw output of R engine [/C][/ROW]
[ROW][C]Computing time[/C][C]3 seconds[/C][/ROW]
[ROW][C]R Server[/C][C]'Herman Ole Andreas Wold' @ 193.190.124.10:1001[/C][/ROW]
[/TABLE]
Source: https://freestatistics.org/blog/index.php?pk=31678&T=0

Globally Unique Identifier (entire table): ba.freestatistics.org/blog/index.php?pk=31678&T=0

As an alternative you can also use a QR Code:  

The GUIDs for individual cells are displayed in the table below:

Summary of computational transaction
Raw Inputview raw input (R code)
Raw Outputview raw output of R engine
Computing time3 seconds
R Server'Herman Ole Andreas Wold' @ 193.190.124.10:1001


Autocorrelation Function
Time lag kACF(k)T-STATP-value
10.8067087.94520
20.4898254.82423e-06
30.2226692.1930.015348
40.0783610.77180.221065
50.0434110.42760.334963
60.0208860.20570.418728
7-0.009156-0.09020.464166
8-0.007117-0.07010.47213
90.1095571.0790.14163
100.3377883.32680.000621
110.6016925.9260
120.7372547.26110
130.5422825.34090
140.2540932.50250.007002
150.0123790.12190.451606
16-0.117879-1.1610.124252
17-0.158641-1.56240.060721
18-0.192772-1.89860.030296
19-0.226743-2.23320.013918
20-0.226904-2.23470.013864
21-0.121084-1.19250.117979
220.0786660.77480.22018
230.3025882.98010.001821
240.4122024.05975e-05
250.2454862.41780.008742
260.0038660.03810.484852
27-0.192469-1.89560.030495
28-0.289439-2.85060.002665
29-0.312119-3.0740.001371
30-0.331073-3.26070.000767
31-0.348731-3.43460.000437
32-0.341302-3.36140.000555
33-0.245857-2.42140.00866
34-0.077961-0.76780.222229
350.1103941.08730.139809
360.2061722.03060.022519

\begin{tabular}{lllllllll}
\hline
Autocorrelation Function \tabularnewline
Time lag k & ACF(k) & T-STAT & P-value \tabularnewline
1 & 0.806708 & 7.9452 & 0 \tabularnewline
2 & 0.489825 & 4.8242 & 3e-06 \tabularnewline
3 & 0.222669 & 2.193 & 0.015348 \tabularnewline
4 & 0.078361 & 0.7718 & 0.221065 \tabularnewline
5 & 0.043411 & 0.4276 & 0.334963 \tabularnewline
6 & 0.020886 & 0.2057 & 0.418728 \tabularnewline
7 & -0.009156 & -0.0902 & 0.464166 \tabularnewline
8 & -0.007117 & -0.0701 & 0.47213 \tabularnewline
9 & 0.109557 & 1.079 & 0.14163 \tabularnewline
10 & 0.337788 & 3.3268 & 0.000621 \tabularnewline
11 & 0.601692 & 5.926 & 0 \tabularnewline
12 & 0.737254 & 7.2611 & 0 \tabularnewline
13 & 0.542282 & 5.3409 & 0 \tabularnewline
14 & 0.254093 & 2.5025 & 0.007002 \tabularnewline
15 & 0.012379 & 0.1219 & 0.451606 \tabularnewline
16 & -0.117879 & -1.161 & 0.124252 \tabularnewline
17 & -0.158641 & -1.5624 & 0.060721 \tabularnewline
18 & -0.192772 & -1.8986 & 0.030296 \tabularnewline
19 & -0.226743 & -2.2332 & 0.013918 \tabularnewline
20 & -0.226904 & -2.2347 & 0.013864 \tabularnewline
21 & -0.121084 & -1.1925 & 0.117979 \tabularnewline
22 & 0.078666 & 0.7748 & 0.22018 \tabularnewline
23 & 0.302588 & 2.9801 & 0.001821 \tabularnewline
24 & 0.412202 & 4.0597 & 5e-05 \tabularnewline
25 & 0.245486 & 2.4178 & 0.008742 \tabularnewline
26 & 0.003866 & 0.0381 & 0.484852 \tabularnewline
27 & -0.192469 & -1.8956 & 0.030495 \tabularnewline
28 & -0.289439 & -2.8506 & 0.002665 \tabularnewline
29 & -0.312119 & -3.074 & 0.001371 \tabularnewline
30 & -0.331073 & -3.2607 & 0.000767 \tabularnewline
31 & -0.348731 & -3.4346 & 0.000437 \tabularnewline
32 & -0.341302 & -3.3614 & 0.000555 \tabularnewline
33 & -0.245857 & -2.4214 & 0.00866 \tabularnewline
34 & -0.077961 & -0.7678 & 0.222229 \tabularnewline
35 & 0.110394 & 1.0873 & 0.139809 \tabularnewline
36 & 0.206172 & 2.0306 & 0.022519 \tabularnewline
\hline
\end{tabular}
%Source: https://freestatistics.org/blog/index.php?pk=31678&T=1

[TABLE]
[ROW][C]Autocorrelation Function[/C][/ROW]
[ROW][C]Time lag k[/C][C]ACF(k)[/C][C]T-STAT[/C][C]P-value[/C][/ROW]
[ROW][C]1[/C][C]0.806708[/C][C]7.9452[/C][C]0[/C][/ROW]
[ROW][C]2[/C][C]0.489825[/C][C]4.8242[/C][C]3e-06[/C][/ROW]
[ROW][C]3[/C][C]0.222669[/C][C]2.193[/C][C]0.015348[/C][/ROW]
[ROW][C]4[/C][C]0.078361[/C][C]0.7718[/C][C]0.221065[/C][/ROW]
[ROW][C]5[/C][C]0.043411[/C][C]0.4276[/C][C]0.334963[/C][/ROW]
[ROW][C]6[/C][C]0.020886[/C][C]0.2057[/C][C]0.418728[/C][/ROW]
[ROW][C]7[/C][C]-0.009156[/C][C]-0.0902[/C][C]0.464166[/C][/ROW]
[ROW][C]8[/C][C]-0.007117[/C][C]-0.0701[/C][C]0.47213[/C][/ROW]
[ROW][C]9[/C][C]0.109557[/C][C]1.079[/C][C]0.14163[/C][/ROW]
[ROW][C]10[/C][C]0.337788[/C][C]3.3268[/C][C]0.000621[/C][/ROW]
[ROW][C]11[/C][C]0.601692[/C][C]5.926[/C][C]0[/C][/ROW]
[ROW][C]12[/C][C]0.737254[/C][C]7.2611[/C][C]0[/C][/ROW]
[ROW][C]13[/C][C]0.542282[/C][C]5.3409[/C][C]0[/C][/ROW]
[ROW][C]14[/C][C]0.254093[/C][C]2.5025[/C][C]0.007002[/C][/ROW]
[ROW][C]15[/C][C]0.012379[/C][C]0.1219[/C][C]0.451606[/C][/ROW]
[ROW][C]16[/C][C]-0.117879[/C][C]-1.161[/C][C]0.124252[/C][/ROW]
[ROW][C]17[/C][C]-0.158641[/C][C]-1.5624[/C][C]0.060721[/C][/ROW]
[ROW][C]18[/C][C]-0.192772[/C][C]-1.8986[/C][C]0.030296[/C][/ROW]
[ROW][C]19[/C][C]-0.226743[/C][C]-2.2332[/C][C]0.013918[/C][/ROW]
[ROW][C]20[/C][C]-0.226904[/C][C]-2.2347[/C][C]0.013864[/C][/ROW]
[ROW][C]21[/C][C]-0.121084[/C][C]-1.1925[/C][C]0.117979[/C][/ROW]
[ROW][C]22[/C][C]0.078666[/C][C]0.7748[/C][C]0.22018[/C][/ROW]
[ROW][C]23[/C][C]0.302588[/C][C]2.9801[/C][C]0.001821[/C][/ROW]
[ROW][C]24[/C][C]0.412202[/C][C]4.0597[/C][C]5e-05[/C][/ROW]
[ROW][C]25[/C][C]0.245486[/C][C]2.4178[/C][C]0.008742[/C][/ROW]
[ROW][C]26[/C][C]0.003866[/C][C]0.0381[/C][C]0.484852[/C][/ROW]
[ROW][C]27[/C][C]-0.192469[/C][C]-1.8956[/C][C]0.030495[/C][/ROW]
[ROW][C]28[/C][C]-0.289439[/C][C]-2.8506[/C][C]0.002665[/C][/ROW]
[ROW][C]29[/C][C]-0.312119[/C][C]-3.074[/C][C]0.001371[/C][/ROW]
[ROW][C]30[/C][C]-0.331073[/C][C]-3.2607[/C][C]0.000767[/C][/ROW]
[ROW][C]31[/C][C]-0.348731[/C][C]-3.4346[/C][C]0.000437[/C][/ROW]
[ROW][C]32[/C][C]-0.341302[/C][C]-3.3614[/C][C]0.000555[/C][/ROW]
[ROW][C]33[/C][C]-0.245857[/C][C]-2.4214[/C][C]0.00866[/C][/ROW]
[ROW][C]34[/C][C]-0.077961[/C][C]-0.7678[/C][C]0.222229[/C][/ROW]
[ROW][C]35[/C][C]0.110394[/C][C]1.0873[/C][C]0.139809[/C][/ROW]
[ROW][C]36[/C][C]0.206172[/C][C]2.0306[/C][C]0.022519[/C][/ROW]
[/TABLE]
Source: https://freestatistics.org/blog/index.php?pk=31678&T=1

Globally Unique Identifier (entire table): ba.freestatistics.org/blog/index.php?pk=31678&T=1

As an alternative you can also use a QR Code:  

The GUIDs for individual cells are displayed in the table below:

Autocorrelation Function
Time lag kACF(k)T-STATP-value
10.8067087.94520
20.4898254.82423e-06
30.2226692.1930.015348
40.0783610.77180.221065
50.0434110.42760.334963
60.0208860.20570.418728
7-0.009156-0.09020.464166
8-0.007117-0.07010.47213
90.1095571.0790.14163
100.3377883.32680.000621
110.6016925.9260
120.7372547.26110
130.5422825.34090
140.2540932.50250.007002
150.0123790.12190.451606
16-0.117879-1.1610.124252
17-0.158641-1.56240.060721
18-0.192772-1.89860.030296
19-0.226743-2.23320.013918
20-0.226904-2.23470.013864
21-0.121084-1.19250.117979
220.0786660.77480.22018
230.3025882.98010.001821
240.4122024.05975e-05
250.2454862.41780.008742
260.0038660.03810.484852
27-0.192469-1.89560.030495
28-0.289439-2.85060.002665
29-0.312119-3.0740.001371
30-0.331073-3.26070.000767
31-0.348731-3.43460.000437
32-0.341302-3.36140.000555
33-0.245857-2.42140.00866
34-0.077961-0.76780.222229
350.1103941.08730.139809
360.2061722.03060.022519


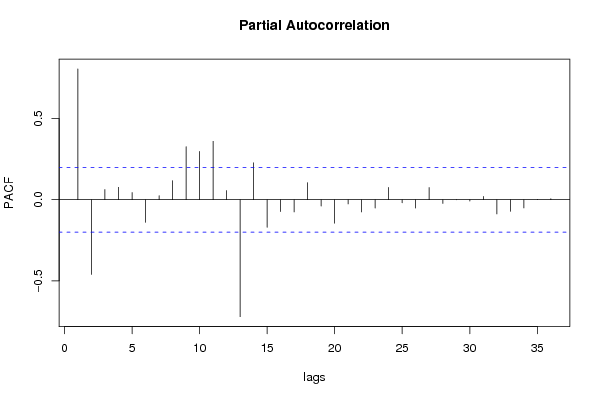
Partial Autocorrelation Function
Time lag kPACF(k)T-STATP-value
10.8067087.94520
2-0.460892-4.53938e-06
30.0625670.61620.2696
40.0763720.75220.226884
50.0442010.43530.332145
6-0.139316-1.37210.086597
70.0248230.24450.403688
80.1174221.15650.125164
90.3275483.2260.000856
100.2980012.9350.002082
110.3607463.55290.000295
120.0569070.56050.288226
13-0.721107-7.10210
140.2278062.24360.013565
15-0.170289-1.67720.048366
16-0.073266-0.72160.236144
17-0.075546-0.7440.229325
180.1050091.03420.151803
19-0.038695-0.38110.351981
20-0.14437-1.42190.079134
21-0.026285-0.25890.398138
22-0.075358-0.74220.229882
23-0.051145-0.50370.3078
240.0761840.75030.227436
25-0.018659-0.18380.427291
26-0.051002-0.50230.308294
270.0752940.74160.230073
28-0.022863-0.22520.411157
29-0.000658-0.00650.497419
30-0.008472-0.08340.466838
310.020180.19880.421435
32-0.087831-0.8650.194578
33-0.071595-0.70510.24121
34-0.050881-0.50110.308713
350.0018880.01860.492602
360.0067220.06620.473674

\begin{tabular}{lllllllll}
\hline
Partial Autocorrelation Function \tabularnewline
Time lag k & PACF(k) & T-STAT & P-value \tabularnewline
1 & 0.806708 & 7.9452 & 0 \tabularnewline
2 & -0.460892 & -4.5393 & 8e-06 \tabularnewline
3 & 0.062567 & 0.6162 & 0.2696 \tabularnewline
4 & 0.076372 & 0.7522 & 0.226884 \tabularnewline
5 & 0.044201 & 0.4353 & 0.332145 \tabularnewline
6 & -0.139316 & -1.3721 & 0.086597 \tabularnewline
7 & 0.024823 & 0.2445 & 0.403688 \tabularnewline
8 & 0.117422 & 1.1565 & 0.125164 \tabularnewline
9 & 0.327548 & 3.226 & 0.000856 \tabularnewline
10 & 0.298001 & 2.935 & 0.002082 \tabularnewline
11 & 0.360746 & 3.5529 & 0.000295 \tabularnewline
12 & 0.056907 & 0.5605 & 0.288226 \tabularnewline
13 & -0.721107 & -7.1021 & 0 \tabularnewline
14 & 0.227806 & 2.2436 & 0.013565 \tabularnewline
15 & -0.170289 & -1.6772 & 0.048366 \tabularnewline
16 & -0.073266 & -0.7216 & 0.236144 \tabularnewline
17 & -0.075546 & -0.744 & 0.229325 \tabularnewline
18 & 0.105009 & 1.0342 & 0.151803 \tabularnewline
19 & -0.038695 & -0.3811 & 0.351981 \tabularnewline
20 & -0.14437 & -1.4219 & 0.079134 \tabularnewline
21 & -0.026285 & -0.2589 & 0.398138 \tabularnewline
22 & -0.075358 & -0.7422 & 0.229882 \tabularnewline
23 & -0.051145 & -0.5037 & 0.3078 \tabularnewline
24 & 0.076184 & 0.7503 & 0.227436 \tabularnewline
25 & -0.018659 & -0.1838 & 0.427291 \tabularnewline
26 & -0.051002 & -0.5023 & 0.308294 \tabularnewline
27 & 0.075294 & 0.7416 & 0.230073 \tabularnewline
28 & -0.022863 & -0.2252 & 0.411157 \tabularnewline
29 & -0.000658 & -0.0065 & 0.497419 \tabularnewline
30 & -0.008472 & -0.0834 & 0.466838 \tabularnewline
31 & 0.02018 & 0.1988 & 0.421435 \tabularnewline
32 & -0.087831 & -0.865 & 0.194578 \tabularnewline
33 & -0.071595 & -0.7051 & 0.24121 \tabularnewline
34 & -0.050881 & -0.5011 & 0.308713 \tabularnewline
35 & 0.001888 & 0.0186 & 0.492602 \tabularnewline
36 & 0.006722 & 0.0662 & 0.473674 \tabularnewline
\hline
\end{tabular}
%Source: https://freestatistics.org/blog/index.php?pk=31678&T=2

[TABLE]
[ROW][C]Partial Autocorrelation Function[/C][/ROW]
[ROW][C]Time lag k[/C][C]PACF(k)[/C][C]T-STAT[/C][C]P-value[/C][/ROW]
[ROW][C]1[/C][C]0.806708[/C][C]7.9452[/C][C]0[/C][/ROW]
[ROW][C]2[/C][C]-0.460892[/C][C]-4.5393[/C][C]8e-06[/C][/ROW]
[ROW][C]3[/C][C]0.062567[/C][C]0.6162[/C][C]0.2696[/C][/ROW]
[ROW][C]4[/C][C]0.076372[/C][C]0.7522[/C][C]0.226884[/C][/ROW]
[ROW][C]5[/C][C]0.044201[/C][C]0.4353[/C][C]0.332145[/C][/ROW]
[ROW][C]6[/C][C]-0.139316[/C][C]-1.3721[/C][C]0.086597[/C][/ROW]
[ROW][C]7[/C][C]0.024823[/C][C]0.2445[/C][C]0.403688[/C][/ROW]
[ROW][C]8[/C][C]0.117422[/C][C]1.1565[/C][C]0.125164[/C][/ROW]
[ROW][C]9[/C][C]0.327548[/C][C]3.226[/C][C]0.000856[/C][/ROW]
[ROW][C]10[/C][C]0.298001[/C][C]2.935[/C][C]0.002082[/C][/ROW]
[ROW][C]11[/C][C]0.360746[/C][C]3.5529[/C][C]0.000295[/C][/ROW]
[ROW][C]12[/C][C]0.056907[/C][C]0.5605[/C][C]0.288226[/C][/ROW]
[ROW][C]13[/C][C]-0.721107[/C][C]-7.1021[/C][C]0[/C][/ROW]
[ROW][C]14[/C][C]0.227806[/C][C]2.2436[/C][C]0.013565[/C][/ROW]
[ROW][C]15[/C][C]-0.170289[/C][C]-1.6772[/C][C]0.048366[/C][/ROW]
[ROW][C]16[/C][C]-0.073266[/C][C]-0.7216[/C][C]0.236144[/C][/ROW]
[ROW][C]17[/C][C]-0.075546[/C][C]-0.744[/C][C]0.229325[/C][/ROW]
[ROW][C]18[/C][C]0.105009[/C][C]1.0342[/C][C]0.151803[/C][/ROW]
[ROW][C]19[/C][C]-0.038695[/C][C]-0.3811[/C][C]0.351981[/C][/ROW]
[ROW][C]20[/C][C]-0.14437[/C][C]-1.4219[/C][C]0.079134[/C][/ROW]
[ROW][C]21[/C][C]-0.026285[/C][C]-0.2589[/C][C]0.398138[/C][/ROW]
[ROW][C]22[/C][C]-0.075358[/C][C]-0.7422[/C][C]0.229882[/C][/ROW]
[ROW][C]23[/C][C]-0.051145[/C][C]-0.5037[/C][C]0.3078[/C][/ROW]
[ROW][C]24[/C][C]0.076184[/C][C]0.7503[/C][C]0.227436[/C][/ROW]
[ROW][C]25[/C][C]-0.018659[/C][C]-0.1838[/C][C]0.427291[/C][/ROW]
[ROW][C]26[/C][C]-0.051002[/C][C]-0.5023[/C][C]0.308294[/C][/ROW]
[ROW][C]27[/C][C]0.075294[/C][C]0.7416[/C][C]0.230073[/C][/ROW]
[ROW][C]28[/C][C]-0.022863[/C][C]-0.2252[/C][C]0.411157[/C][/ROW]
[ROW][C]29[/C][C]-0.000658[/C][C]-0.0065[/C][C]0.497419[/C][/ROW]
[ROW][C]30[/C][C]-0.008472[/C][C]-0.0834[/C][C]0.466838[/C][/ROW]
[ROW][C]31[/C][C]0.02018[/C][C]0.1988[/C][C]0.421435[/C][/ROW]
[ROW][C]32[/C][C]-0.087831[/C][C]-0.865[/C][C]0.194578[/C][/ROW]
[ROW][C]33[/C][C]-0.071595[/C][C]-0.7051[/C][C]0.24121[/C][/ROW]
[ROW][C]34[/C][C]-0.050881[/C][C]-0.5011[/C][C]0.308713[/C][/ROW]
[ROW][C]35[/C][C]0.001888[/C][C]0.0186[/C][C]0.492602[/C][/ROW]
[ROW][C]36[/C][C]0.006722[/C][C]0.0662[/C][C]0.473674[/C][/ROW]
[/TABLE]
Source: https://freestatistics.org/blog/index.php?pk=31678&T=2

Globally Unique Identifier (entire table): ba.freestatistics.org/blog/index.php?pk=31678&T=2

As an alternative you can also use a QR Code:  

The GUIDs for individual cells are displayed in the table below:

Partial Autocorrelation Function
Time lag kPACF(k)T-STATP-value
10.8067087.94520
2-0.460892-4.53938e-06
30.0625670.61620.2696
40.0763720.75220.226884
50.0442010.43530.332145
6-0.139316-1.37210.086597
70.0248230.24450.403688
80.1174221.15650.125164
90.3275483.2260.000856
100.2980012.9350.002082
110.3607463.55290.000295
120.0569070.56050.288226
13-0.721107-7.10210
140.2278062.24360.013565
15-0.170289-1.67720.048366
16-0.073266-0.72160.236144
17-0.075546-0.7440.229325
180.1050091.03420.151803
19-0.038695-0.38110.351981
20-0.14437-1.42190.079134
21-0.026285-0.25890.398138
22-0.075358-0.74220.229882
23-0.051145-0.50370.3078
240.0761840.75030.227436
25-0.018659-0.18380.427291
26-0.051002-0.50230.308294
270.0752940.74160.230073
28-0.022863-0.22520.411157
29-0.000658-0.00650.497419
30-0.008472-0.08340.466838
310.020180.19880.421435
32-0.087831-0.8650.194578
33-0.071595-0.70510.24121
34-0.050881-0.50110.308713
350.0018880.01860.492602
360.0067220.06620.473674


Parameters (Session):
par1 = 36 ; par2 = 1 ; par3 = 0 ; par4 = 0 ; par5 = 12 ;
Parameters (R input):
par1 = 36 ; par2 = 1 ; par3 = 0 ; par4 = 0 ; par5 = 12 ;
R code (references can be found in the software module):
if (par1 == 'Default') {
par1 = 10*log10(length(x))
} else {
par1 <- as.numeric(par1)
}
par2 <- as.numeric(par2)
par3 <- as.numeric(par3)
par4 <- as.numeric(par4)
par5 <- as.numeric(par5)
if (par2 == 0) {
x <- log(x)
} else {
x <- (x ^ par2 - 1) / par2
}
if (par3 > 0) x <- diff(x,lag=1,difference=par3)
if (par4 > 0) x <- diff(x,lag=par5,difference=par4)
bitmap(file='pic1.png')
racf <- acf(x,par1,main='Autocorrelation',xlab='lags',ylab='ACF')
dev.off()
bitmap(file='pic2.png')
rpacf <- pacf(x,par1,main='Partial Autocorrelation',xlab='lags',ylab='PACF')
dev.off()
(myacf <- c(racf$acf))
(mypacf <- c(rpacf$acf))
lengthx <- length(x)
sqrtn <- sqrt(lengthx)
load(file='createtable')
a<-table.start()
a<-table.row.start(a)
a<-table.element(a,'Autocorrelation Function',4,TRUE)
a<-table.row.end(a)
a<-table.row.start(a)
a<-table.element(a,'Time lag k',header=TRUE)
a<-table.element(a,hyperlink('basics.htm','ACF(k)','click here for more information about the Autocorrelation Function'),header=TRUE)
a<-table.element(a,'T-STAT',header=TRUE)
a<-table.element(a,'P-value',header=TRUE)
a<-table.row.end(a)
for (i in 2:(par1+1)) {
a<-table.row.start(a)
a<-table.element(a,i-1,header=TRUE)
a<-table.element(a,round(myacf[i],6))
mytstat <- myacf[i]*sqrtn
a<-table.element(a,round(mytstat,4))
a<-table.element(a,round(1-pt(abs(mytstat),lengthx),6))
a<-table.row.end(a)
}
a<-table.end(a)
table.save(a,file='mytable.tab')
a<-table.start()
a<-table.row.start(a)
a<-table.element(a,'Partial Autocorrelation Function',4,TRUE)
a<-table.row.end(a)
a<-table.row.start(a)
a<-table.element(a,'Time lag k',header=TRUE)
a<-table.element(a,hyperlink('basics.htm','PACF(k)','click here for more information about the Partial Autocorrelation Function'),header=TRUE)
a<-table.element(a,'T-STAT',header=TRUE)
a<-table.element(a,'P-value',header=TRUE)
a<-table.row.end(a)
for (i in 1:par1) {
a<-table.row.start(a)
a<-table.element(a,i,header=TRUE)
a<-table.element(a,round(mypacf[i],6))
mytstat <- mypacf[i]*sqrtn
a<-table.element(a,round(mytstat,4))
a<-table.element(a,round(1-pt(abs(mytstat),lengthx),6))
a<-table.row.end(a)
}
a<-table.end(a)
table.save(a,file='mytable1.tab')