Free Statistics

of Irreproducible Research!

Author's title

Author*Unverified author*
R Software Modulerwasp_autocorrelation.wasp
Title produced by software(Partial) Autocorrelation Function
Date of computationTue, 09 Dec 2008 04:16:28 -0700
Cite this page as followsStatistical Computations at FreeStatistics.org, Office for Research Development and Education, URL https://freestatistics.org/blog/index.php?v=date/2008/Dec/09/t12288214272pfkobp5gd8r2or.htm/, Retrieved Fri, 17 May 2024 04:10:34 +0000
Statistical Computations at FreeStatistics.org, Office for Research Development and Education, URL https://freestatistics.org/blog/index.php?pk=31299, Retrieved Fri, 17 May 2024 04:10:34 +0000
QR Codes:

Original text written by user:
IsPrivate?No (this computation is public)
User-defined keywords
Estimated Impact173
Family? (F = Feedback message, R = changed R code, M = changed R Module, P = changed Parameters, D = changed Data)
F     [Spectral Analysis] [Diff Spectral] [2008-12-06 12:07:42] [74be16979710d4c4e7c6647856088456]
F RMP   [ARIMA Backward Selection] [Arima backward] [2008-12-06 14:19:09] [74be16979710d4c4e7c6647856088456]
- RMPD    [(Partial) Autocorrelation Function] [] [2008-12-09 10:52:15] [74be16979710d4c4e7c6647856088456]
F   PD        [(Partial) Autocorrelation Function] [] [2008-12-09 11:16:28] [d41d8cd98f00b204e9800998ecf8427e] [Current]
Feedback Forum
2008-12-14 15:07:46 [Steven Vanhooreweghe] [reply
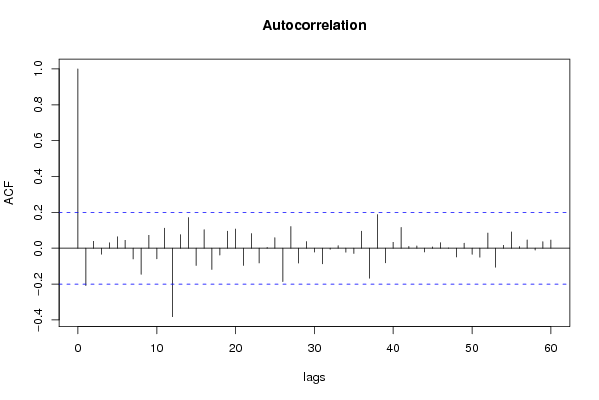
de trend is inderdaad verdwenen. Toch is het model nog niet helemaal in orde aangezien er een uitschieter is op t=12 (een belangrijk tijdstip dat wijst op seizoenaliteit)
2008-12-14 15:28:22 [Steven Vanhooreweghe] [reply
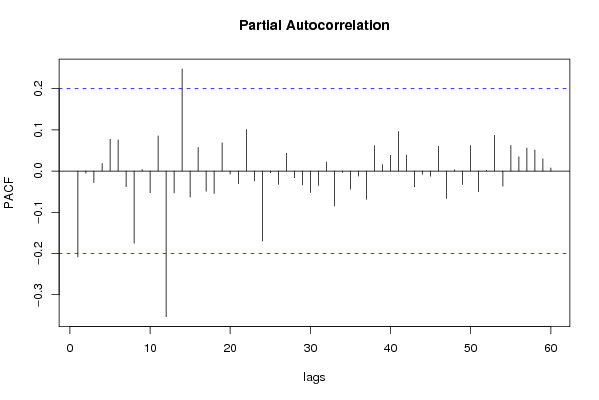
ik denk tevens ook dat het gaat om een Ma(1) prodces. De student heeft hier goed geredeneerd.
2008-12-15 13:51:16 [Katja van Hek] [reply
De ACF grafiek laat zien dat de trend verdwenen is uit het model door de differentiatie. Ik ben het eens met bovenstaande student dat het model niet perfect is. Op lag 12 is er een duidelijke uitschietende waarde die ook nog significant is.
2008-12-15 13:55:12 [Katja van Hek] [reply
Goede interpretatie. Het lijkt erop dat het een MA proces is in zowel de ACF als de PACF

Post a new message
Dataseries X:
5.1
4.9
5.2
5.1
4.6
3.7
3.9
3.1
2.8
2.6
2.2
1.8
1.3
1.2
1.4
1.3
1.3
1.9
1.9
2.1
2.0
1.9
1.9
1.9
1.8
1.7
1.6
1.7
1.9
1.7
1.3
2.0
2.0
2.3
2.0
1.7
2.3
2.4
2.4
2.3
2.1
2.1
2.5
2.0
1.8
1.7
1.9
2.1
1.4
1.6
1.7
1.6
1.9
1.6
1.1
1.3
1.6
1.6
1.7
1.6
1.7
1.6
1.5
1.6
1.1
1.5
1.4
1.3
0.9
1.2
0.9
1.1
1.3
1.3
1.4
1.2
1.7
2.0
3.0
3.1
3.2
2.7
2.8
3.0
2.8
3.1
3.1
3.2
3.1
2.7
2.2
2.2
2.1
2.3
2.5
2.3
2.6


Summary of computational transaction
Raw Inputview raw input (R code)
Raw Outputview raw output of R engine
Computing time1 seconds
R Server'Gwilym Jenkins' @ 72.249.127.135

\begin{tabular}{lllllllll}
\hline
Summary of computational transaction \tabularnewline
Raw Input & view raw input (R code)  \tabularnewline
Raw Output & view raw output of R engine  \tabularnewline
Computing time & 1 seconds \tabularnewline
R Server & 'Gwilym Jenkins' @ 72.249.127.135 \tabularnewline
\hline
\end{tabular}
%Source: https://freestatistics.org/blog/index.php?pk=31299&T=0

[TABLE]
[ROW][C]Summary of computational transaction[/C][/ROW]
[ROW][C]Raw Input[/C][C]view raw input (R code) [/C][/ROW]
[ROW][C]Raw Output[/C][C]view raw output of R engine [/C][/ROW]
[ROW][C]Computing time[/C][C]1 seconds[/C][/ROW]
[ROW][C]R Server[/C][C]'Gwilym Jenkins' @ 72.249.127.135[/C][/ROW]
[/TABLE]
Source: https://freestatistics.org/blog/index.php?pk=31299&T=0

Globally Unique Identifier (entire table): ba.freestatistics.org/blog/index.php?pk=31299&T=0

As an alternative you can also use a QR Code:  

The GUIDs for individual cells are displayed in the table below:

Summary of computational transaction
Raw Inputview raw input (R code)
Raw Outputview raw output of R engine
Computing time1 seconds
R Server'Gwilym Jenkins' @ 72.249.127.135


Autocorrelation Function
Time lag kACF(k)T-STATP-value
1-0.208543-2.04330.021882
20.0384820.3770.353487
3-0.033678-0.330.371069
40.0300520.29440.384526
50.0633660.62090.268081
60.0439710.43080.333779
7-0.060096-0.58880.278684
8-0.14584-1.42890.078135
90.0717290.70280.24194
10-0.059585-0.58380.280357
110.1116851.09430.138284
12-0.381994-3.74280.000155
130.0751950.73680.231534
140.1709981.67540.048552
15-0.096136-0.94190.174295
160.1034651.01370.156626
17-0.118493-1.1610.124262
18-0.0382-0.37430.35451
190.0949060.92990.17738
200.1070271.04860.148487
21-0.096325-0.94380.173824
220.0814690.79820.213355
23-0.082167-0.80510.211385
240.0042210.04140.483548
250.0584090.57230.284233
26-0.186378-1.82610.03547
270.1207431.1830.119859
28-0.083188-0.81510.208524
290.0367690.36030.359723
30-0.021351-0.20920.417368
31-0.087289-0.85530.197271
32-0.006204-0.06080.475828
330.0140380.13750.445446
34-0.022304-0.21850.413739
35-0.029099-0.28510.388086
360.0950520.93130.177013
37-0.167212-1.63830.052313
380.1873481.83560.034754
39-0.081324-0.79680.213764
400.0327330.32070.374563
410.1160981.13750.129075
420.0095990.0940.462633
430.0126850.12430.450672
44-0.020656-0.20240.420021
450.0072120.07070.471906
460.0306670.30050.382234
470.0011080.01090.495682
48-0.048634-0.47650.317396
490.0278160.27250.392896
50-0.03445-0.33750.368223
51-0.050365-0.49350.311403
520.084640.82930.204496
53-0.105944-1.0380.15093
540.0163470.16020.436544
550.0905030.88670.188717
560.0091560.08970.464353
570.0461780.45240.325983
58-0.010309-0.1010.459878
590.0362370.35510.361665
600.0455250.44610.328282

\begin{tabular}{lllllllll}
\hline
Autocorrelation Function \tabularnewline
Time lag k & ACF(k) & T-STAT & P-value \tabularnewline
1 & -0.208543 & -2.0433 & 0.021882 \tabularnewline
2 & 0.038482 & 0.377 & 0.353487 \tabularnewline
3 & -0.033678 & -0.33 & 0.371069 \tabularnewline
4 & 0.030052 & 0.2944 & 0.384526 \tabularnewline
5 & 0.063366 & 0.6209 & 0.268081 \tabularnewline
6 & 0.043971 & 0.4308 & 0.333779 \tabularnewline
7 & -0.060096 & -0.5888 & 0.278684 \tabularnewline
8 & -0.14584 & -1.4289 & 0.078135 \tabularnewline
9 & 0.071729 & 0.7028 & 0.24194 \tabularnewline
10 & -0.059585 & -0.5838 & 0.280357 \tabularnewline
11 & 0.111685 & 1.0943 & 0.138284 \tabularnewline
12 & -0.381994 & -3.7428 & 0.000155 \tabularnewline
13 & 0.075195 & 0.7368 & 0.231534 \tabularnewline
14 & 0.170998 & 1.6754 & 0.048552 \tabularnewline
15 & -0.096136 & -0.9419 & 0.174295 \tabularnewline
16 & 0.103465 & 1.0137 & 0.156626 \tabularnewline
17 & -0.118493 & -1.161 & 0.124262 \tabularnewline
18 & -0.0382 & -0.3743 & 0.35451 \tabularnewline
19 & 0.094906 & 0.9299 & 0.17738 \tabularnewline
20 & 0.107027 & 1.0486 & 0.148487 \tabularnewline
21 & -0.096325 & -0.9438 & 0.173824 \tabularnewline
22 & 0.081469 & 0.7982 & 0.213355 \tabularnewline
23 & -0.082167 & -0.8051 & 0.211385 \tabularnewline
24 & 0.004221 & 0.0414 & 0.483548 \tabularnewline
25 & 0.058409 & 0.5723 & 0.284233 \tabularnewline
26 & -0.186378 & -1.8261 & 0.03547 \tabularnewline
27 & 0.120743 & 1.183 & 0.119859 \tabularnewline
28 & -0.083188 & -0.8151 & 0.208524 \tabularnewline
29 & 0.036769 & 0.3603 & 0.359723 \tabularnewline
30 & -0.021351 & -0.2092 & 0.417368 \tabularnewline
31 & -0.087289 & -0.8553 & 0.197271 \tabularnewline
32 & -0.006204 & -0.0608 & 0.475828 \tabularnewline
33 & 0.014038 & 0.1375 & 0.445446 \tabularnewline
34 & -0.022304 & -0.2185 & 0.413739 \tabularnewline
35 & -0.029099 & -0.2851 & 0.388086 \tabularnewline
36 & 0.095052 & 0.9313 & 0.177013 \tabularnewline
37 & -0.167212 & -1.6383 & 0.052313 \tabularnewline
38 & 0.187348 & 1.8356 & 0.034754 \tabularnewline
39 & -0.081324 & -0.7968 & 0.213764 \tabularnewline
40 & 0.032733 & 0.3207 & 0.374563 \tabularnewline
41 & 0.116098 & 1.1375 & 0.129075 \tabularnewline
42 & 0.009599 & 0.094 & 0.462633 \tabularnewline
43 & 0.012685 & 0.1243 & 0.450672 \tabularnewline
44 & -0.020656 & -0.2024 & 0.420021 \tabularnewline
45 & 0.007212 & 0.0707 & 0.471906 \tabularnewline
46 & 0.030667 & 0.3005 & 0.382234 \tabularnewline
47 & 0.001108 & 0.0109 & 0.495682 \tabularnewline
48 & -0.048634 & -0.4765 & 0.317396 \tabularnewline
49 & 0.027816 & 0.2725 & 0.392896 \tabularnewline
50 & -0.03445 & -0.3375 & 0.368223 \tabularnewline
51 & -0.050365 & -0.4935 & 0.311403 \tabularnewline
52 & 0.08464 & 0.8293 & 0.204496 \tabularnewline
53 & -0.105944 & -1.038 & 0.15093 \tabularnewline
54 & 0.016347 & 0.1602 & 0.436544 \tabularnewline
55 & 0.090503 & 0.8867 & 0.188717 \tabularnewline
56 & 0.009156 & 0.0897 & 0.464353 \tabularnewline
57 & 0.046178 & 0.4524 & 0.325983 \tabularnewline
58 & -0.010309 & -0.101 & 0.459878 \tabularnewline
59 & 0.036237 & 0.3551 & 0.361665 \tabularnewline
60 & 0.045525 & 0.4461 & 0.328282 \tabularnewline
\hline
\end{tabular}
%Source: https://freestatistics.org/blog/index.php?pk=31299&T=1

[TABLE]
[ROW][C]Autocorrelation Function[/C][/ROW]
[ROW][C]Time lag k[/C][C]ACF(k)[/C][C]T-STAT[/C][C]P-value[/C][/ROW]
[ROW][C]1[/C][C]-0.208543[/C][C]-2.0433[/C][C]0.021882[/C][/ROW]
[ROW][C]2[/C][C]0.038482[/C][C]0.377[/C][C]0.353487[/C][/ROW]
[ROW][C]3[/C][C]-0.033678[/C][C]-0.33[/C][C]0.371069[/C][/ROW]
[ROW][C]4[/C][C]0.030052[/C][C]0.2944[/C][C]0.384526[/C][/ROW]
[ROW][C]5[/C][C]0.063366[/C][C]0.6209[/C][C]0.268081[/C][/ROW]
[ROW][C]6[/C][C]0.043971[/C][C]0.4308[/C][C]0.333779[/C][/ROW]
[ROW][C]7[/C][C]-0.060096[/C][C]-0.5888[/C][C]0.278684[/C][/ROW]
[ROW][C]8[/C][C]-0.14584[/C][C]-1.4289[/C][C]0.078135[/C][/ROW]
[ROW][C]9[/C][C]0.071729[/C][C]0.7028[/C][C]0.24194[/C][/ROW]
[ROW][C]10[/C][C]-0.059585[/C][C]-0.5838[/C][C]0.280357[/C][/ROW]
[ROW][C]11[/C][C]0.111685[/C][C]1.0943[/C][C]0.138284[/C][/ROW]
[ROW][C]12[/C][C]-0.381994[/C][C]-3.7428[/C][C]0.000155[/C][/ROW]
[ROW][C]13[/C][C]0.075195[/C][C]0.7368[/C][C]0.231534[/C][/ROW]
[ROW][C]14[/C][C]0.170998[/C][C]1.6754[/C][C]0.048552[/C][/ROW]
[ROW][C]15[/C][C]-0.096136[/C][C]-0.9419[/C][C]0.174295[/C][/ROW]
[ROW][C]16[/C][C]0.103465[/C][C]1.0137[/C][C]0.156626[/C][/ROW]
[ROW][C]17[/C][C]-0.118493[/C][C]-1.161[/C][C]0.124262[/C][/ROW]
[ROW][C]18[/C][C]-0.0382[/C][C]-0.3743[/C][C]0.35451[/C][/ROW]
[ROW][C]19[/C][C]0.094906[/C][C]0.9299[/C][C]0.17738[/C][/ROW]
[ROW][C]20[/C][C]0.107027[/C][C]1.0486[/C][C]0.148487[/C][/ROW]
[ROW][C]21[/C][C]-0.096325[/C][C]-0.9438[/C][C]0.173824[/C][/ROW]
[ROW][C]22[/C][C]0.081469[/C][C]0.7982[/C][C]0.213355[/C][/ROW]
[ROW][C]23[/C][C]-0.082167[/C][C]-0.8051[/C][C]0.211385[/C][/ROW]
[ROW][C]24[/C][C]0.004221[/C][C]0.0414[/C][C]0.483548[/C][/ROW]
[ROW][C]25[/C][C]0.058409[/C][C]0.5723[/C][C]0.284233[/C][/ROW]
[ROW][C]26[/C][C]-0.186378[/C][C]-1.8261[/C][C]0.03547[/C][/ROW]
[ROW][C]27[/C][C]0.120743[/C][C]1.183[/C][C]0.119859[/C][/ROW]
[ROW][C]28[/C][C]-0.083188[/C][C]-0.8151[/C][C]0.208524[/C][/ROW]
[ROW][C]29[/C][C]0.036769[/C][C]0.3603[/C][C]0.359723[/C][/ROW]
[ROW][C]30[/C][C]-0.021351[/C][C]-0.2092[/C][C]0.417368[/C][/ROW]
[ROW][C]31[/C][C]-0.087289[/C][C]-0.8553[/C][C]0.197271[/C][/ROW]
[ROW][C]32[/C][C]-0.006204[/C][C]-0.0608[/C][C]0.475828[/C][/ROW]
[ROW][C]33[/C][C]0.014038[/C][C]0.1375[/C][C]0.445446[/C][/ROW]
[ROW][C]34[/C][C]-0.022304[/C][C]-0.2185[/C][C]0.413739[/C][/ROW]
[ROW][C]35[/C][C]-0.029099[/C][C]-0.2851[/C][C]0.388086[/C][/ROW]
[ROW][C]36[/C][C]0.095052[/C][C]0.9313[/C][C]0.177013[/C][/ROW]
[ROW][C]37[/C][C]-0.167212[/C][C]-1.6383[/C][C]0.052313[/C][/ROW]
[ROW][C]38[/C][C]0.187348[/C][C]1.8356[/C][C]0.034754[/C][/ROW]
[ROW][C]39[/C][C]-0.081324[/C][C]-0.7968[/C][C]0.213764[/C][/ROW]
[ROW][C]40[/C][C]0.032733[/C][C]0.3207[/C][C]0.374563[/C][/ROW]
[ROW][C]41[/C][C]0.116098[/C][C]1.1375[/C][C]0.129075[/C][/ROW]
[ROW][C]42[/C][C]0.009599[/C][C]0.094[/C][C]0.462633[/C][/ROW]
[ROW][C]43[/C][C]0.012685[/C][C]0.1243[/C][C]0.450672[/C][/ROW]
[ROW][C]44[/C][C]-0.020656[/C][C]-0.2024[/C][C]0.420021[/C][/ROW]
[ROW][C]45[/C][C]0.007212[/C][C]0.0707[/C][C]0.471906[/C][/ROW]
[ROW][C]46[/C][C]0.030667[/C][C]0.3005[/C][C]0.382234[/C][/ROW]
[ROW][C]47[/C][C]0.001108[/C][C]0.0109[/C][C]0.495682[/C][/ROW]
[ROW][C]48[/C][C]-0.048634[/C][C]-0.4765[/C][C]0.317396[/C][/ROW]
[ROW][C]49[/C][C]0.027816[/C][C]0.2725[/C][C]0.392896[/C][/ROW]
[ROW][C]50[/C][C]-0.03445[/C][C]-0.3375[/C][C]0.368223[/C][/ROW]
[ROW][C]51[/C][C]-0.050365[/C][C]-0.4935[/C][C]0.311403[/C][/ROW]
[ROW][C]52[/C][C]0.08464[/C][C]0.8293[/C][C]0.204496[/C][/ROW]
[ROW][C]53[/C][C]-0.105944[/C][C]-1.038[/C][C]0.15093[/C][/ROW]
[ROW][C]54[/C][C]0.016347[/C][C]0.1602[/C][C]0.436544[/C][/ROW]
[ROW][C]55[/C][C]0.090503[/C][C]0.8867[/C][C]0.188717[/C][/ROW]
[ROW][C]56[/C][C]0.009156[/C][C]0.0897[/C][C]0.464353[/C][/ROW]
[ROW][C]57[/C][C]0.046178[/C][C]0.4524[/C][C]0.325983[/C][/ROW]
[ROW][C]58[/C][C]-0.010309[/C][C]-0.101[/C][C]0.459878[/C][/ROW]
[ROW][C]59[/C][C]0.036237[/C][C]0.3551[/C][C]0.361665[/C][/ROW]
[ROW][C]60[/C][C]0.045525[/C][C]0.4461[/C][C]0.328282[/C][/ROW]
[/TABLE]
Source: https://freestatistics.org/blog/index.php?pk=31299&T=1

Globally Unique Identifier (entire table): ba.freestatistics.org/blog/index.php?pk=31299&T=1

As an alternative you can also use a QR Code:  

The GUIDs for individual cells are displayed in the table below:

Autocorrelation Function
Time lag kACF(k)T-STATP-value
1-0.208543-2.04330.021882
20.0384820.3770.353487
3-0.033678-0.330.371069
40.0300520.29440.384526
50.0633660.62090.268081
60.0439710.43080.333779
7-0.060096-0.58880.278684
8-0.14584-1.42890.078135
90.0717290.70280.24194
10-0.059585-0.58380.280357
110.1116851.09430.138284
12-0.381994-3.74280.000155
130.0751950.73680.231534
140.1709981.67540.048552
15-0.096136-0.94190.174295
160.1034651.01370.156626
17-0.118493-1.1610.124262
18-0.0382-0.37430.35451
190.0949060.92990.17738
200.1070271.04860.148487
21-0.096325-0.94380.173824
220.0814690.79820.213355
23-0.082167-0.80510.211385
240.0042210.04140.483548
250.0584090.57230.284233
26-0.186378-1.82610.03547
270.1207431.1830.119859
28-0.083188-0.81510.208524
290.0367690.36030.359723
30-0.021351-0.20920.417368
31-0.087289-0.85530.197271
32-0.006204-0.06080.475828
330.0140380.13750.445446
34-0.022304-0.21850.413739
35-0.029099-0.28510.388086
360.0950520.93130.177013
37-0.167212-1.63830.052313
380.1873481.83560.034754
39-0.081324-0.79680.213764
400.0327330.32070.374563
410.1160981.13750.129075
420.0095990.0940.462633
430.0126850.12430.450672
44-0.020656-0.20240.420021
450.0072120.07070.471906
460.0306670.30050.382234
470.0011080.01090.495682
48-0.048634-0.47650.317396
490.0278160.27250.392896
50-0.03445-0.33750.368223
51-0.050365-0.49350.311403
520.084640.82930.204496
53-0.105944-1.0380.15093
540.0163470.16020.436544
550.0905030.88670.188717
560.0091560.08970.464353
570.0461780.45240.325983
58-0.010309-0.1010.459878
590.0362370.35510.361665
600.0455250.44610.328282


Partial Autocorrelation Function
Time lag kPACF(k)T-STATP-value
1-0.208543-2.04330.021882
2-0.005236-0.05130.479596
3-0.027918-0.27350.392515
40.0184060.18030.428631
50.0775090.75940.224729
60.0754390.73920.230809
7-0.037982-0.37210.355303
8-0.175482-1.71940.044385
90.003560.03490.486123
10-0.052491-0.51430.304111
110.0853220.8360.202622
12-0.353336-3.4620.000401
13-0.05301-0.51940.302342
140.2478722.42860.008509
15-0.063105-0.61830.268922
160.0574570.5630.287386
17-0.04905-0.48060.315952
18-0.054356-0.53260.297777
190.0686140.67230.251511
20-0.007258-0.07110.471727
21-0.030626-0.30010.382385
220.100690.98660.16317
23-0.023836-0.23350.407917
24-0.169989-1.66550.049532
25-0.004177-0.04090.48372
26-0.032141-0.31490.376756
270.043540.42660.335312
28-0.016086-0.15760.437549
29-0.033534-0.32860.371601
30-0.052009-0.50960.305756
31-0.034828-0.34120.366833
320.021860.21420.41543
33-0.084547-0.82840.204752
34-0.003435-0.03370.486611
35-0.044059-0.43170.333467
36-0.012046-0.1180.453149
37-0.068539-0.67150.251744
380.0613950.60150.274449
390.0157710.15450.43876
400.0381270.37360.354777
410.0962410.9430.174033
420.0391990.38410.350886
43-0.038295-0.37520.354165
44-0.007881-0.07720.469306
45-0.012416-0.12170.451713
460.0602740.59060.278101
47-0.066387-0.65050.258476
480.0034440.03370.486576
49-0.03246-0.3180.375571
500.061970.60720.272582
51-0.049955-0.48950.312818
520.0017890.01750.493027
530.0867980.85040.198598
54-0.036619-0.35880.360268
550.0622860.61030.271561
560.0344780.33780.368121
570.0557550.54630.29307
580.0511760.50140.30861
590.0297860.29180.38552
600.0077480.07590.469821

\begin{tabular}{lllllllll}
\hline
Partial Autocorrelation Function \tabularnewline
Time lag k & PACF(k) & T-STAT & P-value \tabularnewline
1 & -0.208543 & -2.0433 & 0.021882 \tabularnewline
2 & -0.005236 & -0.0513 & 0.479596 \tabularnewline
3 & -0.027918 & -0.2735 & 0.392515 \tabularnewline
4 & 0.018406 & 0.1803 & 0.428631 \tabularnewline
5 & 0.077509 & 0.7594 & 0.224729 \tabularnewline
6 & 0.075439 & 0.7392 & 0.230809 \tabularnewline
7 & -0.037982 & -0.3721 & 0.355303 \tabularnewline
8 & -0.175482 & -1.7194 & 0.044385 \tabularnewline
9 & 0.00356 & 0.0349 & 0.486123 \tabularnewline
10 & -0.052491 & -0.5143 & 0.304111 \tabularnewline
11 & 0.085322 & 0.836 & 0.202622 \tabularnewline
12 & -0.353336 & -3.462 & 0.000401 \tabularnewline
13 & -0.05301 & -0.5194 & 0.302342 \tabularnewline
14 & 0.247872 & 2.4286 & 0.008509 \tabularnewline
15 & -0.063105 & -0.6183 & 0.268922 \tabularnewline
16 & 0.057457 & 0.563 & 0.287386 \tabularnewline
17 & -0.04905 & -0.4806 & 0.315952 \tabularnewline
18 & -0.054356 & -0.5326 & 0.297777 \tabularnewline
19 & 0.068614 & 0.6723 & 0.251511 \tabularnewline
20 & -0.007258 & -0.0711 & 0.471727 \tabularnewline
21 & -0.030626 & -0.3001 & 0.382385 \tabularnewline
22 & 0.10069 & 0.9866 & 0.16317 \tabularnewline
23 & -0.023836 & -0.2335 & 0.407917 \tabularnewline
24 & -0.169989 & -1.6655 & 0.049532 \tabularnewline
25 & -0.004177 & -0.0409 & 0.48372 \tabularnewline
26 & -0.032141 & -0.3149 & 0.376756 \tabularnewline
27 & 0.04354 & 0.4266 & 0.335312 \tabularnewline
28 & -0.016086 & -0.1576 & 0.437549 \tabularnewline
29 & -0.033534 & -0.3286 & 0.371601 \tabularnewline
30 & -0.052009 & -0.5096 & 0.305756 \tabularnewline
31 & -0.034828 & -0.3412 & 0.366833 \tabularnewline
32 & 0.02186 & 0.2142 & 0.41543 \tabularnewline
33 & -0.084547 & -0.8284 & 0.204752 \tabularnewline
34 & -0.003435 & -0.0337 & 0.486611 \tabularnewline
35 & -0.044059 & -0.4317 & 0.333467 \tabularnewline
36 & -0.012046 & -0.118 & 0.453149 \tabularnewline
37 & -0.068539 & -0.6715 & 0.251744 \tabularnewline
38 & 0.061395 & 0.6015 & 0.274449 \tabularnewline
39 & 0.015771 & 0.1545 & 0.43876 \tabularnewline
40 & 0.038127 & 0.3736 & 0.354777 \tabularnewline
41 & 0.096241 & 0.943 & 0.174033 \tabularnewline
42 & 0.039199 & 0.3841 & 0.350886 \tabularnewline
43 & -0.038295 & -0.3752 & 0.354165 \tabularnewline
44 & -0.007881 & -0.0772 & 0.469306 \tabularnewline
45 & -0.012416 & -0.1217 & 0.451713 \tabularnewline
46 & 0.060274 & 0.5906 & 0.278101 \tabularnewline
47 & -0.066387 & -0.6505 & 0.258476 \tabularnewline
48 & 0.003444 & 0.0337 & 0.486576 \tabularnewline
49 & -0.03246 & -0.318 & 0.375571 \tabularnewline
50 & 0.06197 & 0.6072 & 0.272582 \tabularnewline
51 & -0.049955 & -0.4895 & 0.312818 \tabularnewline
52 & 0.001789 & 0.0175 & 0.493027 \tabularnewline
53 & 0.086798 & 0.8504 & 0.198598 \tabularnewline
54 & -0.036619 & -0.3588 & 0.360268 \tabularnewline
55 & 0.062286 & 0.6103 & 0.271561 \tabularnewline
56 & 0.034478 & 0.3378 & 0.368121 \tabularnewline
57 & 0.055755 & 0.5463 & 0.29307 \tabularnewline
58 & 0.051176 & 0.5014 & 0.30861 \tabularnewline
59 & 0.029786 & 0.2918 & 0.38552 \tabularnewline
60 & 0.007748 & 0.0759 & 0.469821 \tabularnewline
\hline
\end{tabular}
%Source: https://freestatistics.org/blog/index.php?pk=31299&T=2

[TABLE]
[ROW][C]Partial Autocorrelation Function[/C][/ROW]
[ROW][C]Time lag k[/C][C]PACF(k)[/C][C]T-STAT[/C][C]P-value[/C][/ROW]
[ROW][C]1[/C][C]-0.208543[/C][C]-2.0433[/C][C]0.021882[/C][/ROW]
[ROW][C]2[/C][C]-0.005236[/C][C]-0.0513[/C][C]0.479596[/C][/ROW]
[ROW][C]3[/C][C]-0.027918[/C][C]-0.2735[/C][C]0.392515[/C][/ROW]
[ROW][C]4[/C][C]0.018406[/C][C]0.1803[/C][C]0.428631[/C][/ROW]
[ROW][C]5[/C][C]0.077509[/C][C]0.7594[/C][C]0.224729[/C][/ROW]
[ROW][C]6[/C][C]0.075439[/C][C]0.7392[/C][C]0.230809[/C][/ROW]
[ROW][C]7[/C][C]-0.037982[/C][C]-0.3721[/C][C]0.355303[/C][/ROW]
[ROW][C]8[/C][C]-0.175482[/C][C]-1.7194[/C][C]0.044385[/C][/ROW]
[ROW][C]9[/C][C]0.00356[/C][C]0.0349[/C][C]0.486123[/C][/ROW]
[ROW][C]10[/C][C]-0.052491[/C][C]-0.5143[/C][C]0.304111[/C][/ROW]
[ROW][C]11[/C][C]0.085322[/C][C]0.836[/C][C]0.202622[/C][/ROW]
[ROW][C]12[/C][C]-0.353336[/C][C]-3.462[/C][C]0.000401[/C][/ROW]
[ROW][C]13[/C][C]-0.05301[/C][C]-0.5194[/C][C]0.302342[/C][/ROW]
[ROW][C]14[/C][C]0.247872[/C][C]2.4286[/C][C]0.008509[/C][/ROW]
[ROW][C]15[/C][C]-0.063105[/C][C]-0.6183[/C][C]0.268922[/C][/ROW]
[ROW][C]16[/C][C]0.057457[/C][C]0.563[/C][C]0.287386[/C][/ROW]
[ROW][C]17[/C][C]-0.04905[/C][C]-0.4806[/C][C]0.315952[/C][/ROW]
[ROW][C]18[/C][C]-0.054356[/C][C]-0.5326[/C][C]0.297777[/C][/ROW]
[ROW][C]19[/C][C]0.068614[/C][C]0.6723[/C][C]0.251511[/C][/ROW]
[ROW][C]20[/C][C]-0.007258[/C][C]-0.0711[/C][C]0.471727[/C][/ROW]
[ROW][C]21[/C][C]-0.030626[/C][C]-0.3001[/C][C]0.382385[/C][/ROW]
[ROW][C]22[/C][C]0.10069[/C][C]0.9866[/C][C]0.16317[/C][/ROW]
[ROW][C]23[/C][C]-0.023836[/C][C]-0.2335[/C][C]0.407917[/C][/ROW]
[ROW][C]24[/C][C]-0.169989[/C][C]-1.6655[/C][C]0.049532[/C][/ROW]
[ROW][C]25[/C][C]-0.004177[/C][C]-0.0409[/C][C]0.48372[/C][/ROW]
[ROW][C]26[/C][C]-0.032141[/C][C]-0.3149[/C][C]0.376756[/C][/ROW]
[ROW][C]27[/C][C]0.04354[/C][C]0.4266[/C][C]0.335312[/C][/ROW]
[ROW][C]28[/C][C]-0.016086[/C][C]-0.1576[/C][C]0.437549[/C][/ROW]
[ROW][C]29[/C][C]-0.033534[/C][C]-0.3286[/C][C]0.371601[/C][/ROW]
[ROW][C]30[/C][C]-0.052009[/C][C]-0.5096[/C][C]0.305756[/C][/ROW]
[ROW][C]31[/C][C]-0.034828[/C][C]-0.3412[/C][C]0.366833[/C][/ROW]
[ROW][C]32[/C][C]0.02186[/C][C]0.2142[/C][C]0.41543[/C][/ROW]
[ROW][C]33[/C][C]-0.084547[/C][C]-0.8284[/C][C]0.204752[/C][/ROW]
[ROW][C]34[/C][C]-0.003435[/C][C]-0.0337[/C][C]0.486611[/C][/ROW]
[ROW][C]35[/C][C]-0.044059[/C][C]-0.4317[/C][C]0.333467[/C][/ROW]
[ROW][C]36[/C][C]-0.012046[/C][C]-0.118[/C][C]0.453149[/C][/ROW]
[ROW][C]37[/C][C]-0.068539[/C][C]-0.6715[/C][C]0.251744[/C][/ROW]
[ROW][C]38[/C][C]0.061395[/C][C]0.6015[/C][C]0.274449[/C][/ROW]
[ROW][C]39[/C][C]0.015771[/C][C]0.1545[/C][C]0.43876[/C][/ROW]
[ROW][C]40[/C][C]0.038127[/C][C]0.3736[/C][C]0.354777[/C][/ROW]
[ROW][C]41[/C][C]0.096241[/C][C]0.943[/C][C]0.174033[/C][/ROW]
[ROW][C]42[/C][C]0.039199[/C][C]0.3841[/C][C]0.350886[/C][/ROW]
[ROW][C]43[/C][C]-0.038295[/C][C]-0.3752[/C][C]0.354165[/C][/ROW]
[ROW][C]44[/C][C]-0.007881[/C][C]-0.0772[/C][C]0.469306[/C][/ROW]
[ROW][C]45[/C][C]-0.012416[/C][C]-0.1217[/C][C]0.451713[/C][/ROW]
[ROW][C]46[/C][C]0.060274[/C][C]0.5906[/C][C]0.278101[/C][/ROW]
[ROW][C]47[/C][C]-0.066387[/C][C]-0.6505[/C][C]0.258476[/C][/ROW]
[ROW][C]48[/C][C]0.003444[/C][C]0.0337[/C][C]0.486576[/C][/ROW]
[ROW][C]49[/C][C]-0.03246[/C][C]-0.318[/C][C]0.375571[/C][/ROW]
[ROW][C]50[/C][C]0.06197[/C][C]0.6072[/C][C]0.272582[/C][/ROW]
[ROW][C]51[/C][C]-0.049955[/C][C]-0.4895[/C][C]0.312818[/C][/ROW]
[ROW][C]52[/C][C]0.001789[/C][C]0.0175[/C][C]0.493027[/C][/ROW]
[ROW][C]53[/C][C]0.086798[/C][C]0.8504[/C][C]0.198598[/C][/ROW]
[ROW][C]54[/C][C]-0.036619[/C][C]-0.3588[/C][C]0.360268[/C][/ROW]
[ROW][C]55[/C][C]0.062286[/C][C]0.6103[/C][C]0.271561[/C][/ROW]
[ROW][C]56[/C][C]0.034478[/C][C]0.3378[/C][C]0.368121[/C][/ROW]
[ROW][C]57[/C][C]0.055755[/C][C]0.5463[/C][C]0.29307[/C][/ROW]
[ROW][C]58[/C][C]0.051176[/C][C]0.5014[/C][C]0.30861[/C][/ROW]
[ROW][C]59[/C][C]0.029786[/C][C]0.2918[/C][C]0.38552[/C][/ROW]
[ROW][C]60[/C][C]0.007748[/C][C]0.0759[/C][C]0.469821[/C][/ROW]
[/TABLE]
Source: https://freestatistics.org/blog/index.php?pk=31299&T=2

Globally Unique Identifier (entire table): ba.freestatistics.org/blog/index.php?pk=31299&T=2

As an alternative you can also use a QR Code:  

The GUIDs for individual cells are displayed in the table below:

Partial Autocorrelation Function
Time lag kPACF(k)T-STATP-value
1-0.208543-2.04330.021882
2-0.005236-0.05130.479596
3-0.027918-0.27350.392515
40.0184060.18030.428631
50.0775090.75940.224729
60.0754390.73920.230809
7-0.037982-0.37210.355303
8-0.175482-1.71940.044385
90.003560.03490.486123
10-0.052491-0.51430.304111
110.0853220.8360.202622
12-0.353336-3.4620.000401
13-0.05301-0.51940.302342
140.2478722.42860.008509
15-0.063105-0.61830.268922
160.0574570.5630.287386
17-0.04905-0.48060.315952
18-0.054356-0.53260.297777
190.0686140.67230.251511
20-0.007258-0.07110.471727
21-0.030626-0.30010.382385
220.100690.98660.16317
23-0.023836-0.23350.407917
24-0.169989-1.66550.049532
25-0.004177-0.04090.48372
26-0.032141-0.31490.376756
270.043540.42660.335312
28-0.016086-0.15760.437549
29-0.033534-0.32860.371601
30-0.052009-0.50960.305756
31-0.034828-0.34120.366833
320.021860.21420.41543
33-0.084547-0.82840.204752
34-0.003435-0.03370.486611
35-0.044059-0.43170.333467
36-0.012046-0.1180.453149
37-0.068539-0.67150.251744
380.0613950.60150.274449
390.0157710.15450.43876
400.0381270.37360.354777
410.0962410.9430.174033
420.0391990.38410.350886
43-0.038295-0.37520.354165
44-0.007881-0.07720.469306
45-0.012416-0.12170.451713
460.0602740.59060.278101
47-0.066387-0.65050.258476
480.0034440.03370.486576
49-0.03246-0.3180.375571
500.061970.60720.272582
51-0.049955-0.48950.312818
520.0017890.01750.493027
530.0867980.85040.198598
54-0.036619-0.35880.360268
550.0622860.61030.271561
560.0344780.33780.368121
570.0557550.54630.29307
580.0511760.50140.30861
590.0297860.29180.38552
600.0077480.07590.469821


Parameters (Session):
par1 = 60 ; par2 = -0.5 ; par3 = 1 ; par4 = 0 ; par5 = 12 ;
Parameters (R input):
par1 = 60 ; par2 = -0.5 ; par3 = 1 ; par4 = 0 ; par5 = 12 ;
R code (references can be found in the software module):
if (par1 == 'Default') {
par1 = 10*log10(length(x))
} else {
par1 <- as.numeric(par1)
}
par2 <- as.numeric(par2)
par3 <- as.numeric(par3)
par4 <- as.numeric(par4)
par5 <- as.numeric(par5)
if (par2 == 0) {
x <- log(x)
} else {
x <- (x ^ par2 - 1) / par2
}
if (par3 > 0) x <- diff(x,lag=1,difference=par3)
if (par4 > 0) x <- diff(x,lag=par5,difference=par4)
bitmap(file='pic1.png')
racf <- acf(x,par1,main='Autocorrelation',xlab='lags',ylab='ACF')
dev.off()
bitmap(file='pic2.png')
rpacf <- pacf(x,par1,main='Partial Autocorrelation',xlab='lags',ylab='PACF')
dev.off()
(myacf <- c(racf$acf))
(mypacf <- c(rpacf$acf))
lengthx <- length(x)
sqrtn <- sqrt(lengthx)
load(file='createtable')
a<-table.start()
a<-table.row.start(a)
a<-table.element(a,'Autocorrelation Function',4,TRUE)
a<-table.row.end(a)
a<-table.row.start(a)
a<-table.element(a,'Time lag k',header=TRUE)
a<-table.element(a,hyperlink('basics.htm','ACF(k)','click here for more information about the Autocorrelation Function'),header=TRUE)
a<-table.element(a,'T-STAT',header=TRUE)
a<-table.element(a,'P-value',header=TRUE)
a<-table.row.end(a)
for (i in 2:(par1+1)) {
a<-table.row.start(a)
a<-table.element(a,i-1,header=TRUE)
a<-table.element(a,round(myacf[i],6))
mytstat <- myacf[i]*sqrtn
a<-table.element(a,round(mytstat,4))
a<-table.element(a,round(1-pt(abs(mytstat),lengthx),6))
a<-table.row.end(a)
}
a<-table.end(a)
table.save(a,file='mytable.tab')
a<-table.start()
a<-table.row.start(a)
a<-table.element(a,'Partial Autocorrelation Function',4,TRUE)
a<-table.row.end(a)
a<-table.row.start(a)
a<-table.element(a,'Time lag k',header=TRUE)
a<-table.element(a,hyperlink('basics.htm','PACF(k)','click here for more information about the Partial Autocorrelation Function'),header=TRUE)
a<-table.element(a,'T-STAT',header=TRUE)
a<-table.element(a,'P-value',header=TRUE)
a<-table.row.end(a)
for (i in 1:par1) {
a<-table.row.start(a)
a<-table.element(a,i,header=TRUE)
a<-table.element(a,round(mypacf[i],6))
mytstat <- mypacf[i]*sqrtn
a<-table.element(a,round(mytstat,4))
a<-table.element(a,round(1-pt(abs(mytstat),lengthx),6))
a<-table.row.end(a)
}
a<-table.end(a)
table.save(a,file='mytable1.tab')