Free Statistics

of Irreproducible Research!

Author's title

Author*The author of this computation has been verified*
R Software Modulerwasp_smp.wasp
Title produced by softwareStandard Deviation-Mean Plot
Date of computationTue, 09 Dec 2008 01:33:18 -0700
Cite this page as followsStatistical Computations at FreeStatistics.org, Office for Research Development and Education, URL https://freestatistics.org/blog/index.php?v=date/2008/Dec/09/t1228811630e7recnhmy6ci98s.htm/, Retrieved Fri, 17 May 2024 05:14:47 +0000
Statistical Computations at FreeStatistics.org, Office for Research Development and Education, URL https://freestatistics.org/blog/index.php?pk=31202, Retrieved Fri, 17 May 2024 05:14:47 +0000
QR Codes:

Original text written by user:
IsPrivate?No (this computation is public)
User-defined keywords
Estimated Impact182
Family? (F = Feedback message, R = changed R code, M = changed R Module, P = changed Parameters, D = changed Data)
F     [ARIMA Backward Selection] [] [2008-12-07 14:04:55] [74be16979710d4c4e7c6647856088456]
F RMPD  [Standard Deviation-Mean Plot] [] [2008-12-08 19:35:41] [a4ee3bef49b119f4bd2e925060c84f5e]
F   P       [Standard Deviation-Mean Plot] [] [2008-12-09 08:33:18] [428345b1a3979ee2ad6751f9aac15fbb] [Current]
Feedback Forum
2008-12-16 07:42:15 [Glenn De Maeyer] [reply
Bij de eerste stap wordt gevraagd om de correcte lambda waarde te berekenen. De student lost deze vraag correct op. Hij maakt gebruik van van de Standard Deviation – Mean Plot software.

Uit de tabel Regression: ln S.E.(k) = alpha + beta * ln Mean(k) kunnen we een lamba waarde van 0.376909377571558 afleiden.

Als we 1 in vermindering hadden gebracht met de Beta waarde had dit ook geresulteerd in de optimale Lamba Coëfficiënt. Nl, (1 - 0.623090622428442) is gelijk aan 0.376909377571558.

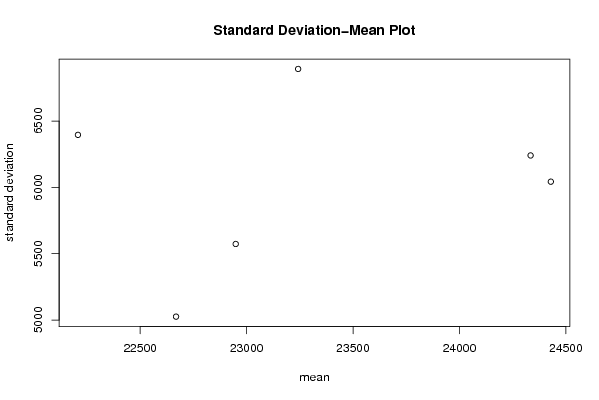
Op de grafische weergave van de Standard Deviation – Mean Plot noteren we op de x as het gemiddelde en op y as de standaard fout.

Post a new message
Dataseries X:
22780
17351
21382
24561
17409
11514
31514
27071
29462
26105
22397
23843
21705
18089
20764
25316
17704
15548
28029
29383
36438
32034
22679
24319
18004
17537
20366
22782
19169
13807
29743
25591
29096
26482
22405
27044
17970
18730
19684
19785
18479
10698
31956
29506
34506
27165
26736
23691
18157
17328
18205
20995
17382
9367
31124
26551
30651
25859
25100
25778
20418
18688
20424
24776
19814
12738
31566
30111
30019
31934
25826
26835


Summary of computational transaction
Raw Inputview raw input (R code)
Raw Outputview raw output of R engine
Computing time3 seconds
R Server'Herman Ole Andreas Wold' @ 193.190.124.10:1001

\begin{tabular}{lllllllll}
\hline
Summary of computational transaction \tabularnewline
Raw Input & view raw input (R code)  \tabularnewline
Raw Output & view raw output of R engine  \tabularnewline
Computing time & 3 seconds \tabularnewline
R Server & 'Herman Ole Andreas Wold' @ 193.190.124.10:1001 \tabularnewline
\hline
\end{tabular}
%Source: https://freestatistics.org/blog/index.php?pk=31202&T=0

[TABLE]
[ROW][C]Summary of computational transaction[/C][/ROW]
[ROW][C]Raw Input[/C][C]view raw input (R code) [/C][/ROW]
[ROW][C]Raw Output[/C][C]view raw output of R engine [/C][/ROW]
[ROW][C]Computing time[/C][C]3 seconds[/C][/ROW]
[ROW][C]R Server[/C][C]'Herman Ole Andreas Wold' @ 193.190.124.10:1001[/C][/ROW]
[/TABLE]
Source: https://freestatistics.org/blog/index.php?pk=31202&T=0

Globally Unique Identifier (entire table): ba.freestatistics.org/blog/index.php?pk=31202&T=0

As an alternative you can also use a QR Code:  

The GUIDs for individual cells are displayed in the table below:

Summary of computational transaction
Raw Inputview raw input (R code)
Raw Outputview raw output of R engine
Computing time3 seconds
R Server'Herman Ole Andreas Wold' @ 193.190.124.10:1001


Standard Deviation-Mean Plot
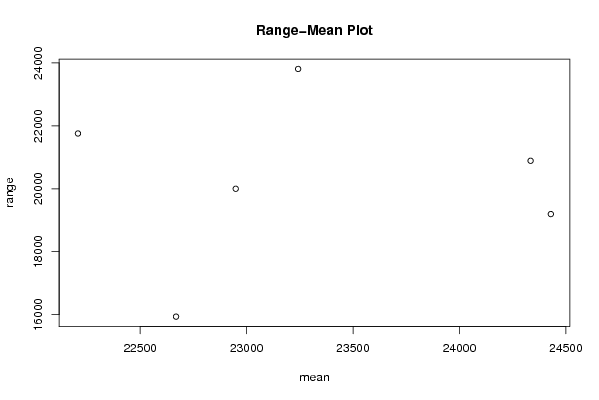
SectionMeanStandard DeviationRange
122949.08333333335573.513474189320000
2243346241.015928371120890
322668.83333333335025.7197554784215936
423242.16666666676893.0083132156923808
522208.08333333336395.8882737744921757
624429.08333333336043.1840261771319196

\begin{tabular}{lllllllll}
\hline
Standard Deviation-Mean Plot \tabularnewline
Section & Mean & Standard Deviation & Range \tabularnewline
1 & 22949.0833333333 & 5573.5134741893 & 20000 \tabularnewline
2 & 24334 & 6241.0159283711 & 20890 \tabularnewline
3 & 22668.8333333333 & 5025.71975547842 & 15936 \tabularnewline
4 & 23242.1666666667 & 6893.00831321569 & 23808 \tabularnewline
5 & 22208.0833333333 & 6395.88827377449 & 21757 \tabularnewline
6 & 24429.0833333333 & 6043.18402617713 & 19196 \tabularnewline
\hline
\end{tabular}
%Source: https://freestatistics.org/blog/index.php?pk=31202&T=1

[TABLE]
[ROW][C]Standard Deviation-Mean Plot[/C][/ROW]
[ROW][C]Section[/C][C]Mean[/C][C]Standard Deviation[/C][C]Range[/C][/ROW]
[ROW][C]1[/C][C]22949.0833333333[/C][C]5573.5134741893[/C][C]20000[/C][/ROW]
[ROW][C]2[/C][C]24334[/C][C]6241.0159283711[/C][C]20890[/C][/ROW]
[ROW][C]3[/C][C]22668.8333333333[/C][C]5025.71975547842[/C][C]15936[/C][/ROW]
[ROW][C]4[/C][C]23242.1666666667[/C][C]6893.00831321569[/C][C]23808[/C][/ROW]
[ROW][C]5[/C][C]22208.0833333333[/C][C]6395.88827377449[/C][C]21757[/C][/ROW]
[ROW][C]6[/C][C]24429.0833333333[/C][C]6043.18402617713[/C][C]19196[/C][/ROW]
[/TABLE]
Source: https://freestatistics.org/blog/index.php?pk=31202&T=1

Globally Unique Identifier (entire table): ba.freestatistics.org/blog/index.php?pk=31202&T=1

As an alternative you can also use a QR Code:  

The GUIDs for individual cells are displayed in the table below:

Standard Deviation-Mean Plot
SectionMeanStandard DeviationRange
122949.08333333335573.513474189320000
2243346241.015928371120890
322668.83333333335025.7197554784215936
423242.16666666676893.0083132156923808
522208.08333333336395.8882737744921757
624429.08333333336043.1840261771319196


Regression: S.E.(k) = alpha + beta * Mean(k)
alpha2713.14775985543
beta0.142267506098054
S.D.0.355950988081976
T-STAT0.399682852025937
p-value0.709812923097311

\begin{tabular}{lllllllll}
\hline
Regression: S.E.(k) = alpha + beta * Mean(k) \tabularnewline
alpha & 2713.14775985543 \tabularnewline
beta & 0.142267506098054 \tabularnewline
S.D. & 0.355950988081976 \tabularnewline
T-STAT & 0.399682852025937 \tabularnewline
p-value & 0.709812923097311 \tabularnewline
\hline
\end{tabular}
%Source: https://freestatistics.org/blog/index.php?pk=31202&T=2

[TABLE]
[ROW][C]Regression: S.E.(k) = alpha + beta * Mean(k)[/C][/ROW]
[ROW][C]alpha[/C][C]2713.14775985543[/C][/ROW]
[ROW][C]beta[/C][C]0.142267506098054[/C][/ROW]
[ROW][C]S.D.[/C][C]0.355950988081976[/C][/ROW]
[ROW][C]T-STAT[/C][C]0.399682852025937[/C][/ROW]
[ROW][C]p-value[/C][C]0.709812923097311[/C][/ROW]
[/TABLE]
Source: https://freestatistics.org/blog/index.php?pk=31202&T=2

Globally Unique Identifier (entire table): ba.freestatistics.org/blog/index.php?pk=31202&T=2

As an alternative you can also use a QR Code:  

The GUIDs for individual cells are displayed in the table below:

Regression: S.E.(k) = alpha + beta * Mean(k)
alpha2713.14775985543
beta0.142267506098054
S.D.0.355950988081976
T-STAT0.399682852025937
p-value0.709812923097311


Regression: ln S.E.(k) = alpha + beta * ln Mean(k)
alpha2.43354478273853
beta0.623090622428442
S.D.1.4087718377737
T-STAT0.442293496875349
p-value0.681139439478788
Lambda0.376909377571558

\begin{tabular}{lllllllll}
\hline
Regression: ln S.E.(k) = alpha + beta * ln Mean(k) \tabularnewline
alpha & 2.43354478273853 \tabularnewline
beta & 0.623090622428442 \tabularnewline
S.D. & 1.4087718377737 \tabularnewline
T-STAT & 0.442293496875349 \tabularnewline
p-value & 0.681139439478788 \tabularnewline
Lambda & 0.376909377571558 \tabularnewline
\hline
\end{tabular}
%Source: https://freestatistics.org/blog/index.php?pk=31202&T=3

[TABLE]
[ROW][C]Regression: ln S.E.(k) = alpha + beta * ln Mean(k)[/C][/ROW]
[ROW][C]alpha[/C][C]2.43354478273853[/C][/ROW]
[ROW][C]beta[/C][C]0.623090622428442[/C][/ROW]
[ROW][C]S.D.[/C][C]1.4087718377737[/C][/ROW]
[ROW][C]T-STAT[/C][C]0.442293496875349[/C][/ROW]
[ROW][C]p-value[/C][C]0.681139439478788[/C][/ROW]
[ROW][C]Lambda[/C][C]0.376909377571558[/C][/ROW]
[/TABLE]
Source: https://freestatistics.org/blog/index.php?pk=31202&T=3

Globally Unique Identifier (entire table): ba.freestatistics.org/blog/index.php?pk=31202&T=3

As an alternative you can also use a QR Code:  

The GUIDs for individual cells are displayed in the table below:

Regression: ln S.E.(k) = alpha + beta * ln Mean(k)
alpha2.43354478273853
beta0.623090622428442
S.D.1.4087718377737
T-STAT0.442293496875349
p-value0.681139439478788
Lambda0.376909377571558


Parameters (Session):
par1 = 12 ; par2 = 1 ; par3 = 0 ; par4 = 1 ; par5 = 12 ; par6 = 3 ; par7 = 0 ; par8 = 2 ; par9 = 1 ;
Parameters (R input):
par1 = 12 ; par2 = 1 ; par3 = 0 ; par4 = 1 ; par5 = 12 ; par6 = 3 ; par7 = 0 ; par8 = 2 ; par9 = 1 ; par10 = ; par11 = ; par12 = ; par13 = ; par14 = ; par15 = ; par16 = ; par17 = ; par18 = ; par19 = ; par20 = ;
R code (references can be found in the software module):
par1 <- as.numeric(par1)
(n <- length(x))
(np <- floor(n / par1))
arr <- array(NA,dim=c(par1,np))
j <- 0
k <- 1
for (i in 1:(np*par1))
{
j = j + 1
arr[j,k] <- x[i]
if (j == par1) {
j = 0
k=k+1
}
}
arr
arr.mean <- array(NA,dim=np)
arr.sd <- array(NA,dim=np)
arr.range <- array(NA,dim=np)
for (j in 1:np)
{
arr.mean[j] <- mean(arr[,j],na.rm=TRUE)
arr.sd[j] <- sd(arr[,j],na.rm=TRUE)
arr.range[j] <- max(arr[,j],na.rm=TRUE) - min(arr[,j],na.rm=TRUE)
}
arr.mean
arr.sd
arr.range
(lm1 <- lm(arr.sd~arr.mean))
(lnlm1 <- lm(log(arr.sd)~log(arr.mean)))
(lm2 <- lm(arr.range~arr.mean))
bitmap(file='test1.png')
plot(arr.mean,arr.sd,main='Standard Deviation-Mean Plot',xlab='mean',ylab='standard deviation')
dev.off()
bitmap(file='test2.png')
plot(arr.mean,arr.range,main='Range-Mean Plot',xlab='mean',ylab='range')
dev.off()
load(file='createtable')
a<-table.start()
a<-table.row.start(a)
a<-table.element(a,'Standard Deviation-Mean Plot',4,TRUE)
a<-table.row.end(a)
a<-table.row.start(a)
a<-table.element(a,'Section',header=TRUE)
a<-table.element(a,'Mean',header=TRUE)
a<-table.element(a,'Standard Deviation',header=TRUE)
a<-table.element(a,'Range',header=TRUE)
a<-table.row.end(a)
for (j in 1:np) {
a<-table.row.start(a)
a<-table.element(a,j,header=TRUE)
a<-table.element(a,arr.mean[j])
a<-table.element(a,arr.sd[j] )
a<-table.element(a,arr.range[j] )
a<-table.row.end(a)
}
a<-table.end(a)
table.save(a,file='mytable.tab')
a<-table.start()
a<-table.row.start(a)
a<-table.element(a,'Regression: S.E.(k) = alpha + beta * Mean(k)',2,TRUE)
a<-table.row.end(a)
a<-table.row.start(a)
a<-table.element(a,'alpha',header=TRUE)
a<-table.element(a,lm1$coefficients[[1]])
a<-table.row.end(a)
a<-table.row.start(a)
a<-table.element(a,'beta',header=TRUE)
a<-table.element(a,lm1$coefficients[[2]])
a<-table.row.end(a)
a<-table.row.start(a)
a<-table.element(a,'S.D.',header=TRUE)
a<-table.element(a,summary(lm1)$coefficients[2,2])
a<-table.row.end(a)
a<-table.row.start(a)
a<-table.element(a,'T-STAT',header=TRUE)
a<-table.element(a,summary(lm1)$coefficients[2,3])
a<-table.row.end(a)
a<-table.row.start(a)
a<-table.element(a,'p-value',header=TRUE)
a<-table.element(a,summary(lm1)$coefficients[2,4])
a<-table.row.end(a)
a<-table.end(a)
table.save(a,file='mytable1.tab')
a<-table.start()
a<-table.row.start(a)
a<-table.element(a,'Regression: ln S.E.(k) = alpha + beta * ln Mean(k)',2,TRUE)
a<-table.row.end(a)
a<-table.row.start(a)
a<-table.element(a,'alpha',header=TRUE)
a<-table.element(a,lnlm1$coefficients[[1]])
a<-table.row.end(a)
a<-table.row.start(a)
a<-table.element(a,'beta',header=TRUE)
a<-table.element(a,lnlm1$coefficients[[2]])
a<-table.row.end(a)
a<-table.row.start(a)
a<-table.element(a,'S.D.',header=TRUE)
a<-table.element(a,summary(lnlm1)$coefficients[2,2])
a<-table.row.end(a)
a<-table.row.start(a)
a<-table.element(a,'T-STAT',header=TRUE)
a<-table.element(a,summary(lnlm1)$coefficients[2,3])
a<-table.row.end(a)
a<-table.row.start(a)
a<-table.element(a,'p-value',header=TRUE)
a<-table.element(a,summary(lnlm1)$coefficients[2,4])
a<-table.row.end(a)
a<-table.row.start(a)
a<-table.element(a,'Lambda',header=TRUE)
a<-table.element(a,1-lnlm1$coefficients[[2]])
a<-table.row.end(a)
a<-table.end(a)
table.save(a,file='mytable2.tab')