Free Statistics

of Irreproducible Research!

Author's title

Author*The author of this computation has been verified*
R Software Modulerwasp_arimabackwardselection.wasp
Title produced by softwareARIMA Backward Selection
Date of computationMon, 08 Dec 2008 15:32:26 -0700
Cite this page as followsStatistical Computations at FreeStatistics.org, Office for Research Development and Education, URL https://freestatistics.org/blog/index.php?v=date/2008/Dec/08/t1228775594spmbn2dcyih7tbn.htm/, Retrieved Thu, 16 May 2024 04:51:40 +0000
Statistical Computations at FreeStatistics.org, Office for Research Development and Education, URL https://freestatistics.org/blog/index.php?pk=31103, Retrieved Thu, 16 May 2024 04:51:40 +0000
QR Codes:

Original text written by user:
IsPrivate?No (this computation is public)
User-defined keywords
Estimated Impact194
Family? (F = Feedback message, R = changed R code, M = changed R Module, P = changed Parameters, D = changed Data)
F     [Univariate Data Series] [blog 1e tijdreeks...] [2008-10-13 19:23:31] [7173087adebe3e3a714c80ea2417b3eb]
-   PD  [Univariate Data Series] [tijdreeksen opnie...] [2008-10-19 17:13:12] [7173087adebe3e3a714c80ea2417b3eb]
-   PD    [Univariate Data Series] [tijdreeksen opnie...] [2008-10-19 18:55:20] [7173087adebe3e3a714c80ea2417b3eb]
- RM        [Central Tendency] [central tendency ...] [2008-10-19 19:10:37] [7173087adebe3e3a714c80ea2417b3eb]
- RMP           [ARIMA Backward Selection] [step 5 arima back...] [2008-12-08 22:32:26] [95d95b0e883740fcbc85e18ec42dcafb] [Current]
- RMP             [ARIMA Forecasting] [Arima forecasting...] [2008-12-22 13:03:25] [c993f605b206b366f754f7f8c1fcc291]
Feedback Forum

Post a new message
Dataseries X:
5014
6153
6441
5584
6427
6062
5589
6216
5809
4989
6706
7174
6122
8075
6292
6337
8576
6077
5931
6288
7167
6054
6468
6401
6927
7914
7728
8699
8522
6481
7502
7778
7424
6941
8574
9169
7701
9035
7158
8195
8124
7073
7017
7390
7776
6197
6889
7087
6485
7654
6501
6313
7826
6589
6729
5684
8105
6391
5901
6758


Summary of computational transaction
Raw Inputview raw input (R code)
Raw Outputview raw output of R engine
Computing time11 seconds
R Server'Sir Ronald Aylmer Fisher' @ 193.190.124.24

\begin{tabular}{lllllllll}
\hline
Summary of computational transaction \tabularnewline
Raw Input & view raw input (R code)  \tabularnewline
Raw Output & view raw output of R engine  \tabularnewline
Computing time & 11 seconds \tabularnewline
R Server & 'Sir Ronald Aylmer Fisher' @ 193.190.124.24 \tabularnewline
\hline
\end{tabular}
%Source: https://freestatistics.org/blog/index.php?pk=31103&T=0

[TABLE]
[ROW][C]Summary of computational transaction[/C][/ROW]
[ROW][C]Raw Input[/C][C]view raw input (R code) [/C][/ROW]
[ROW][C]Raw Output[/C][C]view raw output of R engine [/C][/ROW]
[ROW][C]Computing time[/C][C]11 seconds[/C][/ROW]
[ROW][C]R Server[/C][C]'Sir Ronald Aylmer Fisher' @ 193.190.124.24[/C][/ROW]
[/TABLE]
Source: https://freestatistics.org/blog/index.php?pk=31103&T=0

Globally Unique Identifier (entire table): ba.freestatistics.org/blog/index.php?pk=31103&T=0

As an alternative you can also use a QR Code:  

The GUIDs for individual cells are displayed in the table below:

Summary of computational transaction
Raw Inputview raw input (R code)
Raw Outputview raw output of R engine
Computing time11 seconds
R Server'Sir Ronald Aylmer Fisher' @ 193.190.124.24


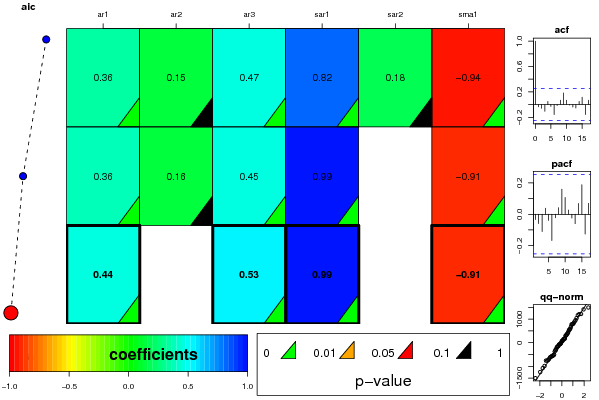
ARIMA Parameter Estimation and Backward Selection
Iterationar1ar2ar3sar1sar2sma1
Estimates ( 1 )0.35560.14990.46770.81950.1786-0.9414
(p-val)(0.004 )(0.239 )(2e-04 )(0 )(0.3224 )(0.0022 )
Estimates ( 2 )0.36450.15540.45330.99390-0.9127
(p-val)(0.0033 )(0.2258 )(3e-04 )(0 )(NA )(0 )
Estimates ( 3 )0.443500.52670.99420-0.9067
(p-val)(0 )(NA )(0 )(0 )(NA )(0 )
Estimates ( 4 )NANANANANANA
(p-val)(NA )(NA )(NA )(NA )(NA )(NA )
Estimates ( 5 )NANANANANANA
(p-val)(NA )(NA )(NA )(NA )(NA )(NA )
Estimates ( 6 )NANANANANANA
(p-val)(NA )(NA )(NA )(NA )(NA )(NA )
Estimates ( 7 )NANANANANANA
(p-val)(NA )(NA )(NA )(NA )(NA )(NA )
Estimates ( 8 )NANANANANANA
(p-val)(NA )(NA )(NA )(NA )(NA )(NA )
Estimates ( 9 )NANANANANANA
(p-val)(NA )(NA )(NA )(NA )(NA )(NA )
Estimates ( 10 )NANANANANANA
(p-val)(NA )(NA )(NA )(NA )(NA )(NA )
Estimates ( 11 )NANANANANANA
(p-val)(NA )(NA )(NA )(NA )(NA )(NA )

\begin{tabular}{lllllllll}
\hline
ARIMA Parameter Estimation and Backward Selection \tabularnewline
Iteration & ar1 & ar2 & ar3 & sar1 & sar2 & sma1 \tabularnewline
Estimates ( 1 ) & 0.3556 & 0.1499 & 0.4677 & 0.8195 & 0.1786 & -0.9414 \tabularnewline
(p-val) & (0.004 ) & (0.239 ) & (2e-04 ) & (0 ) & (0.3224 ) & (0.0022 ) \tabularnewline
Estimates ( 2 ) & 0.3645 & 0.1554 & 0.4533 & 0.9939 & 0 & -0.9127 \tabularnewline
(p-val) & (0.0033 ) & (0.2258 ) & (3e-04 ) & (0 ) & (NA ) & (0 ) \tabularnewline
Estimates ( 3 ) & 0.4435 & 0 & 0.5267 & 0.9942 & 0 & -0.9067 \tabularnewline
(p-val) & (0 ) & (NA ) & (0 ) & (0 ) & (NA ) & (0 ) \tabularnewline
Estimates ( 4 ) & NA & NA & NA & NA & NA & NA \tabularnewline
(p-val) & (NA ) & (NA ) & (NA ) & (NA ) & (NA ) & (NA ) \tabularnewline
Estimates ( 5 ) & NA & NA & NA & NA & NA & NA \tabularnewline
(p-val) & (NA ) & (NA ) & (NA ) & (NA ) & (NA ) & (NA ) \tabularnewline
Estimates ( 6 ) & NA & NA & NA & NA & NA & NA \tabularnewline
(p-val) & (NA ) & (NA ) & (NA ) & (NA ) & (NA ) & (NA ) \tabularnewline
Estimates ( 7 ) & NA & NA & NA & NA & NA & NA \tabularnewline
(p-val) & (NA ) & (NA ) & (NA ) & (NA ) & (NA ) & (NA ) \tabularnewline
Estimates ( 8 ) & NA & NA & NA & NA & NA & NA \tabularnewline
(p-val) & (NA ) & (NA ) & (NA ) & (NA ) & (NA ) & (NA ) \tabularnewline
Estimates ( 9 ) & NA & NA & NA & NA & NA & NA \tabularnewline
(p-val) & (NA ) & (NA ) & (NA ) & (NA ) & (NA ) & (NA ) \tabularnewline
Estimates ( 10 ) & NA & NA & NA & NA & NA & NA \tabularnewline
(p-val) & (NA ) & (NA ) & (NA ) & (NA ) & (NA ) & (NA ) \tabularnewline
Estimates ( 11 ) & NA & NA & NA & NA & NA & NA \tabularnewline
(p-val) & (NA ) & (NA ) & (NA ) & (NA ) & (NA ) & (NA ) \tabularnewline
\hline
\end{tabular}
%Source: https://freestatistics.org/blog/index.php?pk=31103&T=1

[TABLE]
[ROW][C]ARIMA Parameter Estimation and Backward Selection[/C][/ROW]
[ROW][C]Iteration[/C][C]ar1[/C][C]ar2[/C][C]ar3[/C][C]sar1[/C][C]sar2[/C][C]sma1[/C][/ROW]
[ROW][C]Estimates ( 1 )[/C][C]0.3556[/C][C]0.1499[/C][C]0.4677[/C][C]0.8195[/C][C]0.1786[/C][C]-0.9414[/C][/ROW]
[ROW][C](p-val)[/C][C](0.004 )[/C][C](0.239 )[/C][C](2e-04 )[/C][C](0 )[/C][C](0.3224 )[/C][C](0.0022 )[/C][/ROW]
[ROW][C]Estimates ( 2 )[/C][C]0.3645[/C][C]0.1554[/C][C]0.4533[/C][C]0.9939[/C][C]0[/C][C]-0.9127[/C][/ROW]
[ROW][C](p-val)[/C][C](0.0033 )[/C][C](0.2258 )[/C][C](3e-04 )[/C][C](0 )[/C][C](NA )[/C][C](0 )[/C][/ROW]
[ROW][C]Estimates ( 3 )[/C][C]0.4435[/C][C]0[/C][C]0.5267[/C][C]0.9942[/C][C]0[/C][C]-0.9067[/C][/ROW]
[ROW][C](p-val)[/C][C](0 )[/C][C](NA )[/C][C](0 )[/C][C](0 )[/C][C](NA )[/C][C](0 )[/C][/ROW]
[ROW][C]Estimates ( 4 )[/C][C]NA[/C][C]NA[/C][C]NA[/C][C]NA[/C][C]NA[/C][C]NA[/C][/ROW]
[ROW][C](p-val)[/C][C](NA )[/C][C](NA )[/C][C](NA )[/C][C](NA )[/C][C](NA )[/C][C](NA )[/C][/ROW]
[ROW][C]Estimates ( 5 )[/C][C]NA[/C][C]NA[/C][C]NA[/C][C]NA[/C][C]NA[/C][C]NA[/C][/ROW]
[ROW][C](p-val)[/C][C](NA )[/C][C](NA )[/C][C](NA )[/C][C](NA )[/C][C](NA )[/C][C](NA )[/C][/ROW]
[ROW][C]Estimates ( 6 )[/C][C]NA[/C][C]NA[/C][C]NA[/C][C]NA[/C][C]NA[/C][C]NA[/C][/ROW]
[ROW][C](p-val)[/C][C](NA )[/C][C](NA )[/C][C](NA )[/C][C](NA )[/C][C](NA )[/C][C](NA )[/C][/ROW]
[ROW][C]Estimates ( 7 )[/C][C]NA[/C][C]NA[/C][C]NA[/C][C]NA[/C][C]NA[/C][C]NA[/C][/ROW]
[ROW][C](p-val)[/C][C](NA )[/C][C](NA )[/C][C](NA )[/C][C](NA )[/C][C](NA )[/C][C](NA )[/C][/ROW]
[ROW][C]Estimates ( 8 )[/C][C]NA[/C][C]NA[/C][C]NA[/C][C]NA[/C][C]NA[/C][C]NA[/C][/ROW]
[ROW][C](p-val)[/C][C](NA )[/C][C](NA )[/C][C](NA )[/C][C](NA )[/C][C](NA )[/C][C](NA )[/C][/ROW]
[ROW][C]Estimates ( 9 )[/C][C]NA[/C][C]NA[/C][C]NA[/C][C]NA[/C][C]NA[/C][C]NA[/C][/ROW]
[ROW][C](p-val)[/C][C](NA )[/C][C](NA )[/C][C](NA )[/C][C](NA )[/C][C](NA )[/C][C](NA )[/C][/ROW]
[ROW][C]Estimates ( 10 )[/C][C]NA[/C][C]NA[/C][C]NA[/C][C]NA[/C][C]NA[/C][C]NA[/C][/ROW]
[ROW][C](p-val)[/C][C](NA )[/C][C](NA )[/C][C](NA )[/C][C](NA )[/C][C](NA )[/C][C](NA )[/C][/ROW]
[ROW][C]Estimates ( 11 )[/C][C]NA[/C][C]NA[/C][C]NA[/C][C]NA[/C][C]NA[/C][C]NA[/C][/ROW]
[ROW][C](p-val)[/C][C](NA )[/C][C](NA )[/C][C](NA )[/C][C](NA )[/C][C](NA )[/C][C](NA )[/C][/ROW]
[/TABLE]
Source: https://freestatistics.org/blog/index.php?pk=31103&T=1

Globally Unique Identifier (entire table): ba.freestatistics.org/blog/index.php?pk=31103&T=1

As an alternative you can also use a QR Code:  

The GUIDs for individual cells are displayed in the table below:

ARIMA Parameter Estimation and Backward Selection
Iterationar1ar2ar3sar1sar2sma1
Estimates ( 1 )0.35560.14990.46770.81950.1786-0.9414
(p-val)(0.004 )(0.239 )(2e-04 )(0 )(0.3224 )(0.0022 )
Estimates ( 2 )0.36450.15540.45330.99390-0.9127
(p-val)(0.0033 )(0.2258 )(3e-04 )(0 )(NA )(0 )
Estimates ( 3 )0.443500.52670.99420-0.9067
(p-val)(0 )(NA )(0 )(0 )(NA )(0 )
Estimates ( 4 )NANANANANANA
(p-val)(NA )(NA )(NA )(NA )(NA )(NA )
Estimates ( 5 )NANANANANANA
(p-val)(NA )(NA )(NA )(NA )(NA )(NA )
Estimates ( 6 )NANANANANANA
(p-val)(NA )(NA )(NA )(NA )(NA )(NA )
Estimates ( 7 )NANANANANANA
(p-val)(NA )(NA )(NA )(NA )(NA )(NA )
Estimates ( 8 )NANANANANANA
(p-val)(NA )(NA )(NA )(NA )(NA )(NA )
Estimates ( 9 )NANANANANANA
(p-val)(NA )(NA )(NA )(NA )(NA )(NA )
Estimates ( 10 )NANANANANANA
(p-val)(NA )(NA )(NA )(NA )(NA )(NA )
Estimates ( 11 )NANANANANANA
(p-val)(NA )(NA )(NA )(NA )(NA )(NA )


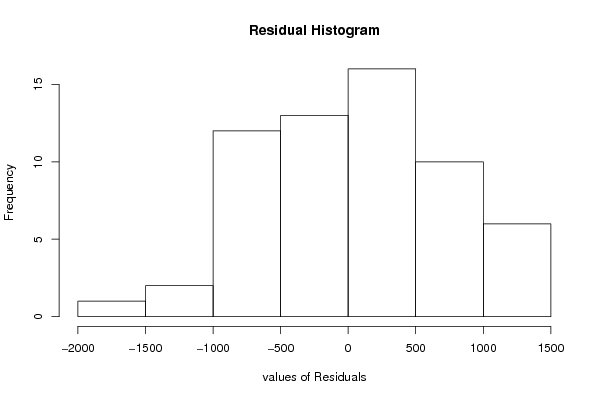
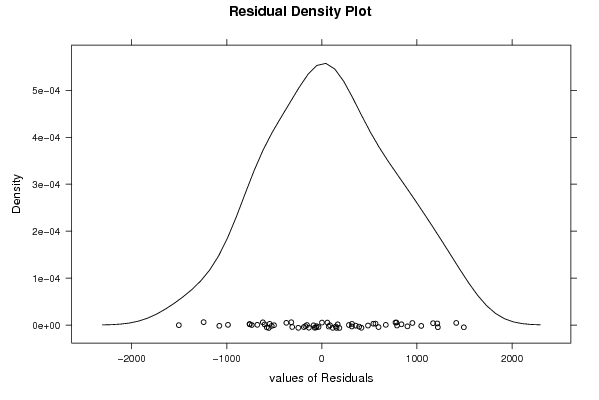
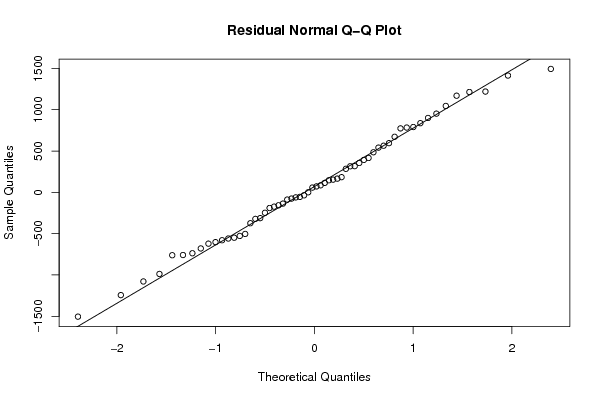
Estimated ARIMA Residuals
Value
563.725696516693
783.653008354102
595.261775177299
-75.820104352658
391.786374476063
-136.532561659245
-189.925037431247
146.093509928303
-156.768950456472
-549.096721520569
773.774549027428
951.818601588902
315.269797036984
1219.17830150515
-987.587818318475
0.658725668052042
1213.71040863093
-758.414836338668
-373.980429388314
-761.018104645527
1044.94855562953
57.4446709255112
-173.496351810174
-679.100116514532
790.09314732197
671.883569232187
836.59900004467
1412.82483501314
-35.7404595328165
-1078.46360021129
84.8194586086482
284.328232890318
165.540273138731
-61.2866429588647
899.725380030242
1168.99778381996
-247.786956396662
71.5110466502374
-1504.26541548529
354.960133319758
-621.135188696585
153.530024681546
-312.329893716170
114.129089772532
415.886385007407
-602.542231368515
-503.73320809522
-527.767868625491
-87.5592519601124
183.517388083124
-321.471814935695
-558.793266651984
540.743648643515
316.70001697126
484.786098301765
-1243.88933090246
1492.75743407258
-55.5557280406086
-737.296932711403
-579.569507801769

\begin{tabular}{lllllllll}
\hline
Estimated ARIMA Residuals \tabularnewline
Value \tabularnewline
 \tabularnewline
563.725696516693 \tabularnewline
783.653008354102 \tabularnewline
595.261775177299 \tabularnewline
-75.820104352658 \tabularnewline
391.786374476063 \tabularnewline
-136.532561659245 \tabularnewline
-189.925037431247 \tabularnewline
146.093509928303 \tabularnewline
-156.768950456472 \tabularnewline
-549.096721520569 \tabularnewline
773.774549027428 \tabularnewline
951.818601588902 \tabularnewline
315.269797036984 \tabularnewline
1219.17830150515 \tabularnewline
-987.587818318475 \tabularnewline
0.658725668052042 \tabularnewline
1213.71040863093 \tabularnewline
-758.414836338668 \tabularnewline
-373.980429388314 \tabularnewline
-761.018104645527 \tabularnewline
1044.94855562953 \tabularnewline
57.4446709255112 \tabularnewline
-173.496351810174 \tabularnewline
-679.100116514532 \tabularnewline
790.09314732197 \tabularnewline
671.883569232187 \tabularnewline
836.59900004467 \tabularnewline
1412.82483501314 \tabularnewline
-35.7404595328165 \tabularnewline
-1078.46360021129 \tabularnewline
84.8194586086482 \tabularnewline
284.328232890318 \tabularnewline
165.540273138731 \tabularnewline
-61.2866429588647 \tabularnewline
899.725380030242 \tabularnewline
1168.99778381996 \tabularnewline
-247.786956396662 \tabularnewline
71.5110466502374 \tabularnewline
-1504.26541548529 \tabularnewline
354.960133319758 \tabularnewline
-621.135188696585 \tabularnewline
153.530024681546 \tabularnewline
-312.329893716170 \tabularnewline
114.129089772532 \tabularnewline
415.886385007407 \tabularnewline
-602.542231368515 \tabularnewline
-503.73320809522 \tabularnewline
-527.767868625491 \tabularnewline
-87.5592519601124 \tabularnewline
183.517388083124 \tabularnewline
-321.471814935695 \tabularnewline
-558.793266651984 \tabularnewline
540.743648643515 \tabularnewline
316.70001697126 \tabularnewline
484.786098301765 \tabularnewline
-1243.88933090246 \tabularnewline
1492.75743407258 \tabularnewline
-55.5557280406086 \tabularnewline
-737.296932711403 \tabularnewline
-579.569507801769 \tabularnewline
\hline
\end{tabular}
%Source: https://freestatistics.org/blog/index.php?pk=31103&T=2

[TABLE]
[ROW][C]Estimated ARIMA Residuals[/C][/ROW]
[ROW][C]Value[/C][/ROW]
[ROW][C][/C][/ROW]
[ROW][C]563.725696516693[/C][/ROW]
[ROW][C]783.653008354102[/C][/ROW]
[ROW][C]595.261775177299[/C][/ROW]
[ROW][C]-75.820104352658[/C][/ROW]
[ROW][C]391.786374476063[/C][/ROW]
[ROW][C]-136.532561659245[/C][/ROW]
[ROW][C]-189.925037431247[/C][/ROW]
[ROW][C]146.093509928303[/C][/ROW]
[ROW][C]-156.768950456472[/C][/ROW]
[ROW][C]-549.096721520569[/C][/ROW]
[ROW][C]773.774549027428[/C][/ROW]
[ROW][C]951.818601588902[/C][/ROW]
[ROW][C]315.269797036984[/C][/ROW]
[ROW][C]1219.17830150515[/C][/ROW]
[ROW][C]-987.587818318475[/C][/ROW]
[ROW][C]0.658725668052042[/C][/ROW]
[ROW][C]1213.71040863093[/C][/ROW]
[ROW][C]-758.414836338668[/C][/ROW]
[ROW][C]-373.980429388314[/C][/ROW]
[ROW][C]-761.018104645527[/C][/ROW]
[ROW][C]1044.94855562953[/C][/ROW]
[ROW][C]57.4446709255112[/C][/ROW]
[ROW][C]-173.496351810174[/C][/ROW]
[ROW][C]-679.100116514532[/C][/ROW]
[ROW][C]790.09314732197[/C][/ROW]
[ROW][C]671.883569232187[/C][/ROW]
[ROW][C]836.59900004467[/C][/ROW]
[ROW][C]1412.82483501314[/C][/ROW]
[ROW][C]-35.7404595328165[/C][/ROW]
[ROW][C]-1078.46360021129[/C][/ROW]
[ROW][C]84.8194586086482[/C][/ROW]
[ROW][C]284.328232890318[/C][/ROW]
[ROW][C]165.540273138731[/C][/ROW]
[ROW][C]-61.2866429588647[/C][/ROW]
[ROW][C]899.725380030242[/C][/ROW]
[ROW][C]1168.99778381996[/C][/ROW]
[ROW][C]-247.786956396662[/C][/ROW]
[ROW][C]71.5110466502374[/C][/ROW]
[ROW][C]-1504.26541548529[/C][/ROW]
[ROW][C]354.960133319758[/C][/ROW]
[ROW][C]-621.135188696585[/C][/ROW]
[ROW][C]153.530024681546[/C][/ROW]
[ROW][C]-312.329893716170[/C][/ROW]
[ROW][C]114.129089772532[/C][/ROW]
[ROW][C]415.886385007407[/C][/ROW]
[ROW][C]-602.542231368515[/C][/ROW]
[ROW][C]-503.73320809522[/C][/ROW]
[ROW][C]-527.767868625491[/C][/ROW]
[ROW][C]-87.5592519601124[/C][/ROW]
[ROW][C]183.517388083124[/C][/ROW]
[ROW][C]-321.471814935695[/C][/ROW]
[ROW][C]-558.793266651984[/C][/ROW]
[ROW][C]540.743648643515[/C][/ROW]
[ROW][C]316.70001697126[/C][/ROW]
[ROW][C]484.786098301765[/C][/ROW]
[ROW][C]-1243.88933090246[/C][/ROW]
[ROW][C]1492.75743407258[/C][/ROW]
[ROW][C]-55.5557280406086[/C][/ROW]
[ROW][C]-737.296932711403[/C][/ROW]
[ROW][C]-579.569507801769[/C][/ROW]
[/TABLE]
Source: https://freestatistics.org/blog/index.php?pk=31103&T=2

Globally Unique Identifier (entire table): ba.freestatistics.org/blog/index.php?pk=31103&T=2

As an alternative you can also use a QR Code:  

The GUIDs for individual cells are displayed in the table below:

Estimated ARIMA Residuals
Value
563.725696516693
783.653008354102
595.261775177299
-75.820104352658
391.786374476063
-136.532561659245
-189.925037431247
146.093509928303
-156.768950456472
-549.096721520569
773.774549027428
951.818601588902
315.269797036984
1219.17830150515
-987.587818318475
0.658725668052042
1213.71040863093
-758.414836338668
-373.980429388314
-761.018104645527
1044.94855562953
57.4446709255112
-173.496351810174
-679.100116514532
790.09314732197
671.883569232187
836.59900004467
1412.82483501314
-35.7404595328165
-1078.46360021129
84.8194586086482
284.328232890318
165.540273138731
-61.2866429588647
899.725380030242
1168.99778381996
-247.786956396662
71.5110466502374
-1504.26541548529
354.960133319758
-621.135188696585
153.530024681546
-312.329893716170
114.129089772532
415.886385007407
-602.542231368515
-503.73320809522
-527.767868625491
-87.5592519601124
183.517388083124
-321.471814935695
-558.793266651984
540.743648643515
316.70001697126
484.786098301765
-1243.88933090246
1492.75743407258
-55.5557280406086
-737.296932711403
-579.569507801769


Parameters (Session):
par1 = FALSE ; par2 = 1 ; par3 = 0 ; par4 = 0 ; par5 = 12 ; par6 = 3 ; par7 = 0 ; par8 = 2 ; par9 = 1 ;
Parameters (R input):
par1 = FALSE ; par2 = 1 ; par3 = 0 ; par4 = 0 ; par5 = 12 ; par6 = 3 ; par7 = 0 ; par8 = 2 ; par9 = 1 ;
R code (references can be found in the software module):
library(lattice)
if (par1 == 'TRUE') par1 <- TRUE
if (par1 == 'FALSE') par1 <- FALSE
par2 <- as.numeric(par2) #Box-Cox lambda transformation parameter
par3 <- as.numeric(par3) #degree of non-seasonal differencing
par4 <- as.numeric(par4) #degree of seasonal differencing
par5 <- as.numeric(par5) #seasonal period
par6 <- as.numeric(par6) #degree (p) of the non-seasonal AR(p) polynomial
par7 <- as.numeric(par7) #degree (q) of the non-seasonal MA(q) polynomial
par8 <- as.numeric(par8) #degree (P) of the seasonal AR(P) polynomial
par9 <- as.numeric(par9) #degree (Q) of the seasonal MA(Q) polynomial
armaGR <- function(arima.out, names, n){
try1 <- arima.out$coef
try2 <- sqrt(diag(arima.out$var.coef))
try.data.frame <- data.frame(matrix(NA,ncol=4,nrow=length(names)))
dimnames(try.data.frame) <- list(names,c('coef','std','tstat','pv'))
try.data.frame[,1] <- try1
for(i in 1:length(try2)) try.data.frame[which(rownames(try.data.frame)==names(try2)[i]),2] <- try2[i]
try.data.frame[,3] <- try.data.frame[,1] / try.data.frame[,2]
try.data.frame[,4] <- round((1-pt(abs(try.data.frame[,3]),df=n-(length(try2)+1)))*2,5)
vector <- rep(NA,length(names))
vector[is.na(try.data.frame[,4])] <- 0
maxi <- which.max(try.data.frame[,4])
continue <- max(try.data.frame[,4],na.rm=TRUE) > .05
vector[maxi] <- 0
list(summary=try.data.frame,next.vector=vector,continue=continue)
}
arimaSelect <- function(series, order=c(13,0,0), seasonal=list(order=c(2,0,0),period=12), include.mean=F){
nrc <- order[1]+order[3]+seasonal$order[1]+seasonal$order[3]
coeff <- matrix(NA, nrow=nrc*2, ncol=nrc)
pval <- matrix(NA, nrow=nrc*2, ncol=nrc)
mylist <- rep(list(NULL), nrc)
names <- NULL
if(order[1] > 0) names <- paste('ar',1:order[1],sep='')
if(order[3] > 0) names <- c( names , paste('ma',1:order[3],sep='') )
if(seasonal$order[1] > 0) names <- c(names, paste('sar',1:seasonal$order[1],sep=''))
if(seasonal$order[3] > 0) names <- c(names, paste('sma',1:seasonal$order[3],sep=''))
arima.out <- arima(series, order=order, seasonal=seasonal, include.mean=include.mean, method='ML')
mylist[[1]] <- arima.out
last.arma <- armaGR(arima.out, names, length(series))
mystop <- FALSE
i <- 1
coeff[i,] <- last.arma[[1]][,1]
pval [i,] <- last.arma[[1]][,4]
i <- 2
aic <- arima.out$aic
while(!mystop){
mylist[[i]] <- arima.out
arima.out <- arima(series, order=order, seasonal=seasonal, include.mean=include.mean, method='ML', fixed=last.arma$next.vector)
aic <- c(aic, arima.out$aic)
last.arma <- armaGR(arima.out, names, length(series))
mystop <- !last.arma$continue
coeff[i,] <- last.arma[[1]][,1]
pval [i,] <- last.arma[[1]][,4]
i <- i+1
}
list(coeff, pval, mylist, aic=aic)
}
arimaSelectplot <- function(arimaSelect.out,noms,choix){
noms <- names(arimaSelect.out[[3]][[1]]$coef)
coeff <- arimaSelect.out[[1]]
k <- min(which(is.na(coeff[,1])))-1
coeff <- coeff[1:k,]
pval <- arimaSelect.out[[2]][1:k,]
aic <- arimaSelect.out$aic[1:k]
coeff[coeff==0] <- NA
n <- ncol(coeff)
if(missing(choix)) choix <- k
layout(matrix(c(1,1,1,2,
3,3,3,2,
3,3,3,4,
5,6,7,7),nr=4),
widths=c(10,35,45,15),
heights=c(30,30,15,15))
couleurs <- rainbow(75)[1:50]#(50)
ticks <- pretty(coeff)
par(mar=c(1,1,3,1))
plot(aic,k:1-.5,type='o',pch=21,bg='blue',cex=2,axes=F,lty=2,xpd=NA)
points(aic[choix],k-choix+.5,pch=21,cex=4,bg=2,xpd=NA)
title('aic',line=2)
par(mar=c(3,0,0,0))
plot(0,axes=F,xlab='',ylab='',xlim=range(ticks),ylim=c(.1,1))
rect(xleft = min(ticks) + (0:49)/50*(max(ticks)-min(ticks)),
xright = min(ticks) + (1:50)/50*(max(ticks)-min(ticks)),
ytop = rep(1,50),
ybottom= rep(0,50),col=couleurs,border=NA)
axis(1,ticks)
rect(xleft=min(ticks),xright=max(ticks),ytop=1,ybottom=0)
text(mean(coeff,na.rm=T),.5,'coefficients',cex=2,font=2)
par(mar=c(1,1,3,1))
image(1:n,1:k,t(coeff[k:1,]),axes=F,col=couleurs,zlim=range(ticks))
for(i in 1:n) for(j in 1:k) if(!is.na(coeff[j,i])) {
if(pval[j,i]<.01) symb = 'green'
else if( (pval[j,i]<.05) & (pval[j,i]>=.01)) symb = 'orange'
else if( (pval[j,i]<.1) & (pval[j,i]>=.05)) symb = 'red'
else symb = 'black'
polygon(c(i+.5 ,i+.2 ,i+.5 ,i+.5),
c(k-j+0.5,k-j+0.5,k-j+0.8,k-j+0.5),
col=symb)
if(j==choix) {
rect(xleft=i-.5,
xright=i+.5,
ybottom=k-j+1.5,
ytop=k-j+.5,
lwd=4)
text(i,
k-j+1,
round(coeff[j,i],2),
cex=1.2,
font=2)
}
else{
rect(xleft=i-.5,xright=i+.5,ybottom=k-j+1.5,ytop=k-j+.5)
text(i,k-j+1,round(coeff[j,i],2),cex=1.2,font=1)
}
}
axis(3,1:n,noms)
par(mar=c(0.5,0,0,0.5))
plot(0,axes=F,xlab='',ylab='',type='n',xlim=c(0,8),ylim=c(-.2,.8))
cols <- c('green','orange','red','black')
niv <- c('0','0.01','0.05','0.1')
for(i in 0:3){
polygon(c(1+2*i ,1+2*i ,1+2*i-.5 ,1+2*i),
c(.4 ,.7 , .4 , .4),
col=cols[i+1])
text(2*i,0.5,niv[i+1],cex=1.5)
}
text(8,.5,1,cex=1.5)
text(4,0,'p-value',cex=2)
box()
residus <- arimaSelect.out[[3]][[choix]]$res
par(mar=c(1,2,4,1))
acf(residus,main='')
title('acf',line=.5)
par(mar=c(1,2,4,1))
pacf(residus,main='')
title('pacf',line=.5)
par(mar=c(2,2,4,1))
qqnorm(residus,main='')
title('qq-norm',line=.5)
qqline(residus)
residus
}
if (par2 == 0) x <- log(x)
if (par2 != 0) x <- x^par2
(selection <- arimaSelect(x, order=c(par6,par3,par7), seasonal=list(order=c(par8,par4,par9), period=par5)))
bitmap(file='test1.png')
resid <- arimaSelectplot(selection)
dev.off()
resid
bitmap(file='test2.png')
acf(resid,length(resid)/2, main='Residual Autocorrelation Function')
dev.off()
bitmap(file='test3.png')
pacf(resid,length(resid)/2, main='Residual Partial Autocorrelation Function')
dev.off()
bitmap(file='test4.png')
cpgram(resid, main='Residual Cumulative Periodogram')
dev.off()
bitmap(file='test5.png')
hist(resid, main='Residual Histogram', xlab='values of Residuals')
dev.off()
bitmap(file='test6.png')
densityplot(~resid,col='black',main='Residual Density Plot', xlab='values of Residuals')
dev.off()
bitmap(file='test7.png')
qqnorm(resid, main='Residual Normal Q-Q Plot')
qqline(resid)
dev.off()
ncols <- length(selection[[1]][1,])
nrows <- length(selection[[2]][,1])-1
load(file='createtable')
a<-table.start()
a<-table.row.start(a)
a<-table.element(a,'ARIMA Parameter Estimation and Backward Selection', ncols+1,TRUE)
a<-table.row.end(a)
a<-table.row.start(a)
a<-table.element(a,'Iteration', header=TRUE)
for (i in 1:ncols) {
a<-table.element(a,names(selection[[3]][[1]]$coef)[i],header=TRUE)
}
a<-table.row.end(a)
for (j in 1:nrows) {
a<-table.row.start(a)
mydum <- 'Estimates ('
mydum <- paste(mydum,j)
mydum <- paste(mydum,')')
a<-table.element(a,mydum, header=TRUE)
for (i in 1:ncols) {
a<-table.element(a,round(selection[[1]][j,i],4))
}
a<-table.row.end(a)
a<-table.row.start(a)
a<-table.element(a,'(p-val)', header=TRUE)
for (i in 1:ncols) {
mydum <- '('
mydum <- paste(mydum,round(selection[[2]][j,i],4),sep='')
mydum <- paste(mydum,')')
a<-table.element(a,mydum)
}
a<-table.row.end(a)
}
a<-table.end(a)
table.save(a,file='mytable.tab')
a<-table.start()
a<-table.row.start(a)
a<-table.element(a,'Estimated ARIMA Residuals', 1,TRUE)
a<-table.row.end(a)
a<-table.row.start(a)
a<-table.element(a,'Value', 1,TRUE)
a<-table.row.end(a)
for (i in (par4*par5+par3):length(resid)) {
a<-table.row.start(a)
a<-table.element(a,resid[i])
a<-table.row.end(a)
}
a<-table.end(a)
table.save(a,file='mytable1.tab')