Free Statistics

of Irreproducible Research!

Author's title

Author*The author of this computation has been verified*
R Software Modulerwasp_arimabackwardselection.wasp
Title produced by softwareARIMA Backward Selection
Date of computationMon, 08 Dec 2008 15:29:28 -0700
Cite this page as followsStatistical Computations at FreeStatistics.org, Office for Research Development and Education, URL https://freestatistics.org/blog/index.php?v=date/2008/Dec/08/t1228775457tshnlk1u4thpd49.htm/, Retrieved Thu, 16 May 2024 21:46:30 +0000
Statistical Computations at FreeStatistics.org, Office for Research Development and Education, URL https://freestatistics.org/blog/index.php?pk=31102, Retrieved Thu, 16 May 2024 21:46:30 +0000
QR Codes:

Original text written by user:
IsPrivate?No (this computation is public)
User-defined keywords
Estimated Impact172
Family? (F = Feedback message, R = changed R code, M = changed R Module, P = changed Parameters, D = changed Data)
F     [Univariate Data Series] [blog 1e tijdreeks...] [2008-10-13 19:23:31] [7173087adebe3e3a714c80ea2417b3eb]
-   PD  [Univariate Data Series] [tijdreeksen opnie...] [2008-10-19 17:13:12] [7173087adebe3e3a714c80ea2417b3eb]
-   PD    [Univariate Data Series] [tijdreeksen opnie...] [2008-10-19 18:55:20] [7173087adebe3e3a714c80ea2417b3eb]
- RM        [Central Tendency] [central tendency ...] [2008-10-19 19:10:37] [7173087adebe3e3a714c80ea2417b3eb]
- RMP           [ARIMA Backward Selection] [step 5 arima back...] [2008-12-08 22:29:28] [95d95b0e883740fcbc85e18ec42dcafb] [Current]
Feedback Forum

Post a new message
Dataseries X:
5014
6153
6441
5584
6427
6062
5589
6216
5809
4989
6706
7174
6122
8075
6292
6337
8576
6077
5931
6288
7167
6054
6468
6401
6927
7914
7728
8699
8522
6481
7502
7778
7424
6941
8574
9169
7701
9035
7158
8195
8124
7073
7017
7390
7776
6197
6889
7087
6485
7654
6501
6313
7826
6589
6729
5684
8105
6391
5901
6758


Summary of computational transaction
Raw Inputview raw input (R code)
Raw Outputview raw output of R engine
Computing time6 seconds
R Server'Gwilym Jenkins' @ 72.249.127.135

\begin{tabular}{lllllllll}
\hline
Summary of computational transaction \tabularnewline
Raw Input & view raw input (R code)  \tabularnewline
Raw Output & view raw output of R engine  \tabularnewline
Computing time & 6 seconds \tabularnewline
R Server & 'Gwilym Jenkins' @ 72.249.127.135 \tabularnewline
\hline
\end{tabular}
%Source: https://freestatistics.org/blog/index.php?pk=31102&T=0

[TABLE]
[ROW][C]Summary of computational transaction[/C][/ROW]
[ROW][C]Raw Input[/C][C]view raw input (R code) [/C][/ROW]
[ROW][C]Raw Output[/C][C]view raw output of R engine [/C][/ROW]
[ROW][C]Computing time[/C][C]6 seconds[/C][/ROW]
[ROW][C]R Server[/C][C]'Gwilym Jenkins' @ 72.249.127.135[/C][/ROW]
[/TABLE]
Source: https://freestatistics.org/blog/index.php?pk=31102&T=0

Globally Unique Identifier (entire table): ba.freestatistics.org/blog/index.php?pk=31102&T=0

As an alternative you can also use a QR Code:  

The GUIDs for individual cells are displayed in the table below:

Summary of computational transaction
Raw Inputview raw input (R code)
Raw Outputview raw output of R engine
Computing time6 seconds
R Server'Gwilym Jenkins' @ 72.249.127.135


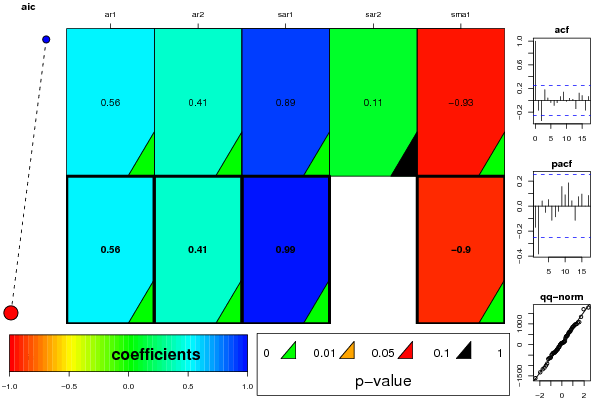
ARIMA Parameter Estimation and Backward Selection
Iterationar1ar2sar1sar2sma1
Estimates ( 1 )0.55710.40670.88550.1123-0.9343
(p-val)(0 )(0.0011 )(0 )(0.5665 )(0.0036 )
Estimates ( 2 )0.5590.40510.99330-0.8985
(p-val)(0 )(0.0012 )(0 )(NA )(0 )
Estimates ( 3 )NANANANANA
(p-val)(NA )(NA )(NA )(NA )(NA )
Estimates ( 4 )NANANANANA
(p-val)(NA )(NA )(NA )(NA )(NA )
Estimates ( 5 )NANANANANA
(p-val)(NA )(NA )(NA )(NA )(NA )
Estimates ( 6 )NANANANANA
(p-val)(NA )(NA )(NA )(NA )(NA )
Estimates ( 7 )NANANANANA
(p-val)(NA )(NA )(NA )(NA )(NA )
Estimates ( 8 )NANANANANA
(p-val)(NA )(NA )(NA )(NA )(NA )
Estimates ( 9 )NANANANANA
(p-val)(NA )(NA )(NA )(NA )(NA )

\begin{tabular}{lllllllll}
\hline
ARIMA Parameter Estimation and Backward Selection \tabularnewline
Iteration & ar1 & ar2 & sar1 & sar2 & sma1 \tabularnewline
Estimates ( 1 ) & 0.5571 & 0.4067 & 0.8855 & 0.1123 & -0.9343 \tabularnewline
(p-val) & (0 ) & (0.0011 ) & (0 ) & (0.5665 ) & (0.0036 ) \tabularnewline
Estimates ( 2 ) & 0.559 & 0.4051 & 0.9933 & 0 & -0.8985 \tabularnewline
(p-val) & (0 ) & (0.0012 ) & (0 ) & (NA ) & (0 ) \tabularnewline
Estimates ( 3 ) & NA & NA & NA & NA & NA \tabularnewline
(p-val) & (NA ) & (NA ) & (NA ) & (NA ) & (NA ) \tabularnewline
Estimates ( 4 ) & NA & NA & NA & NA & NA \tabularnewline
(p-val) & (NA ) & (NA ) & (NA ) & (NA ) & (NA ) \tabularnewline
Estimates ( 5 ) & NA & NA & NA & NA & NA \tabularnewline
(p-val) & (NA ) & (NA ) & (NA ) & (NA ) & (NA ) \tabularnewline
Estimates ( 6 ) & NA & NA & NA & NA & NA \tabularnewline
(p-val) & (NA ) & (NA ) & (NA ) & (NA ) & (NA ) \tabularnewline
Estimates ( 7 ) & NA & NA & NA & NA & NA \tabularnewline
(p-val) & (NA ) & (NA ) & (NA ) & (NA ) & (NA ) \tabularnewline
Estimates ( 8 ) & NA & NA & NA & NA & NA \tabularnewline
(p-val) & (NA ) & (NA ) & (NA ) & (NA ) & (NA ) \tabularnewline
Estimates ( 9 ) & NA & NA & NA & NA & NA \tabularnewline
(p-val) & (NA ) & (NA ) & (NA ) & (NA ) & (NA ) \tabularnewline
\hline
\end{tabular}
%Source: https://freestatistics.org/blog/index.php?pk=31102&T=1

[TABLE]
[ROW][C]ARIMA Parameter Estimation and Backward Selection[/C][/ROW]
[ROW][C]Iteration[/C][C]ar1[/C][C]ar2[/C][C]sar1[/C][C]sar2[/C][C]sma1[/C][/ROW]
[ROW][C]Estimates ( 1 )[/C][C]0.5571[/C][C]0.4067[/C][C]0.8855[/C][C]0.1123[/C][C]-0.9343[/C][/ROW]
[ROW][C](p-val)[/C][C](0 )[/C][C](0.0011 )[/C][C](0 )[/C][C](0.5665 )[/C][C](0.0036 )[/C][/ROW]
[ROW][C]Estimates ( 2 )[/C][C]0.559[/C][C]0.4051[/C][C]0.9933[/C][C]0[/C][C]-0.8985[/C][/ROW]
[ROW][C](p-val)[/C][C](0 )[/C][C](0.0012 )[/C][C](0 )[/C][C](NA )[/C][C](0 )[/C][/ROW]
[ROW][C]Estimates ( 3 )[/C][C]NA[/C][C]NA[/C][C]NA[/C][C]NA[/C][C]NA[/C][/ROW]
[ROW][C](p-val)[/C][C](NA )[/C][C](NA )[/C][C](NA )[/C][C](NA )[/C][C](NA )[/C][/ROW]
[ROW][C]Estimates ( 4 )[/C][C]NA[/C][C]NA[/C][C]NA[/C][C]NA[/C][C]NA[/C][/ROW]
[ROW][C](p-val)[/C][C](NA )[/C][C](NA )[/C][C](NA )[/C][C](NA )[/C][C](NA )[/C][/ROW]
[ROW][C]Estimates ( 5 )[/C][C]NA[/C][C]NA[/C][C]NA[/C][C]NA[/C][C]NA[/C][/ROW]
[ROW][C](p-val)[/C][C](NA )[/C][C](NA )[/C][C](NA )[/C][C](NA )[/C][C](NA )[/C][/ROW]
[ROW][C]Estimates ( 6 )[/C][C]NA[/C][C]NA[/C][C]NA[/C][C]NA[/C][C]NA[/C][/ROW]
[ROW][C](p-val)[/C][C](NA )[/C][C](NA )[/C][C](NA )[/C][C](NA )[/C][C](NA )[/C][/ROW]
[ROW][C]Estimates ( 7 )[/C][C]NA[/C][C]NA[/C][C]NA[/C][C]NA[/C][C]NA[/C][/ROW]
[ROW][C](p-val)[/C][C](NA )[/C][C](NA )[/C][C](NA )[/C][C](NA )[/C][C](NA )[/C][/ROW]
[ROW][C]Estimates ( 8 )[/C][C]NA[/C][C]NA[/C][C]NA[/C][C]NA[/C][C]NA[/C][/ROW]
[ROW][C](p-val)[/C][C](NA )[/C][C](NA )[/C][C](NA )[/C][C](NA )[/C][C](NA )[/C][/ROW]
[ROW][C]Estimates ( 9 )[/C][C]NA[/C][C]NA[/C][C]NA[/C][C]NA[/C][C]NA[/C][/ROW]
[ROW][C](p-val)[/C][C](NA )[/C][C](NA )[/C][C](NA )[/C][C](NA )[/C][C](NA )[/C][/ROW]
[/TABLE]
Source: https://freestatistics.org/blog/index.php?pk=31102&T=1

Globally Unique Identifier (entire table): ba.freestatistics.org/blog/index.php?pk=31102&T=1

As an alternative you can also use a QR Code:  

The GUIDs for individual cells are displayed in the table below:

ARIMA Parameter Estimation and Backward Selection
Iterationar1ar2sar1sar2sma1
Estimates ( 1 )0.55710.40670.88550.1123-0.9343
(p-val)(0 )(0.0011 )(0 )(0.5665 )(0.0036 )
Estimates ( 2 )0.5590.40510.99330-0.8985
(p-val)(0 )(0.0012 )(0 )(NA )(0 )
Estimates ( 3 )NANANANANA
(p-val)(NA )(NA )(NA )(NA )(NA )
Estimates ( 4 )NANANANANA
(p-val)(NA )(NA )(NA )(NA )(NA )
Estimates ( 5 )NANANANANA
(p-val)(NA )(NA )(NA )(NA )(NA )
Estimates ( 6 )NANANANANA
(p-val)(NA )(NA )(NA )(NA )(NA )
Estimates ( 7 )NANANANANA
(p-val)(NA )(NA )(NA )(NA )(NA )
Estimates ( 8 )NANANANANA
(p-val)(NA )(NA )(NA )(NA )(NA )
Estimates ( 9 )NANANANANA
(p-val)(NA )(NA )(NA )(NA )(NA )


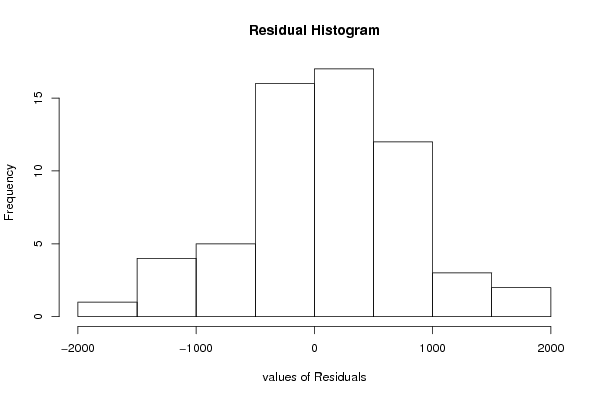
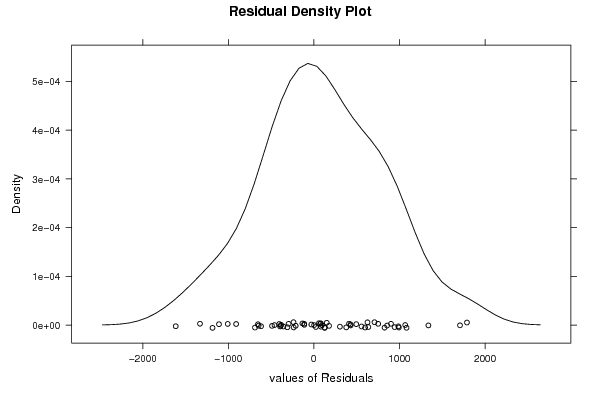
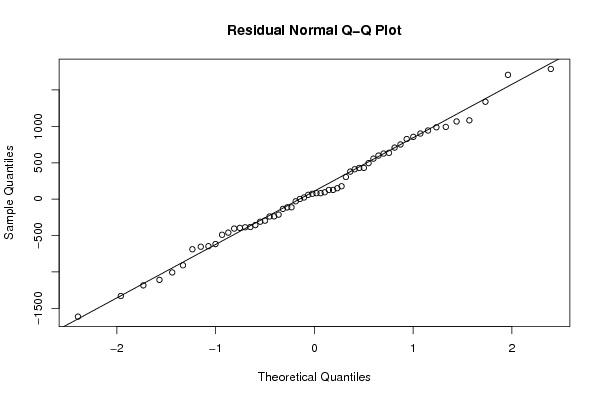
Estimated ARIMA Residuals
Value
626.376366979828
825.762624916791
636.238796894721
-460.362489574123
428.363910306641
73.4493840645341
-386.806123903719
378.086926888965
-29.8171219321088
-688.845265161989
1082.75894053615
943.347181099783
-356.467520557483
1067.45882426950
-909.243285746137
-213.214012040589
1789.09665524181
-1109.39959816156
-646.382538809695
177.154750313311
992.301383617274
-134.357193519953
-383.623431517308
-238.40595476292
855.842576130135
495.283864658592
304.328307484633
1338.23162837606
-295.893229812562
-1331.33564653976
751.539619983055
556.276200001492
-236.744583025739
93.837160422858
987.254118977027
901.264378499616
-654.018738560744
2.1152053477057
-1007.28382582108
598.509452437696
-310.122622461186
-113.093905101449
126.67092574078
150.058203393419
410.292621976103
-617.61110736159
-395.022737870919
23.1568649890564
-112.058163586577
81.573115116981
-404.562698494798
-489.605049811735
708.10335054354
429.576232760628
126.295132423342
-1185.16758538963
1707.56890264908
82.0620351580376
-1615.03173177085
59.2832855164591

\begin{tabular}{lllllllll}
\hline
Estimated ARIMA Residuals \tabularnewline
Value \tabularnewline
 \tabularnewline
626.376366979828 \tabularnewline
825.762624916791 \tabularnewline
636.238796894721 \tabularnewline
-460.362489574123 \tabularnewline
428.363910306641 \tabularnewline
73.4493840645341 \tabularnewline
-386.806123903719 \tabularnewline
378.086926888965 \tabularnewline
-29.8171219321088 \tabularnewline
-688.845265161989 \tabularnewline
1082.75894053615 \tabularnewline
943.347181099783 \tabularnewline
-356.467520557483 \tabularnewline
1067.45882426950 \tabularnewline
-909.243285746137 \tabularnewline
-213.214012040589 \tabularnewline
1789.09665524181 \tabularnewline
-1109.39959816156 \tabularnewline
-646.382538809695 \tabularnewline
177.154750313311 \tabularnewline
992.301383617274 \tabularnewline
-134.357193519953 \tabularnewline
-383.623431517308 \tabularnewline
-238.40595476292 \tabularnewline
855.842576130135 \tabularnewline
495.283864658592 \tabularnewline
304.328307484633 \tabularnewline
1338.23162837606 \tabularnewline
-295.893229812562 \tabularnewline
-1331.33564653976 \tabularnewline
751.539619983055 \tabularnewline
556.276200001492 \tabularnewline
-236.744583025739 \tabularnewline
93.837160422858 \tabularnewline
987.254118977027 \tabularnewline
901.264378499616 \tabularnewline
-654.018738560744 \tabularnewline
2.1152053477057 \tabularnewline
-1007.28382582108 \tabularnewline
598.509452437696 \tabularnewline
-310.122622461186 \tabularnewline
-113.093905101449 \tabularnewline
126.67092574078 \tabularnewline
150.058203393419 \tabularnewline
410.292621976103 \tabularnewline
-617.61110736159 \tabularnewline
-395.022737870919 \tabularnewline
23.1568649890564 \tabularnewline
-112.058163586577 \tabularnewline
81.573115116981 \tabularnewline
-404.562698494798 \tabularnewline
-489.605049811735 \tabularnewline
708.10335054354 \tabularnewline
429.576232760628 \tabularnewline
126.295132423342 \tabularnewline
-1185.16758538963 \tabularnewline
1707.56890264908 \tabularnewline
82.0620351580376 \tabularnewline
-1615.03173177085 \tabularnewline
59.2832855164591 \tabularnewline
\hline
\end{tabular}
%Source: https://freestatistics.org/blog/index.php?pk=31102&T=2

[TABLE]
[ROW][C]Estimated ARIMA Residuals[/C][/ROW]
[ROW][C]Value[/C][/ROW]
[ROW][C][/C][/ROW]
[ROW][C]626.376366979828[/C][/ROW]
[ROW][C]825.762624916791[/C][/ROW]
[ROW][C]636.238796894721[/C][/ROW]
[ROW][C]-460.362489574123[/C][/ROW]
[ROW][C]428.363910306641[/C][/ROW]
[ROW][C]73.4493840645341[/C][/ROW]
[ROW][C]-386.806123903719[/C][/ROW]
[ROW][C]378.086926888965[/C][/ROW]
[ROW][C]-29.8171219321088[/C][/ROW]
[ROW][C]-688.845265161989[/C][/ROW]
[ROW][C]1082.75894053615[/C][/ROW]
[ROW][C]943.347181099783[/C][/ROW]
[ROW][C]-356.467520557483[/C][/ROW]
[ROW][C]1067.45882426950[/C][/ROW]
[ROW][C]-909.243285746137[/C][/ROW]
[ROW][C]-213.214012040589[/C][/ROW]
[ROW][C]1789.09665524181[/C][/ROW]
[ROW][C]-1109.39959816156[/C][/ROW]
[ROW][C]-646.382538809695[/C][/ROW]
[ROW][C]177.154750313311[/C][/ROW]
[ROW][C]992.301383617274[/C][/ROW]
[ROW][C]-134.357193519953[/C][/ROW]
[ROW][C]-383.623431517308[/C][/ROW]
[ROW][C]-238.40595476292[/C][/ROW]
[ROW][C]855.842576130135[/C][/ROW]
[ROW][C]495.283864658592[/C][/ROW]
[ROW][C]304.328307484633[/C][/ROW]
[ROW][C]1338.23162837606[/C][/ROW]
[ROW][C]-295.893229812562[/C][/ROW]
[ROW][C]-1331.33564653976[/C][/ROW]
[ROW][C]751.539619983055[/C][/ROW]
[ROW][C]556.276200001492[/C][/ROW]
[ROW][C]-236.744583025739[/C][/ROW]
[ROW][C]93.837160422858[/C][/ROW]
[ROW][C]987.254118977027[/C][/ROW]
[ROW][C]901.264378499616[/C][/ROW]
[ROW][C]-654.018738560744[/C][/ROW]
[ROW][C]2.1152053477057[/C][/ROW]
[ROW][C]-1007.28382582108[/C][/ROW]
[ROW][C]598.509452437696[/C][/ROW]
[ROW][C]-310.122622461186[/C][/ROW]
[ROW][C]-113.093905101449[/C][/ROW]
[ROW][C]126.67092574078[/C][/ROW]
[ROW][C]150.058203393419[/C][/ROW]
[ROW][C]410.292621976103[/C][/ROW]
[ROW][C]-617.61110736159[/C][/ROW]
[ROW][C]-395.022737870919[/C][/ROW]
[ROW][C]23.1568649890564[/C][/ROW]
[ROW][C]-112.058163586577[/C][/ROW]
[ROW][C]81.573115116981[/C][/ROW]
[ROW][C]-404.562698494798[/C][/ROW]
[ROW][C]-489.605049811735[/C][/ROW]
[ROW][C]708.10335054354[/C][/ROW]
[ROW][C]429.576232760628[/C][/ROW]
[ROW][C]126.295132423342[/C][/ROW]
[ROW][C]-1185.16758538963[/C][/ROW]
[ROW][C]1707.56890264908[/C][/ROW]
[ROW][C]82.0620351580376[/C][/ROW]
[ROW][C]-1615.03173177085[/C][/ROW]
[ROW][C]59.2832855164591[/C][/ROW]
[/TABLE]
Source: https://freestatistics.org/blog/index.php?pk=31102&T=2

Globally Unique Identifier (entire table): ba.freestatistics.org/blog/index.php?pk=31102&T=2

As an alternative you can also use a QR Code:  

The GUIDs for individual cells are displayed in the table below:

Estimated ARIMA Residuals
Value
626.376366979828
825.762624916791
636.238796894721
-460.362489574123
428.363910306641
73.4493840645341
-386.806123903719
378.086926888965
-29.8171219321088
-688.845265161989
1082.75894053615
943.347181099783
-356.467520557483
1067.45882426950
-909.243285746137
-213.214012040589
1789.09665524181
-1109.39959816156
-646.382538809695
177.154750313311
992.301383617274
-134.357193519953
-383.623431517308
-238.40595476292
855.842576130135
495.283864658592
304.328307484633
1338.23162837606
-295.893229812562
-1331.33564653976
751.539619983055
556.276200001492
-236.744583025739
93.837160422858
987.254118977027
901.264378499616
-654.018738560744
2.1152053477057
-1007.28382582108
598.509452437696
-310.122622461186
-113.093905101449
126.67092574078
150.058203393419
410.292621976103
-617.61110736159
-395.022737870919
23.1568649890564
-112.058163586577
81.573115116981
-404.562698494798
-489.605049811735
708.10335054354
429.576232760628
126.295132423342
-1185.16758538963
1707.56890264908
82.0620351580376
-1615.03173177085
59.2832855164591


Parameters (Session):
par1 = FALSE ; par2 = 1 ; par3 = 0 ; par4 = 0 ; par5 = 12 ; par6 = 2 ; par7 = 0 ; par8 = 2 ; par9 = 1 ;
Parameters (R input):
par1 = FALSE ; par2 = 1 ; par3 = 0 ; par4 = 0 ; par5 = 12 ; par6 = 2 ; par7 = 0 ; par8 = 2 ; par9 = 1 ;
R code (references can be found in the software module):
library(lattice)
if (par1 == 'TRUE') par1 <- TRUE
if (par1 == 'FALSE') par1 <- FALSE
par2 <- as.numeric(par2) #Box-Cox lambda transformation parameter
par3 <- as.numeric(par3) #degree of non-seasonal differencing
par4 <- as.numeric(par4) #degree of seasonal differencing
par5 <- as.numeric(par5) #seasonal period
par6 <- as.numeric(par6) #degree (p) of the non-seasonal AR(p) polynomial
par7 <- as.numeric(par7) #degree (q) of the non-seasonal MA(q) polynomial
par8 <- as.numeric(par8) #degree (P) of the seasonal AR(P) polynomial
par9 <- as.numeric(par9) #degree (Q) of the seasonal MA(Q) polynomial
armaGR <- function(arima.out, names, n){
try1 <- arima.out$coef
try2 <- sqrt(diag(arima.out$var.coef))
try.data.frame <- data.frame(matrix(NA,ncol=4,nrow=length(names)))
dimnames(try.data.frame) <- list(names,c('coef','std','tstat','pv'))
try.data.frame[,1] <- try1
for(i in 1:length(try2)) try.data.frame[which(rownames(try.data.frame)==names(try2)[i]),2] <- try2[i]
try.data.frame[,3] <- try.data.frame[,1] / try.data.frame[,2]
try.data.frame[,4] <- round((1-pt(abs(try.data.frame[,3]),df=n-(length(try2)+1)))*2,5)
vector <- rep(NA,length(names))
vector[is.na(try.data.frame[,4])] <- 0
maxi <- which.max(try.data.frame[,4])
continue <- max(try.data.frame[,4],na.rm=TRUE) > .05
vector[maxi] <- 0
list(summary=try.data.frame,next.vector=vector,continue=continue)
}
arimaSelect <- function(series, order=c(13,0,0), seasonal=list(order=c(2,0,0),period=12), include.mean=F){
nrc <- order[1]+order[3]+seasonal$order[1]+seasonal$order[3]
coeff <- matrix(NA, nrow=nrc*2, ncol=nrc)
pval <- matrix(NA, nrow=nrc*2, ncol=nrc)
mylist <- rep(list(NULL), nrc)
names <- NULL
if(order[1] > 0) names <- paste('ar',1:order[1],sep='')
if(order[3] > 0) names <- c( names , paste('ma',1:order[3],sep='') )
if(seasonal$order[1] > 0) names <- c(names, paste('sar',1:seasonal$order[1],sep=''))
if(seasonal$order[3] > 0) names <- c(names, paste('sma',1:seasonal$order[3],sep=''))
arima.out <- arima(series, order=order, seasonal=seasonal, include.mean=include.mean, method='ML')
mylist[[1]] <- arima.out
last.arma <- armaGR(arima.out, names, length(series))
mystop <- FALSE
i <- 1
coeff[i,] <- last.arma[[1]][,1]
pval [i,] <- last.arma[[1]][,4]
i <- 2
aic <- arima.out$aic
while(!mystop){
mylist[[i]] <- arima.out
arima.out <- arima(series, order=order, seasonal=seasonal, include.mean=include.mean, method='ML', fixed=last.arma$next.vector)
aic <- c(aic, arima.out$aic)
last.arma <- armaGR(arima.out, names, length(series))
mystop <- !last.arma$continue
coeff[i,] <- last.arma[[1]][,1]
pval [i,] <- last.arma[[1]][,4]
i <- i+1
}
list(coeff, pval, mylist, aic=aic)
}
arimaSelectplot <- function(arimaSelect.out,noms,choix){
noms <- names(arimaSelect.out[[3]][[1]]$coef)
coeff <- arimaSelect.out[[1]]
k <- min(which(is.na(coeff[,1])))-1
coeff <- coeff[1:k,]
pval <- arimaSelect.out[[2]][1:k,]
aic <- arimaSelect.out$aic[1:k]
coeff[coeff==0] <- NA
n <- ncol(coeff)
if(missing(choix)) choix <- k
layout(matrix(c(1,1,1,2,
3,3,3,2,
3,3,3,4,
5,6,7,7),nr=4),
widths=c(10,35,45,15),
heights=c(30,30,15,15))
couleurs <- rainbow(75)[1:50]#(50)
ticks <- pretty(coeff)
par(mar=c(1,1,3,1))
plot(aic,k:1-.5,type='o',pch=21,bg='blue',cex=2,axes=F,lty=2,xpd=NA)
points(aic[choix],k-choix+.5,pch=21,cex=4,bg=2,xpd=NA)
title('aic',line=2)
par(mar=c(3,0,0,0))
plot(0,axes=F,xlab='',ylab='',xlim=range(ticks),ylim=c(.1,1))
rect(xleft = min(ticks) + (0:49)/50*(max(ticks)-min(ticks)),
xright = min(ticks) + (1:50)/50*(max(ticks)-min(ticks)),
ytop = rep(1,50),
ybottom= rep(0,50),col=couleurs,border=NA)
axis(1,ticks)
rect(xleft=min(ticks),xright=max(ticks),ytop=1,ybottom=0)
text(mean(coeff,na.rm=T),.5,'coefficients',cex=2,font=2)
par(mar=c(1,1,3,1))
image(1:n,1:k,t(coeff[k:1,]),axes=F,col=couleurs,zlim=range(ticks))
for(i in 1:n) for(j in 1:k) if(!is.na(coeff[j,i])) {
if(pval[j,i]<.01) symb = 'green'
else if( (pval[j,i]<.05) & (pval[j,i]>=.01)) symb = 'orange'
else if( (pval[j,i]<.1) & (pval[j,i]>=.05)) symb = 'red'
else symb = 'black'
polygon(c(i+.5 ,i+.2 ,i+.5 ,i+.5),
c(k-j+0.5,k-j+0.5,k-j+0.8,k-j+0.5),
col=symb)
if(j==choix) {
rect(xleft=i-.5,
xright=i+.5,
ybottom=k-j+1.5,
ytop=k-j+.5,
lwd=4)
text(i,
k-j+1,
round(coeff[j,i],2),
cex=1.2,
font=2)
}
else{
rect(xleft=i-.5,xright=i+.5,ybottom=k-j+1.5,ytop=k-j+.5)
text(i,k-j+1,round(coeff[j,i],2),cex=1.2,font=1)
}
}
axis(3,1:n,noms)
par(mar=c(0.5,0,0,0.5))
plot(0,axes=F,xlab='',ylab='',type='n',xlim=c(0,8),ylim=c(-.2,.8))
cols <- c('green','orange','red','black')
niv <- c('0','0.01','0.05','0.1')
for(i in 0:3){
polygon(c(1+2*i ,1+2*i ,1+2*i-.5 ,1+2*i),
c(.4 ,.7 , .4 , .4),
col=cols[i+1])
text(2*i,0.5,niv[i+1],cex=1.5)
}
text(8,.5,1,cex=1.5)
text(4,0,'p-value',cex=2)
box()
residus <- arimaSelect.out[[3]][[choix]]$res
par(mar=c(1,2,4,1))
acf(residus,main='')
title('acf',line=.5)
par(mar=c(1,2,4,1))
pacf(residus,main='')
title('pacf',line=.5)
par(mar=c(2,2,4,1))
qqnorm(residus,main='')
title('qq-norm',line=.5)
qqline(residus)
residus
}
if (par2 == 0) x <- log(x)
if (par2 != 0) x <- x^par2
(selection <- arimaSelect(x, order=c(par6,par3,par7), seasonal=list(order=c(par8,par4,par9), period=par5)))
bitmap(file='test1.png')
resid <- arimaSelectplot(selection)
dev.off()
resid
bitmap(file='test2.png')
acf(resid,length(resid)/2, main='Residual Autocorrelation Function')
dev.off()
bitmap(file='test3.png')
pacf(resid,length(resid)/2, main='Residual Partial Autocorrelation Function')
dev.off()
bitmap(file='test4.png')
cpgram(resid, main='Residual Cumulative Periodogram')
dev.off()
bitmap(file='test5.png')
hist(resid, main='Residual Histogram', xlab='values of Residuals')
dev.off()
bitmap(file='test6.png')
densityplot(~resid,col='black',main='Residual Density Plot', xlab='values of Residuals')
dev.off()
bitmap(file='test7.png')
qqnorm(resid, main='Residual Normal Q-Q Plot')
qqline(resid)
dev.off()
ncols <- length(selection[[1]][1,])
nrows <- length(selection[[2]][,1])-1
load(file='createtable')
a<-table.start()
a<-table.row.start(a)
a<-table.element(a,'ARIMA Parameter Estimation and Backward Selection', ncols+1,TRUE)
a<-table.row.end(a)
a<-table.row.start(a)
a<-table.element(a,'Iteration', header=TRUE)
for (i in 1:ncols) {
a<-table.element(a,names(selection[[3]][[1]]$coef)[i],header=TRUE)
}
a<-table.row.end(a)
for (j in 1:nrows) {
a<-table.row.start(a)
mydum <- 'Estimates ('
mydum <- paste(mydum,j)
mydum <- paste(mydum,')')
a<-table.element(a,mydum, header=TRUE)
for (i in 1:ncols) {
a<-table.element(a,round(selection[[1]][j,i],4))
}
a<-table.row.end(a)
a<-table.row.start(a)
a<-table.element(a,'(p-val)', header=TRUE)
for (i in 1:ncols) {
mydum <- '('
mydum <- paste(mydum,round(selection[[2]][j,i],4),sep='')
mydum <- paste(mydum,')')
a<-table.element(a,mydum)
}
a<-table.row.end(a)
}
a<-table.end(a)
table.save(a,file='mytable.tab')
a<-table.start()
a<-table.row.start(a)
a<-table.element(a,'Estimated ARIMA Residuals', 1,TRUE)
a<-table.row.end(a)
a<-table.row.start(a)
a<-table.element(a,'Value', 1,TRUE)
a<-table.row.end(a)
for (i in (par4*par5+par3):length(resid)) {
a<-table.row.start(a)
a<-table.element(a,resid[i])
a<-table.row.end(a)
}
a<-table.end(a)
table.save(a,file='mytable1.tab')