Free Statistics

of Irreproducible Research!

Author's title

Author*The author of this computation has been verified*
R Software Modulerwasp_spectrum.wasp
Title produced by softwareSpectral Analysis
Date of computationMon, 08 Dec 2008 15:06:13 -0700
Cite this page as followsStatistical Computations at FreeStatistics.org, Office for Research Development and Education, URL https://freestatistics.org/blog/index.php?v=date/2008/Dec/08/t1228774031t3b2ems1cjsu0dz.htm/, Retrieved Thu, 16 May 2024 23:45:00 +0000
Statistical Computations at FreeStatistics.org, Office for Research Development and Education, URL https://freestatistics.org/blog/index.php?pk=31096, Retrieved Thu, 16 May 2024 23:45:00 +0000
QR Codes:

Original text written by user:
IsPrivate?No (this computation is public)
User-defined keywords
Estimated Impact158
Family? (F = Feedback message, R = changed R code, M = changed R Module, P = changed Parameters, D = changed Data)
F     [Law of Averages] [Random Walk Simul...] [2008-11-25 17:50:19] [b98453cac15ba1066b407e146608df68]
F       [Law of Averages] [Non Stationary Ti...] [2008-11-30 21:33:42] [82d201ca7b4e7cd2c6f885d29b5b6937]
F RMPD    [Spectral Analysis] [spectral analyse] [2008-12-08 21:10:26] [82d201ca7b4e7cd2c6f885d29b5b6937]
F   P         [Spectral Analysis] [spectrum] [2008-12-08 22:06:13] [00a0a665d7a07edd2e460056b0c0c354] [Current]
Feedback Forum
2008-12-15 22:01:08 [Inge Meelberghs] [reply
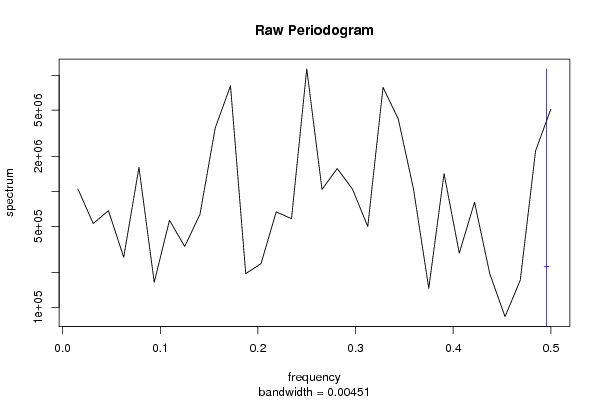
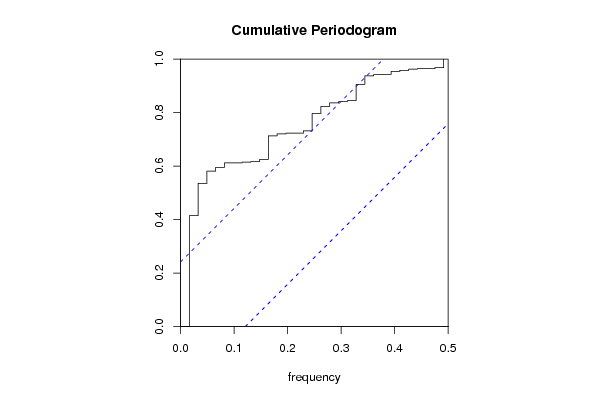
In volgende stappen gaan we LT-trend en seizonaltiteit verwijderen om de reeks stationair te maken. Dit is nu duidelijk nog niet het geval want de grafiek ligt helemaal niet tussen de betrouwbaarheidsintervallen. 40% van de reeks wordt verklaard door de lange termijn trend.
2008-12-15 22:12:29 [Inge Meelberghs] [reply
Dit hoort nog bij vorige commentaar:
Op de cumulatieve periodogram zien we ook dat er zich vele lage frequenties voordoen wat wijst op een LT-trend. Het trapgewijs verloopt duidt op seizonaliteit. Deze gaan we dus in volgende stappen verwijderen.
2008-12-15 22:44:24 [Inge Meelberghs] [reply
Ook hier moet ik weer wijzen op een fout van mezelf in voorgaande uitleg. Ik had de cumulatieve periodogram eerst fout geïnterpreteerd. In deze tijdreeks is er namelijk geen sprake van een LT-trend, enkel van seizoenaliteit. Dit kunnen we stellen doordat er niet al te veel lage frequenties zijn wat er dus op wijst dat er geen LT- aanwezig is. Van seizonaliteit is echter wel sprake door het trapgewijs verloop.

Post a new message
Dataseries X:
11703.7
16283.6
16726.5
14968.9
14861
14583.3
15305.8
17903.9
16379.4
15420.3
17870.5
15912.8
13866.5
17823.2
17872
17420.4
16704.4
15991.2
16583.6
19123.5
17838.7
17209.4
18586.5
16258.1
15141.6
19202.1
17746.5
19090.1
18040.3
17515.5
17751.8
21072.4
17170
19439.5
19795.4
17574.9
16165.4
19464.6
19932.1
19961.2
17343.4
18924.2
18574.1
21350.6
18594.6
19823.1
20844.4
19640.2
17735.4
19813.6
22160
20664.3
17877.4
21211.2
21423.1
21688.7
23243.2
21490.2
22925.8
23184.8
18562.2


Summary of computational transaction
Raw Inputview raw input (R code)
Raw Outputview raw output of R engine
Computing time3 seconds
R Server'Herman Ole Andreas Wold' @ 193.190.124.10:1001

\begin{tabular}{lllllllll}
\hline
Summary of computational transaction \tabularnewline
Raw Input & view raw input (R code)  \tabularnewline
Raw Output & view raw output of R engine  \tabularnewline
Computing time & 3 seconds \tabularnewline
R Server & 'Herman Ole Andreas Wold' @ 193.190.124.10:1001 \tabularnewline
\hline
\end{tabular}
%Source: https://freestatistics.org/blog/index.php?pk=31096&T=0

[TABLE]
[ROW][C]Summary of computational transaction[/C][/ROW]
[ROW][C]Raw Input[/C][C]view raw input (R code) [/C][/ROW]
[ROW][C]Raw Output[/C][C]view raw output of R engine [/C][/ROW]
[ROW][C]Computing time[/C][C]3 seconds[/C][/ROW]
[ROW][C]R Server[/C][C]'Herman Ole Andreas Wold' @ 193.190.124.10:1001[/C][/ROW]
[/TABLE]
Source: https://freestatistics.org/blog/index.php?pk=31096&T=0

Globally Unique Identifier (entire table): ba.freestatistics.org/blog/index.php?pk=31096&T=0

As an alternative you can also use a QR Code:  

The GUIDs for individual cells are displayed in the table below:

Summary of computational transaction
Raw Inputview raw input (R code)
Raw Outputview raw output of R engine
Computing time3 seconds
R Server'Herman Ole Andreas Wold' @ 193.190.124.10:1001


Raw Periodogram
ParameterValue
Box-Cox transformation parameter (lambda)1
Degree of non-seasonal differencing (d)0
Degree of seasonal differencing (D)0
Seasonal Period (s)12
Frequency (Period)Spectrum
0.0156 (64)1047155.913888
0.0312 (32)528168.992589
0.0469 (21.3333)681655.937488
0.0625 (16)271169.505988
0.0781 (12.8)1609970.52967
0.0938 (10.6667)164598.311114
0.1094 (9.1429)563123.835586
0.125 (8)335236.094064
0.1406 (7.1111)634852.004773
0.1562 (6.4)3519254.311755
0.1719 (5.8182)8118167.91927
0.1875 (5.3333)195706.997155
0.2031 (4.9231)238114.893512
0.2188 (4.5714)665862.580012
0.2344 (4.2667)581688.314684
0.25 (4)11340087.170917
0.2656 (3.7647)1039799.202319
0.2812 (3.5556)1572801.602526
0.2969 (3.3684)1042998.910695
0.3125 (3.2)497797.328373
0.3281 (3.0476)7872923.160024
0.3438 (2.9091)4203361.557517
0.3594 (2.7826)1043423.70759
0.375 (2.6667)146093.414021
0.3906 (2.56)1422838.294916
0.4062 (2.4615)293631.280364
0.4219 (2.3704)805910.361018
0.4375 (2.2857)194516.363337
0.4531 (2.2069)83271.75878
0.4688 (2.1333)172130.52461
0.4844 (2.0645)2231639.593311
0.5 (2)5106748.609204

\begin{tabular}{lllllllll}
\hline
Raw Periodogram \tabularnewline
Parameter & Value \tabularnewline
Box-Cox transformation parameter (lambda) & 1 \tabularnewline
Degree of non-seasonal differencing (d) & 0 \tabularnewline
Degree of seasonal differencing (D) & 0 \tabularnewline
Seasonal Period (s) & 12 \tabularnewline
Frequency (Period) & Spectrum \tabularnewline
0.0156 (64) & 1047155.913888 \tabularnewline
0.0312 (32) & 528168.992589 \tabularnewline
0.0469 (21.3333) & 681655.937488 \tabularnewline
0.0625 (16) & 271169.505988 \tabularnewline
0.0781 (12.8) & 1609970.52967 \tabularnewline
0.0938 (10.6667) & 164598.311114 \tabularnewline
0.1094 (9.1429) & 563123.835586 \tabularnewline
0.125 (8) & 335236.094064 \tabularnewline
0.1406 (7.1111) & 634852.004773 \tabularnewline
0.1562 (6.4) & 3519254.311755 \tabularnewline
0.1719 (5.8182) & 8118167.91927 \tabularnewline
0.1875 (5.3333) & 195706.997155 \tabularnewline
0.2031 (4.9231) & 238114.893512 \tabularnewline
0.2188 (4.5714) & 665862.580012 \tabularnewline
0.2344 (4.2667) & 581688.314684 \tabularnewline
0.25 (4) & 11340087.170917 \tabularnewline
0.2656 (3.7647) & 1039799.202319 \tabularnewline
0.2812 (3.5556) & 1572801.602526 \tabularnewline
0.2969 (3.3684) & 1042998.910695 \tabularnewline
0.3125 (3.2) & 497797.328373 \tabularnewline
0.3281 (3.0476) & 7872923.160024 \tabularnewline
0.3438 (2.9091) & 4203361.557517 \tabularnewline
0.3594 (2.7826) & 1043423.70759 \tabularnewline
0.375 (2.6667) & 146093.414021 \tabularnewline
0.3906 (2.56) & 1422838.294916 \tabularnewline
0.4062 (2.4615) & 293631.280364 \tabularnewline
0.4219 (2.3704) & 805910.361018 \tabularnewline
0.4375 (2.2857) & 194516.363337 \tabularnewline
0.4531 (2.2069) & 83271.75878 \tabularnewline
0.4688 (2.1333) & 172130.52461 \tabularnewline
0.4844 (2.0645) & 2231639.593311 \tabularnewline
0.5 (2) & 5106748.609204 \tabularnewline
\hline
\end{tabular}
%Source: https://freestatistics.org/blog/index.php?pk=31096&T=1

[TABLE]
[ROW][C]Raw Periodogram[/C][/ROW]
[ROW][C]Parameter[/C][C]Value[/C][/ROW]
[ROW][C]Box-Cox transformation parameter (lambda)[/C][C]1[/C][/ROW]
[ROW][C]Degree of non-seasonal differencing (d)[/C][C]0[/C][/ROW]
[ROW][C]Degree of seasonal differencing (D)[/C][C]0[/C][/ROW]
[ROW][C]Seasonal Period (s)[/C][C]12[/C][/ROW]
[ROW][C]Frequency (Period)[/C][C]Spectrum[/C][/ROW]
[ROW][C]0.0156 (64)[/C][C]1047155.913888[/C][/ROW]
[ROW][C]0.0312 (32)[/C][C]528168.992589[/C][/ROW]
[ROW][C]0.0469 (21.3333)[/C][C]681655.937488[/C][/ROW]
[ROW][C]0.0625 (16)[/C][C]271169.505988[/C][/ROW]
[ROW][C]0.0781 (12.8)[/C][C]1609970.52967[/C][/ROW]
[ROW][C]0.0938 (10.6667)[/C][C]164598.311114[/C][/ROW]
[ROW][C]0.1094 (9.1429)[/C][C]563123.835586[/C][/ROW]
[ROW][C]0.125 (8)[/C][C]335236.094064[/C][/ROW]
[ROW][C]0.1406 (7.1111)[/C][C]634852.004773[/C][/ROW]
[ROW][C]0.1562 (6.4)[/C][C]3519254.311755[/C][/ROW]
[ROW][C]0.1719 (5.8182)[/C][C]8118167.91927[/C][/ROW]
[ROW][C]0.1875 (5.3333)[/C][C]195706.997155[/C][/ROW]
[ROW][C]0.2031 (4.9231)[/C][C]238114.893512[/C][/ROW]
[ROW][C]0.2188 (4.5714)[/C][C]665862.580012[/C][/ROW]
[ROW][C]0.2344 (4.2667)[/C][C]581688.314684[/C][/ROW]
[ROW][C]0.25 (4)[/C][C]11340087.170917[/C][/ROW]
[ROW][C]0.2656 (3.7647)[/C][C]1039799.202319[/C][/ROW]
[ROW][C]0.2812 (3.5556)[/C][C]1572801.602526[/C][/ROW]
[ROW][C]0.2969 (3.3684)[/C][C]1042998.910695[/C][/ROW]
[ROW][C]0.3125 (3.2)[/C][C]497797.328373[/C][/ROW]
[ROW][C]0.3281 (3.0476)[/C][C]7872923.160024[/C][/ROW]
[ROW][C]0.3438 (2.9091)[/C][C]4203361.557517[/C][/ROW]
[ROW][C]0.3594 (2.7826)[/C][C]1043423.70759[/C][/ROW]
[ROW][C]0.375 (2.6667)[/C][C]146093.414021[/C][/ROW]
[ROW][C]0.3906 (2.56)[/C][C]1422838.294916[/C][/ROW]
[ROW][C]0.4062 (2.4615)[/C][C]293631.280364[/C][/ROW]
[ROW][C]0.4219 (2.3704)[/C][C]805910.361018[/C][/ROW]
[ROW][C]0.4375 (2.2857)[/C][C]194516.363337[/C][/ROW]
[ROW][C]0.4531 (2.2069)[/C][C]83271.75878[/C][/ROW]
[ROW][C]0.4688 (2.1333)[/C][C]172130.52461[/C][/ROW]
[ROW][C]0.4844 (2.0645)[/C][C]2231639.593311[/C][/ROW]
[ROW][C]0.5 (2)[/C][C]5106748.609204[/C][/ROW]
[/TABLE]
Source: https://freestatistics.org/blog/index.php?pk=31096&T=1

Globally Unique Identifier (entire table): ba.freestatistics.org/blog/index.php?pk=31096&T=1

As an alternative you can also use a QR Code:  

The GUIDs for individual cells are displayed in the table below:

Raw Periodogram
ParameterValue
Box-Cox transformation parameter (lambda)1
Degree of non-seasonal differencing (d)0
Degree of seasonal differencing (D)0
Seasonal Period (s)12
Frequency (Period)Spectrum
0.0156 (64)1047155.913888
0.0312 (32)528168.992589
0.0469 (21.3333)681655.937488
0.0625 (16)271169.505988
0.0781 (12.8)1609970.52967
0.0938 (10.6667)164598.311114
0.1094 (9.1429)563123.835586
0.125 (8)335236.094064
0.1406 (7.1111)634852.004773
0.1562 (6.4)3519254.311755
0.1719 (5.8182)8118167.91927
0.1875 (5.3333)195706.997155
0.2031 (4.9231)238114.893512
0.2188 (4.5714)665862.580012
0.2344 (4.2667)581688.314684
0.25 (4)11340087.170917
0.2656 (3.7647)1039799.202319
0.2812 (3.5556)1572801.602526
0.2969 (3.3684)1042998.910695
0.3125 (3.2)497797.328373
0.3281 (3.0476)7872923.160024
0.3438 (2.9091)4203361.557517
0.3594 (2.7826)1043423.70759
0.375 (2.6667)146093.414021
0.3906 (2.56)1422838.294916
0.4062 (2.4615)293631.280364
0.4219 (2.3704)805910.361018
0.4375 (2.2857)194516.363337
0.4531 (2.2069)83271.75878
0.4688 (2.1333)172130.52461
0.4844 (2.0645)2231639.593311
0.5 (2)5106748.609204


Parameters (Session):
par1 = 1 ; par2 = 0 ; par3 = 0 ; par4 = 12 ;
Parameters (R input):
par1 = 1 ; par2 = 0 ; par3 = 0 ; par4 = 12 ;
R code (references can be found in the software module):
par1 <- as.numeric(par1)
par2 <- as.numeric(par2)
par3 <- as.numeric(par3)
par4 <- as.numeric(par4)
if (par1 == 0) {
x <- log(x)
} else {
x <- (x ^ par1 - 1) / par1
}
if (par2 > 0) x <- diff(x,lag=1,difference=par2)
if (par3 > 0) x <- diff(x,lag=par4,difference=par3)
bitmap(file='test1.png')
r <- spectrum(x,main='Raw Periodogram')
dev.off()
bitmap(file='test2.png')
cpgram(x,main='Cumulative Periodogram')
dev.off()
load(file='createtable')
a<-table.start()
a<-table.row.start(a)
a<-table.element(a,'Raw Periodogram',2,TRUE)
a<-table.row.end(a)
a<-table.row.start(a)
a<-table.element(a,'Parameter',header=TRUE)
a<-table.element(a,'Value',header=TRUE)
a<-table.row.end(a)
a<-table.row.start(a)
a<-table.element(a,'Box-Cox transformation parameter (lambda)',header=TRUE)
a<-table.element(a,par1)
a<-table.row.end(a)
a<-table.row.start(a)
a<-table.element(a,'Degree of non-seasonal differencing (d)',header=TRUE)
a<-table.element(a,par2)
a<-table.row.end(a)
a<-table.row.start(a)
a<-table.element(a,'Degree of seasonal differencing (D)',header=TRUE)
a<-table.element(a,par3)
a<-table.row.end(a)
a<-table.row.start(a)
a<-table.element(a,'Seasonal Period (s)',header=TRUE)
a<-table.element(a,par4)
a<-table.row.end(a)
a<-table.row.start(a)
a<-table.element(a,'Frequency (Period)',header=TRUE)
a<-table.element(a,'Spectrum',header=TRUE)
a<-table.row.end(a)
for (i in 1:length(r$freq)) {
a<-table.row.start(a)
mylab <- round(r$freq[i],4)
mylab <- paste(mylab,' (',sep='')
mylab <- paste(mylab,round(1/r$freq[i],4),sep='')
mylab <- paste(mylab,')',sep='')
a<-table.element(a,mylab,header=TRUE)
a<-table.element(a,round(r$spec[i],6))
a<-table.row.end(a)
}
a<-table.end(a)
table.save(a,file='mytable.tab')