Free Statistics

of Irreproducible Research!

Author's title

Author*The author of this computation has been verified*
R Software Modulerwasp_arimabackwardselection.wasp
Title produced by softwareARIMA Backward Selection
Date of computationMon, 08 Dec 2008 15:03:24 -0700
Cite this page as followsStatistical Computations at FreeStatistics.org, Office for Research Development and Education, URL https://freestatistics.org/blog/index.php?v=date/2008/Dec/08/t12287739063udnuh422h4s97l.htm/, Retrieved Thu, 16 May 2024 11:33:20 +0000
Statistical Computations at FreeStatistics.org, Office for Research Development and Education, URL https://freestatistics.org/blog/index.php?pk=31095, Retrieved Thu, 16 May 2024 11:33:20 +0000
QR Codes:

Original text written by user:
IsPrivate?No (this computation is public)
User-defined keywords
Estimated Impact175
Family? (F = Feedback message, R = changed R code, M = changed R Module, P = changed Parameters, D = changed Data)
F     [Univariate Data Series] [blog 1e tijdreeks...] [2008-10-13 19:23:31] [7173087adebe3e3a714c80ea2417b3eb]
-   PD  [Univariate Data Series] [tijdreeksen opnie...] [2008-10-19 17:13:12] [7173087adebe3e3a714c80ea2417b3eb]
-   PD    [Univariate Data Series] [tijdreeksen opnie...] [2008-10-19 18:55:20] [7173087adebe3e3a714c80ea2417b3eb]
- RM        [Central Tendency] [central tendency ...] [2008-10-19 19:10:37] [7173087adebe3e3a714c80ea2417b3eb]
- RMP           [ARIMA Backward Selection] [arima backward st...] [2008-12-08 22:03:24] [95d95b0e883740fcbc85e18ec42dcafb] [Current]
-   PD            [ARIMA Backward Selection] [Backward inschr. ...] [2008-12-21 14:19:55] [8b0d202c3a0c4ea223fd8b8e731dacd8]
- RMPD            [ARIMA Forecasting] [Forecasting insch...] [2008-12-21 14:44:46] [8b0d202c3a0c4ea223fd8b8e731dacd8]
- RMP             [ARIMA Forecasting] [forecast bouwverg...] [2008-12-22 13:21:52] [7173087adebe3e3a714c80ea2417b3eb]
Feedback Forum

Post a new message
Dataseries X:
5014
6153
6441
5584
6427
6062
5589
6216
5809
4989
6706
7174
6122
8075
6292
6337
8576
6077
5931
6288
7167
6054
6468
6401
6927
7914
7728
8699
8522
6481
7502
7778
7424
6941
8574
9169
7701
9035
7158
8195
8124
7073
7017
7390
7776
6197
6889
7087
6485
7654
6501
6313
7826
6589
6729
5684
8105
6391
5901
6758


Summary of computational transaction
Raw Inputview raw input (R code)
Raw Outputview raw output of R engine
Computing time8 seconds
R Server'Sir Ronald Aylmer Fisher' @ 193.190.124.24

\begin{tabular}{lllllllll}
\hline
Summary of computational transaction \tabularnewline
Raw Input & view raw input (R code)  \tabularnewline
Raw Output & view raw output of R engine  \tabularnewline
Computing time & 8 seconds \tabularnewline
R Server & 'Sir Ronald Aylmer Fisher' @ 193.190.124.24 \tabularnewline
\hline
\end{tabular}
%Source: https://freestatistics.org/blog/index.php?pk=31095&T=0

[TABLE]
[ROW][C]Summary of computational transaction[/C][/ROW]
[ROW][C]Raw Input[/C][C]view raw input (R code) [/C][/ROW]
[ROW][C]Raw Output[/C][C]view raw output of R engine [/C][/ROW]
[ROW][C]Computing time[/C][C]8 seconds[/C][/ROW]
[ROW][C]R Server[/C][C]'Sir Ronald Aylmer Fisher' @ 193.190.124.24[/C][/ROW]
[/TABLE]
Source: https://freestatistics.org/blog/index.php?pk=31095&T=0

Globally Unique Identifier (entire table): ba.freestatistics.org/blog/index.php?pk=31095&T=0

As an alternative you can also use a QR Code:  

The GUIDs for individual cells are displayed in the table below:

Summary of computational transaction
Raw Inputview raw input (R code)
Raw Outputview raw output of R engine
Computing time8 seconds
R Server'Sir Ronald Aylmer Fisher' @ 193.190.124.24


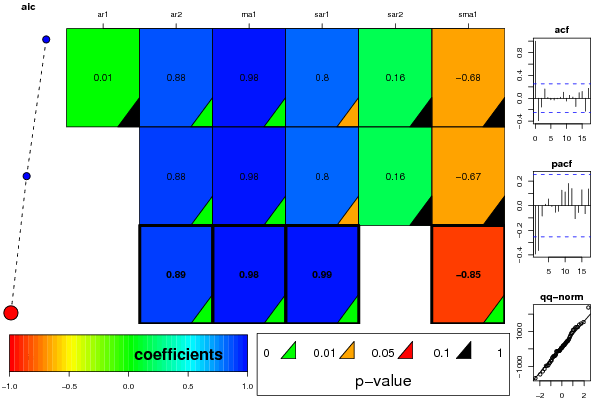
ARIMA Parameter Estimation and Backward Selection
Iterationar1ar2ma1sar1sar2sma1
Estimates ( 1 )0.00580.87930.98230.8020.1611-0.6756
(p-val)(0.9473 )(0 )(0 )(0.0135 )(0.506 )(0.1684 )
Estimates ( 2 )00.8830.9840.80190.1607-0.6718
(p-val)(NA )(0 )(0 )(0.0115 )(0.5023 )(0.1523 )
Estimates ( 3 )00.88570.9830.99080-0.8531
(p-val)(NA )(0 )(0 )(0 )(NA )(0 )
Estimates ( 4 )NANANANANANA
(p-val)(NA )(NA )(NA )(NA )(NA )(NA )
Estimates ( 5 )NANANANANANA
(p-val)(NA )(NA )(NA )(NA )(NA )(NA )
Estimates ( 6 )NANANANANANA
(p-val)(NA )(NA )(NA )(NA )(NA )(NA )
Estimates ( 7 )NANANANANANA
(p-val)(NA )(NA )(NA )(NA )(NA )(NA )
Estimates ( 8 )NANANANANANA
(p-val)(NA )(NA )(NA )(NA )(NA )(NA )
Estimates ( 9 )NANANANANANA
(p-val)(NA )(NA )(NA )(NA )(NA )(NA )
Estimates ( 10 )NANANANANANA
(p-val)(NA )(NA )(NA )(NA )(NA )(NA )
Estimates ( 11 )NANANANANANA
(p-val)(NA )(NA )(NA )(NA )(NA )(NA )

\begin{tabular}{lllllllll}
\hline
ARIMA Parameter Estimation and Backward Selection \tabularnewline
Iteration & ar1 & ar2 & ma1 & sar1 & sar2 & sma1 \tabularnewline
Estimates ( 1 ) & 0.0058 & 0.8793 & 0.9823 & 0.802 & 0.1611 & -0.6756 \tabularnewline
(p-val) & (0.9473 ) & (0 ) & (0 ) & (0.0135 ) & (0.506 ) & (0.1684 ) \tabularnewline
Estimates ( 2 ) & 0 & 0.883 & 0.984 & 0.8019 & 0.1607 & -0.6718 \tabularnewline
(p-val) & (NA ) & (0 ) & (0 ) & (0.0115 ) & (0.5023 ) & (0.1523 ) \tabularnewline
Estimates ( 3 ) & 0 & 0.8857 & 0.983 & 0.9908 & 0 & -0.8531 \tabularnewline
(p-val) & (NA ) & (0 ) & (0 ) & (0 ) & (NA ) & (0 ) \tabularnewline
Estimates ( 4 ) & NA & NA & NA & NA & NA & NA \tabularnewline
(p-val) & (NA ) & (NA ) & (NA ) & (NA ) & (NA ) & (NA ) \tabularnewline
Estimates ( 5 ) & NA & NA & NA & NA & NA & NA \tabularnewline
(p-val) & (NA ) & (NA ) & (NA ) & (NA ) & (NA ) & (NA ) \tabularnewline
Estimates ( 6 ) & NA & NA & NA & NA & NA & NA \tabularnewline
(p-val) & (NA ) & (NA ) & (NA ) & (NA ) & (NA ) & (NA ) \tabularnewline
Estimates ( 7 ) & NA & NA & NA & NA & NA & NA \tabularnewline
(p-val) & (NA ) & (NA ) & (NA ) & (NA ) & (NA ) & (NA ) \tabularnewline
Estimates ( 8 ) & NA & NA & NA & NA & NA & NA \tabularnewline
(p-val) & (NA ) & (NA ) & (NA ) & (NA ) & (NA ) & (NA ) \tabularnewline
Estimates ( 9 ) & NA & NA & NA & NA & NA & NA \tabularnewline
(p-val) & (NA ) & (NA ) & (NA ) & (NA ) & (NA ) & (NA ) \tabularnewline
Estimates ( 10 ) & NA & NA & NA & NA & NA & NA \tabularnewline
(p-val) & (NA ) & (NA ) & (NA ) & (NA ) & (NA ) & (NA ) \tabularnewline
Estimates ( 11 ) & NA & NA & NA & NA & NA & NA \tabularnewline
(p-val) & (NA ) & (NA ) & (NA ) & (NA ) & (NA ) & (NA ) \tabularnewline
\hline
\end{tabular}
%Source: https://freestatistics.org/blog/index.php?pk=31095&T=1

[TABLE]
[ROW][C]ARIMA Parameter Estimation and Backward Selection[/C][/ROW]
[ROW][C]Iteration[/C][C]ar1[/C][C]ar2[/C][C]ma1[/C][C]sar1[/C][C]sar2[/C][C]sma1[/C][/ROW]
[ROW][C]Estimates ( 1 )[/C][C]0.0058[/C][C]0.8793[/C][C]0.9823[/C][C]0.802[/C][C]0.1611[/C][C]-0.6756[/C][/ROW]
[ROW][C](p-val)[/C][C](0.9473 )[/C][C](0 )[/C][C](0 )[/C][C](0.0135 )[/C][C](0.506 )[/C][C](0.1684 )[/C][/ROW]
[ROW][C]Estimates ( 2 )[/C][C]0[/C][C]0.883[/C][C]0.984[/C][C]0.8019[/C][C]0.1607[/C][C]-0.6718[/C][/ROW]
[ROW][C](p-val)[/C][C](NA )[/C][C](0 )[/C][C](0 )[/C][C](0.0115 )[/C][C](0.5023 )[/C][C](0.1523 )[/C][/ROW]
[ROW][C]Estimates ( 3 )[/C][C]0[/C][C]0.8857[/C][C]0.983[/C][C]0.9908[/C][C]0[/C][C]-0.8531[/C][/ROW]
[ROW][C](p-val)[/C][C](NA )[/C][C](0 )[/C][C](0 )[/C][C](0 )[/C][C](NA )[/C][C](0 )[/C][/ROW]
[ROW][C]Estimates ( 4 )[/C][C]NA[/C][C]NA[/C][C]NA[/C][C]NA[/C][C]NA[/C][C]NA[/C][/ROW]
[ROW][C](p-val)[/C][C](NA )[/C][C](NA )[/C][C](NA )[/C][C](NA )[/C][C](NA )[/C][C](NA )[/C][/ROW]
[ROW][C]Estimates ( 5 )[/C][C]NA[/C][C]NA[/C][C]NA[/C][C]NA[/C][C]NA[/C][C]NA[/C][/ROW]
[ROW][C](p-val)[/C][C](NA )[/C][C](NA )[/C][C](NA )[/C][C](NA )[/C][C](NA )[/C][C](NA )[/C][/ROW]
[ROW][C]Estimates ( 6 )[/C][C]NA[/C][C]NA[/C][C]NA[/C][C]NA[/C][C]NA[/C][C]NA[/C][/ROW]
[ROW][C](p-val)[/C][C](NA )[/C][C](NA )[/C][C](NA )[/C][C](NA )[/C][C](NA )[/C][C](NA )[/C][/ROW]
[ROW][C]Estimates ( 7 )[/C][C]NA[/C][C]NA[/C][C]NA[/C][C]NA[/C][C]NA[/C][C]NA[/C][/ROW]
[ROW][C](p-val)[/C][C](NA )[/C][C](NA )[/C][C](NA )[/C][C](NA )[/C][C](NA )[/C][C](NA )[/C][/ROW]
[ROW][C]Estimates ( 8 )[/C][C]NA[/C][C]NA[/C][C]NA[/C][C]NA[/C][C]NA[/C][C]NA[/C][/ROW]
[ROW][C](p-val)[/C][C](NA )[/C][C](NA )[/C][C](NA )[/C][C](NA )[/C][C](NA )[/C][C](NA )[/C][/ROW]
[ROW][C]Estimates ( 9 )[/C][C]NA[/C][C]NA[/C][C]NA[/C][C]NA[/C][C]NA[/C][C]NA[/C][/ROW]
[ROW][C](p-val)[/C][C](NA )[/C][C](NA )[/C][C](NA )[/C][C](NA )[/C][C](NA )[/C][C](NA )[/C][/ROW]
[ROW][C]Estimates ( 10 )[/C][C]NA[/C][C]NA[/C][C]NA[/C][C]NA[/C][C]NA[/C][C]NA[/C][/ROW]
[ROW][C](p-val)[/C][C](NA )[/C][C](NA )[/C][C](NA )[/C][C](NA )[/C][C](NA )[/C][C](NA )[/C][/ROW]
[ROW][C]Estimates ( 11 )[/C][C]NA[/C][C]NA[/C][C]NA[/C][C]NA[/C][C]NA[/C][C]NA[/C][/ROW]
[ROW][C](p-val)[/C][C](NA )[/C][C](NA )[/C][C](NA )[/C][C](NA )[/C][C](NA )[/C][C](NA )[/C][/ROW]
[/TABLE]
Source: https://freestatistics.org/blog/index.php?pk=31095&T=1

Globally Unique Identifier (entire table): ba.freestatistics.org/blog/index.php?pk=31095&T=1

As an alternative you can also use a QR Code:  

The GUIDs for individual cells are displayed in the table below:

ARIMA Parameter Estimation and Backward Selection
Iterationar1ar2ma1sar1sar2sma1
Estimates ( 1 )0.00580.87930.98230.8020.1611-0.6756
(p-val)(0.9473 )(0 )(0 )(0.0135 )(0.506 )(0.1684 )
Estimates ( 2 )00.8830.9840.80190.1607-0.6718
(p-val)(NA )(0 )(0 )(0.0115 )(0.5023 )(0.1523 )
Estimates ( 3 )00.88570.9830.99080-0.8531
(p-val)(NA )(0 )(0 )(0 )(NA )(0 )
Estimates ( 4 )NANANANANANA
(p-val)(NA )(NA )(NA )(NA )(NA )(NA )
Estimates ( 5 )NANANANANANA
(p-val)(NA )(NA )(NA )(NA )(NA )(NA )
Estimates ( 6 )NANANANANANA
(p-val)(NA )(NA )(NA )(NA )(NA )(NA )
Estimates ( 7 )NANANANANANA
(p-val)(NA )(NA )(NA )(NA )(NA )(NA )
Estimates ( 8 )NANANANANANA
(p-val)(NA )(NA )(NA )(NA )(NA )(NA )
Estimates ( 9 )NANANANANANA
(p-val)(NA )(NA )(NA )(NA )(NA )(NA )
Estimates ( 10 )NANANANANANA
(p-val)(NA )(NA )(NA )(NA )(NA )(NA )
Estimates ( 11 )NANANANANANA
(p-val)(NA )(NA )(NA )(NA )(NA )(NA )


Estimated ARIMA Residuals
Value
840.891793960502
923.620428260726
323.354986087769
-414.668014224318
739.38031772037
-146.275086261385
-137.749844923339
530.4153575236
-142.807046798771
-477.409922969146
1393.57702201425
388.530726931961
-383.32547932739
1250.79710492609
-1466.39465133322
667.195470582428
1543.31192154114
-1682.33543746809
273.014238251042
55.7188373746071
1154.65549045275
-513.302137010403
-128.692437915440
-325.490737825665
1254.97748091116
-123.329465467086
580.071451592474
1234.9298210009
-779.409897116735
-944.852187659935
1456.36972828094
-90.9586183178525
-40.8086835315776
198.851023822600
1085.81595400788
434.136797784522
-657.57148992036
228.479378282026
-974.698141408785
1083.80168304360
-825.254707303826
470.473113343958
2.35193541480018
207.985375480105
343.297629217007
-679.218338186588
-111.039449236626
66.4008028969775
-116.268257019672
127.237698560076
-386.416090799213
-423.72677845448
931.052159453252
187.805203754201
65.0567886957088
-1294.67506613929
2380.72730336612
-953.593166843841
-1148.70903310343
436.776266637001

\begin{tabular}{lllllllll}
\hline
Estimated ARIMA Residuals \tabularnewline
Value \tabularnewline
 \tabularnewline
840.891793960502 \tabularnewline
923.620428260726 \tabularnewline
323.354986087769 \tabularnewline
-414.668014224318 \tabularnewline
739.38031772037 \tabularnewline
-146.275086261385 \tabularnewline
-137.749844923339 \tabularnewline
530.4153575236 \tabularnewline
-142.807046798771 \tabularnewline
-477.409922969146 \tabularnewline
1393.57702201425 \tabularnewline
388.530726931961 \tabularnewline
-383.32547932739 \tabularnewline
1250.79710492609 \tabularnewline
-1466.39465133322 \tabularnewline
667.195470582428 \tabularnewline
1543.31192154114 \tabularnewline
-1682.33543746809 \tabularnewline
273.014238251042 \tabularnewline
55.7188373746071 \tabularnewline
1154.65549045275 \tabularnewline
-513.302137010403 \tabularnewline
-128.692437915440 \tabularnewline
-325.490737825665 \tabularnewline
1254.97748091116 \tabularnewline
-123.329465467086 \tabularnewline
580.071451592474 \tabularnewline
1234.9298210009 \tabularnewline
-779.409897116735 \tabularnewline
-944.852187659935 \tabularnewline
1456.36972828094 \tabularnewline
-90.9586183178525 \tabularnewline
-40.8086835315776 \tabularnewline
198.851023822600 \tabularnewline
1085.81595400788 \tabularnewline
434.136797784522 \tabularnewline
-657.57148992036 \tabularnewline
228.479378282026 \tabularnewline
-974.698141408785 \tabularnewline
1083.80168304360 \tabularnewline
-825.254707303826 \tabularnewline
470.473113343958 \tabularnewline
2.35193541480018 \tabularnewline
207.985375480105 \tabularnewline
343.297629217007 \tabularnewline
-679.218338186588 \tabularnewline
-111.039449236626 \tabularnewline
66.4008028969775 \tabularnewline
-116.268257019672 \tabularnewline
127.237698560076 \tabularnewline
-386.416090799213 \tabularnewline
-423.72677845448 \tabularnewline
931.052159453252 \tabularnewline
187.805203754201 \tabularnewline
65.0567886957088 \tabularnewline
-1294.67506613929 \tabularnewline
2380.72730336612 \tabularnewline
-953.593166843841 \tabularnewline
-1148.70903310343 \tabularnewline
436.776266637001 \tabularnewline
\hline
\end{tabular}
%Source: https://freestatistics.org/blog/index.php?pk=31095&T=2

[TABLE]
[ROW][C]Estimated ARIMA Residuals[/C][/ROW]
[ROW][C]Value[/C][/ROW]
[ROW][C][/C][/ROW]
[ROW][C]840.891793960502[/C][/ROW]
[ROW][C]923.620428260726[/C][/ROW]
[ROW][C]323.354986087769[/C][/ROW]
[ROW][C]-414.668014224318[/C][/ROW]
[ROW][C]739.38031772037[/C][/ROW]
[ROW][C]-146.275086261385[/C][/ROW]
[ROW][C]-137.749844923339[/C][/ROW]
[ROW][C]530.4153575236[/C][/ROW]
[ROW][C]-142.807046798771[/C][/ROW]
[ROW][C]-477.409922969146[/C][/ROW]
[ROW][C]1393.57702201425[/C][/ROW]
[ROW][C]388.530726931961[/C][/ROW]
[ROW][C]-383.32547932739[/C][/ROW]
[ROW][C]1250.79710492609[/C][/ROW]
[ROW][C]-1466.39465133322[/C][/ROW]
[ROW][C]667.195470582428[/C][/ROW]
[ROW][C]1543.31192154114[/C][/ROW]
[ROW][C]-1682.33543746809[/C][/ROW]
[ROW][C]273.014238251042[/C][/ROW]
[ROW][C]55.7188373746071[/C][/ROW]
[ROW][C]1154.65549045275[/C][/ROW]
[ROW][C]-513.302137010403[/C][/ROW]
[ROW][C]-128.692437915440[/C][/ROW]
[ROW][C]-325.490737825665[/C][/ROW]
[ROW][C]1254.97748091116[/C][/ROW]
[ROW][C]-123.329465467086[/C][/ROW]
[ROW][C]580.071451592474[/C][/ROW]
[ROW][C]1234.9298210009[/C][/ROW]
[ROW][C]-779.409897116735[/C][/ROW]
[ROW][C]-944.852187659935[/C][/ROW]
[ROW][C]1456.36972828094[/C][/ROW]
[ROW][C]-90.9586183178525[/C][/ROW]
[ROW][C]-40.8086835315776[/C][/ROW]
[ROW][C]198.851023822600[/C][/ROW]
[ROW][C]1085.81595400788[/C][/ROW]
[ROW][C]434.136797784522[/C][/ROW]
[ROW][C]-657.57148992036[/C][/ROW]
[ROW][C]228.479378282026[/C][/ROW]
[ROW][C]-974.698141408785[/C][/ROW]
[ROW][C]1083.80168304360[/C][/ROW]
[ROW][C]-825.254707303826[/C][/ROW]
[ROW][C]470.473113343958[/C][/ROW]
[ROW][C]2.35193541480018[/C][/ROW]
[ROW][C]207.985375480105[/C][/ROW]
[ROW][C]343.297629217007[/C][/ROW]
[ROW][C]-679.218338186588[/C][/ROW]
[ROW][C]-111.039449236626[/C][/ROW]
[ROW][C]66.4008028969775[/C][/ROW]
[ROW][C]-116.268257019672[/C][/ROW]
[ROW][C]127.237698560076[/C][/ROW]
[ROW][C]-386.416090799213[/C][/ROW]
[ROW][C]-423.72677845448[/C][/ROW]
[ROW][C]931.052159453252[/C][/ROW]
[ROW][C]187.805203754201[/C][/ROW]
[ROW][C]65.0567886957088[/C][/ROW]
[ROW][C]-1294.67506613929[/C][/ROW]
[ROW][C]2380.72730336612[/C][/ROW]
[ROW][C]-953.593166843841[/C][/ROW]
[ROW][C]-1148.70903310343[/C][/ROW]
[ROW][C]436.776266637001[/C][/ROW]
[/TABLE]
Source: https://freestatistics.org/blog/index.php?pk=31095&T=2

Globally Unique Identifier (entire table): ba.freestatistics.org/blog/index.php?pk=31095&T=2

As an alternative you can also use a QR Code:  

The GUIDs for individual cells are displayed in the table below:

Estimated ARIMA Residuals
Value
840.891793960502
923.620428260726
323.354986087769
-414.668014224318
739.38031772037
-146.275086261385
-137.749844923339
530.4153575236
-142.807046798771
-477.409922969146
1393.57702201425
388.530726931961
-383.32547932739
1250.79710492609
-1466.39465133322
667.195470582428
1543.31192154114
-1682.33543746809
273.014238251042
55.7188373746071
1154.65549045275
-513.302137010403
-128.692437915440
-325.490737825665
1254.97748091116
-123.329465467086
580.071451592474
1234.9298210009
-779.409897116735
-944.852187659935
1456.36972828094
-90.9586183178525
-40.8086835315776
198.851023822600
1085.81595400788
434.136797784522
-657.57148992036
228.479378282026
-974.698141408785
1083.80168304360
-825.254707303826
470.473113343958
2.35193541480018
207.985375480105
343.297629217007
-679.218338186588
-111.039449236626
66.4008028969775
-116.268257019672
127.237698560076
-386.416090799213
-423.72677845448
931.052159453252
187.805203754201
65.0567886957088
-1294.67506613929
2380.72730336612
-953.593166843841
-1148.70903310343
436.776266637001


Parameters (Session):
par1 = FALSE ; par2 = 1 ; par3 = 0 ; par4 = 0 ; par5 = 12 ; par6 = 2 ; par7 = 1 ; par8 = 2 ; par9 = 1 ;
Parameters (R input):
par1 = FALSE ; par2 = 1 ; par3 = 0 ; par4 = 0 ; par5 = 12 ; par6 = 2 ; par7 = 1 ; par8 = 2 ; par9 = 1 ;
R code (references can be found in the software module):
library(lattice)
if (par1 == 'TRUE') par1 <- TRUE
if (par1 == 'FALSE') par1 <- FALSE
par2 <- as.numeric(par2) #Box-Cox lambda transformation parameter
par3 <- as.numeric(par3) #degree of non-seasonal differencing
par4 <- as.numeric(par4) #degree of seasonal differencing
par5 <- as.numeric(par5) #seasonal period
par6 <- as.numeric(par6) #degree (p) of the non-seasonal AR(p) polynomial
par7 <- as.numeric(par7) #degree (q) of the non-seasonal MA(q) polynomial
par8 <- as.numeric(par8) #degree (P) of the seasonal AR(P) polynomial
par9 <- as.numeric(par9) #degree (Q) of the seasonal MA(Q) polynomial
armaGR <- function(arima.out, names, n){
try1 <- arima.out$coef
try2 <- sqrt(diag(arima.out$var.coef))
try.data.frame <- data.frame(matrix(NA,ncol=4,nrow=length(names)))
dimnames(try.data.frame) <- list(names,c('coef','std','tstat','pv'))
try.data.frame[,1] <- try1
for(i in 1:length(try2)) try.data.frame[which(rownames(try.data.frame)==names(try2)[i]),2] <- try2[i]
try.data.frame[,3] <- try.data.frame[,1] / try.data.frame[,2]
try.data.frame[,4] <- round((1-pt(abs(try.data.frame[,3]),df=n-(length(try2)+1)))*2,5)
vector <- rep(NA,length(names))
vector[is.na(try.data.frame[,4])] <- 0
maxi <- which.max(try.data.frame[,4])
continue <- max(try.data.frame[,4],na.rm=TRUE) > .05
vector[maxi] <- 0
list(summary=try.data.frame,next.vector=vector,continue=continue)
}
arimaSelect <- function(series, order=c(13,0,0), seasonal=list(order=c(2,0,0),period=12), include.mean=F){
nrc <- order[1]+order[3]+seasonal$order[1]+seasonal$order[3]
coeff <- matrix(NA, nrow=nrc*2, ncol=nrc)
pval <- matrix(NA, nrow=nrc*2, ncol=nrc)
mylist <- rep(list(NULL), nrc)
names <- NULL
if(order[1] > 0) names <- paste('ar',1:order[1],sep='')
if(order[3] > 0) names <- c( names , paste('ma',1:order[3],sep='') )
if(seasonal$order[1] > 0) names <- c(names, paste('sar',1:seasonal$order[1],sep=''))
if(seasonal$order[3] > 0) names <- c(names, paste('sma',1:seasonal$order[3],sep=''))
arima.out <- arima(series, order=order, seasonal=seasonal, include.mean=include.mean, method='ML')
mylist[[1]] <- arima.out
last.arma <- armaGR(arima.out, names, length(series))
mystop <- FALSE
i <- 1
coeff[i,] <- last.arma[[1]][,1]
pval [i,] <- last.arma[[1]][,4]
i <- 2
aic <- arima.out$aic
while(!mystop){
mylist[[i]] <- arima.out
arima.out <- arima(series, order=order, seasonal=seasonal, include.mean=include.mean, method='ML', fixed=last.arma$next.vector)
aic <- c(aic, arima.out$aic)
last.arma <- armaGR(arima.out, names, length(series))
mystop <- !last.arma$continue
coeff[i,] <- last.arma[[1]][,1]
pval [i,] <- last.arma[[1]][,4]
i <- i+1
}
list(coeff, pval, mylist, aic=aic)
}
arimaSelectplot <- function(arimaSelect.out,noms,choix){
noms <- names(arimaSelect.out[[3]][[1]]$coef)
coeff <- arimaSelect.out[[1]]
k <- min(which(is.na(coeff[,1])))-1
coeff <- coeff[1:k,]
pval <- arimaSelect.out[[2]][1:k,]
aic <- arimaSelect.out$aic[1:k]
coeff[coeff==0] <- NA
n <- ncol(coeff)
if(missing(choix)) choix <- k
layout(matrix(c(1,1,1,2,
3,3,3,2,
3,3,3,4,
5,6,7,7),nr=4),
widths=c(10,35,45,15),
heights=c(30,30,15,15))
couleurs <- rainbow(75)[1:50]#(50)
ticks <- pretty(coeff)
par(mar=c(1,1,3,1))
plot(aic,k:1-.5,type='o',pch=21,bg='blue',cex=2,axes=F,lty=2,xpd=NA)
points(aic[choix],k-choix+.5,pch=21,cex=4,bg=2,xpd=NA)
title('aic',line=2)
par(mar=c(3,0,0,0))
plot(0,axes=F,xlab='',ylab='',xlim=range(ticks),ylim=c(.1,1))
rect(xleft = min(ticks) + (0:49)/50*(max(ticks)-min(ticks)),
xright = min(ticks) + (1:50)/50*(max(ticks)-min(ticks)),
ytop = rep(1,50),
ybottom= rep(0,50),col=couleurs,border=NA)
axis(1,ticks)
rect(xleft=min(ticks),xright=max(ticks),ytop=1,ybottom=0)
text(mean(coeff,na.rm=T),.5,'coefficients',cex=2,font=2)
par(mar=c(1,1,3,1))
image(1:n,1:k,t(coeff[k:1,]),axes=F,col=couleurs,zlim=range(ticks))
for(i in 1:n) for(j in 1:k) if(!is.na(coeff[j,i])) {
if(pval[j,i]<.01) symb = 'green'
else if( (pval[j,i]<.05) & (pval[j,i]>=.01)) symb = 'orange'
else if( (pval[j,i]<.1) & (pval[j,i]>=.05)) symb = 'red'
else symb = 'black'
polygon(c(i+.5 ,i+.2 ,i+.5 ,i+.5),
c(k-j+0.5,k-j+0.5,k-j+0.8,k-j+0.5),
col=symb)
if(j==choix) {
rect(xleft=i-.5,
xright=i+.5,
ybottom=k-j+1.5,
ytop=k-j+.5,
lwd=4)
text(i,
k-j+1,
round(coeff[j,i],2),
cex=1.2,
font=2)
}
else{
rect(xleft=i-.5,xright=i+.5,ybottom=k-j+1.5,ytop=k-j+.5)
text(i,k-j+1,round(coeff[j,i],2),cex=1.2,font=1)
}
}
axis(3,1:n,noms)
par(mar=c(0.5,0,0,0.5))
plot(0,axes=F,xlab='',ylab='',type='n',xlim=c(0,8),ylim=c(-.2,.8))
cols <- c('green','orange','red','black')
niv <- c('0','0.01','0.05','0.1')
for(i in 0:3){
polygon(c(1+2*i ,1+2*i ,1+2*i-.5 ,1+2*i),
c(.4 ,.7 , .4 , .4),
col=cols[i+1])
text(2*i,0.5,niv[i+1],cex=1.5)
}
text(8,.5,1,cex=1.5)
text(4,0,'p-value',cex=2)
box()
residus <- arimaSelect.out[[3]][[choix]]$res
par(mar=c(1,2,4,1))
acf(residus,main='')
title('acf',line=.5)
par(mar=c(1,2,4,1))
pacf(residus,main='')
title('pacf',line=.5)
par(mar=c(2,2,4,1))
qqnorm(residus,main='')
title('qq-norm',line=.5)
qqline(residus)
residus
}
if (par2 == 0) x <- log(x)
if (par2 != 0) x <- x^par2
(selection <- arimaSelect(x, order=c(par6,par3,par7), seasonal=list(order=c(par8,par4,par9), period=par5)))
bitmap(file='test1.png')
resid <- arimaSelectplot(selection)
dev.off()
resid
bitmap(file='test2.png')
acf(resid,length(resid)/2, main='Residual Autocorrelation Function')
dev.off()
bitmap(file='test3.png')
pacf(resid,length(resid)/2, main='Residual Partial Autocorrelation Function')
dev.off()
bitmap(file='test4.png')
cpgram(resid, main='Residual Cumulative Periodogram')
dev.off()
bitmap(file='test5.png')
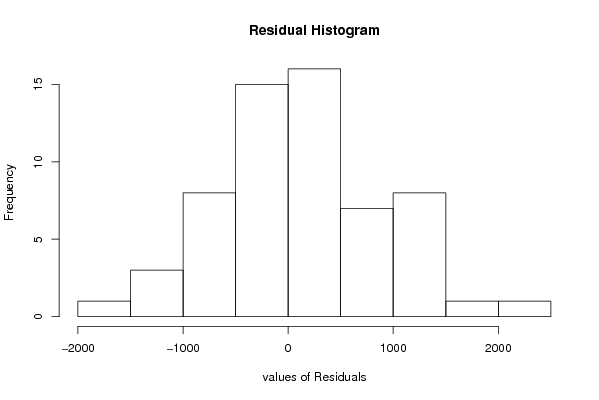
hist(resid, main='Residual Histogram', xlab='values of Residuals')
dev.off()
bitmap(file='test6.png')
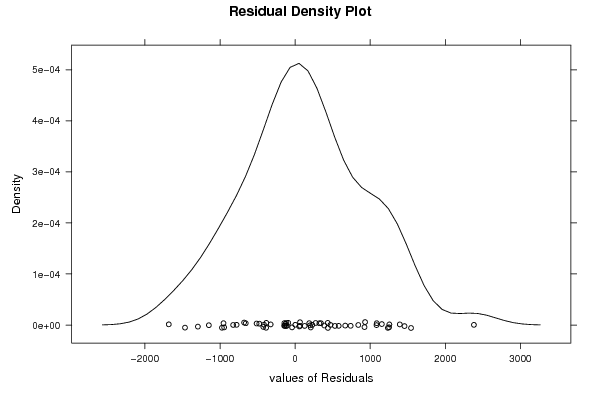
densityplot(~resid,col='black',main='Residual Density Plot', xlab='values of Residuals')
dev.off()
bitmap(file='test7.png')
qqnorm(resid, main='Residual Normal Q-Q Plot')
qqline(resid)
dev.off()
ncols <- length(selection[[1]][1,])
nrows <- length(selection[[2]][,1])-1
load(file='createtable')
a<-table.start()
a<-table.row.start(a)
a<-table.element(a,'ARIMA Parameter Estimation and Backward Selection', ncols+1,TRUE)
a<-table.row.end(a)
a<-table.row.start(a)
a<-table.element(a,'Iteration', header=TRUE)
for (i in 1:ncols) {
a<-table.element(a,names(selection[[3]][[1]]$coef)[i],header=TRUE)
}
a<-table.row.end(a)
for (j in 1:nrows) {
a<-table.row.start(a)
mydum <- 'Estimates ('
mydum <- paste(mydum,j)
mydum <- paste(mydum,')')
a<-table.element(a,mydum, header=TRUE)
for (i in 1:ncols) {
a<-table.element(a,round(selection[[1]][j,i],4))
}
a<-table.row.end(a)
a<-table.row.start(a)
a<-table.element(a,'(p-val)', header=TRUE)
for (i in 1:ncols) {
mydum <- '('
mydum <- paste(mydum,round(selection[[2]][j,i],4),sep='')
mydum <- paste(mydum,')')
a<-table.element(a,mydum)
}
a<-table.row.end(a)
}
a<-table.end(a)
table.save(a,file='mytable.tab')
a<-table.start()
a<-table.row.start(a)
a<-table.element(a,'Estimated ARIMA Residuals', 1,TRUE)
a<-table.row.end(a)
a<-table.row.start(a)
a<-table.element(a,'Value', 1,TRUE)
a<-table.row.end(a)
for (i in (par4*par5+par3):length(resid)) {
a<-table.row.start(a)
a<-table.element(a,resid[i])
a<-table.row.end(a)
}
a<-table.end(a)
table.save(a,file='mytable1.tab')