Free Statistics

of Irreproducible Research!

Author's title

Author*The author of this computation has been verified*
R Software Modulerwasp_autocorrelation.wasp
Title produced by software(Partial) Autocorrelation Function
Date of computationMon, 08 Dec 2008 14:58:33 -0700
Cite this page as followsStatistical Computations at FreeStatistics.org, Office for Research Development and Education, URL https://freestatistics.org/blog/index.php?v=date/2008/Dec/08/t1228773630ayfrg2x2l2achjs.htm/, Retrieved Thu, 16 May 2024 12:10:24 +0000
Statistical Computations at FreeStatistics.org, Office for Research Development and Education, URL https://freestatistics.org/blog/index.php?pk=31093, Retrieved Thu, 16 May 2024 12:10:24 +0000
QR Codes:

Original text written by user:
IsPrivate?No (this computation is public)
User-defined keywords
Estimated Impact168
Family? (F = Feedback message, R = changed R code, M = changed R Module, P = changed Parameters, D = changed Data)
F     [Law of Averages] [Random Walk Simul...] [2008-11-25 17:50:19] [b98453cac15ba1066b407e146608df68]
F       [Law of Averages] [Non Stationary Ti...] [2008-11-30 21:33:42] [82d201ca7b4e7cd2c6f885d29b5b6937]
F RMPD    [(Partial) Autocorrelation Function] [(P) ACF] [2008-12-08 21:03:21] [82d201ca7b4e7cd2c6f885d29b5b6937]
F   P         [(Partial) Autocorrelation Function] [acf] [2008-12-08 21:58:33] [00a0a665d7a07edd2e460056b0c0c354] [Current]
Feedback Forum
2008-12-15 21:55:06 [Inge Meelberghs] [reply
Dit zijn de gegevens die ik moet invullen:
Lags = 60
d = 0
D = 0
Λ = 1
Seasonal period = 12

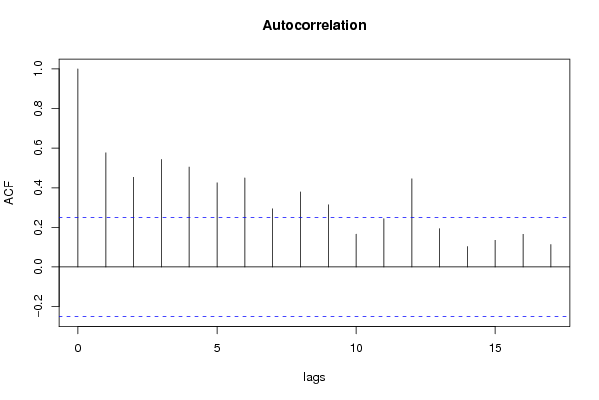
Zoals vermeld had ik de lags dus beter op 60 gezet doordat je dan een beter beeld krijgt van de LT-trend en het seizonaliteitspatroon. Uit de ACF kunnen we duidelijk een LT-trend en seizonaliteit waarnemen. Deze gaan we proberen uit te zuiveren door d = 0 en D = 1 in te vullen. We moeten dus 1 keer seizonaal differentiëren om de reeks stationair te maken. Dit doen we in stap 3.
2008-12-15 22:39:27 [Inge Meelberghs] [reply
Op mijn voorgaande uitleg moet ik even terugkomen door een gemaakte typfout. Er is in dit geval in mijn tijdreeks namelijk geen sprake van een lange termijn trend. Dit zien we ook in de grafiek. Enkel seizonaliteit is hier te bespeuren. Hierdoor moeten we ook enkel 1 keer seizonaal differentiëren en is d = 0.

Post a new message
Dataseries X:
11703.7
16283.6
16726.5
14968.9
14861
14583.3
15305.8
17903.9
16379.4
15420.3
17870.5
15912.8
13866.5
17823.2
17872
17420.4
16704.4
15991.2
16583.6
19123.5
17838.7
17209.4
18586.5
16258.1
15141.6
19202.1
17746.5
19090.1
18040.3
17515.5
17751.8
21072.4
17170
19439.5
19795.4
17574.9
16165.4
19464.6
19932.1
19961.2
17343.4
18924.2
18574.1
21350.6
18594.6
19823.1
20844.4
19640.2
17735.4
19813.6
22160
20664.3
17877.4
21211.2
21423.1
21688.7
23243.2
21490.2
22925.8
23184.8
18562.2


Summary of computational transaction
Raw Inputview raw input (R code)
Raw Outputview raw output of R engine
Computing time2 seconds
R Server'Herman Ole Andreas Wold' @ 193.190.124.10:1001

\begin{tabular}{lllllllll}
\hline
Summary of computational transaction \tabularnewline
Raw Input & view raw input (R code)  \tabularnewline
Raw Output & view raw output of R engine  \tabularnewline
Computing time & 2 seconds \tabularnewline
R Server & 'Herman Ole Andreas Wold' @ 193.190.124.10:1001 \tabularnewline
\hline
\end{tabular}
%Source: https://freestatistics.org/blog/index.php?pk=31093&T=0

[TABLE]
[ROW][C]Summary of computational transaction[/C][/ROW]
[ROW][C]Raw Input[/C][C]view raw input (R code) [/C][/ROW]
[ROW][C]Raw Output[/C][C]view raw output of R engine [/C][/ROW]
[ROW][C]Computing time[/C][C]2 seconds[/C][/ROW]
[ROW][C]R Server[/C][C]'Herman Ole Andreas Wold' @ 193.190.124.10:1001[/C][/ROW]
[/TABLE]
Source: https://freestatistics.org/blog/index.php?pk=31093&T=0

Globally Unique Identifier (entire table): ba.freestatistics.org/blog/index.php?pk=31093&T=0

As an alternative you can also use a QR Code:  

The GUIDs for individual cells are displayed in the table below:

Summary of computational transaction
Raw Inputview raw input (R code)
Raw Outputview raw output of R engine
Computing time2 seconds
R Server'Herman Ole Andreas Wold' @ 193.190.124.10:1001


Autocorrelation Function
Time lag kACF(k)T-STATP-value
10.5767894.50491.5e-05
20.4529233.53740.000389
30.5430694.24153.8e-05
40.5045183.94040.000106
50.4247123.31710.000768
60.4494273.51010.000424
70.293712.29390.012626
80.3790822.96070.002184
90.3140342.45270.008527
100.1655441.29290.100454
110.2439361.90520.030735
120.4451993.47710.00047
130.1931111.50820.068327
140.1030160.80460.212094
150.13471.0520.148466
160.1645691.28530.101768
170.1130040.88260.190462

\begin{tabular}{lllllllll}
\hline
Autocorrelation Function \tabularnewline
Time lag k & ACF(k) & T-STAT & P-value \tabularnewline
1 & 0.576789 & 4.5049 & 1.5e-05 \tabularnewline
2 & 0.452923 & 3.5374 & 0.000389 \tabularnewline
3 & 0.543069 & 4.2415 & 3.8e-05 \tabularnewline
4 & 0.504518 & 3.9404 & 0.000106 \tabularnewline
5 & 0.424712 & 3.3171 & 0.000768 \tabularnewline
6 & 0.449427 & 3.5101 & 0.000424 \tabularnewline
7 & 0.29371 & 2.2939 & 0.012626 \tabularnewline
8 & 0.379082 & 2.9607 & 0.002184 \tabularnewline
9 & 0.314034 & 2.4527 & 0.008527 \tabularnewline
10 & 0.165544 & 1.2929 & 0.100454 \tabularnewline
11 & 0.243936 & 1.9052 & 0.030735 \tabularnewline
12 & 0.445199 & 3.4771 & 0.00047 \tabularnewline
13 & 0.193111 & 1.5082 & 0.068327 \tabularnewline
14 & 0.103016 & 0.8046 & 0.212094 \tabularnewline
15 & 0.1347 & 1.052 & 0.148466 \tabularnewline
16 & 0.164569 & 1.2853 & 0.101768 \tabularnewline
17 & 0.113004 & 0.8826 & 0.190462 \tabularnewline
\hline
\end{tabular}
%Source: https://freestatistics.org/blog/index.php?pk=31093&T=1

[TABLE]
[ROW][C]Autocorrelation Function[/C][/ROW]
[ROW][C]Time lag k[/C][C]ACF(k)[/C][C]T-STAT[/C][C]P-value[/C][/ROW]
[ROW][C]1[/C][C]0.576789[/C][C]4.5049[/C][C]1.5e-05[/C][/ROW]
[ROW][C]2[/C][C]0.452923[/C][C]3.5374[/C][C]0.000389[/C][/ROW]
[ROW][C]3[/C][C]0.543069[/C][C]4.2415[/C][C]3.8e-05[/C][/ROW]
[ROW][C]4[/C][C]0.504518[/C][C]3.9404[/C][C]0.000106[/C][/ROW]
[ROW][C]5[/C][C]0.424712[/C][C]3.3171[/C][C]0.000768[/C][/ROW]
[ROW][C]6[/C][C]0.449427[/C][C]3.5101[/C][C]0.000424[/C][/ROW]
[ROW][C]7[/C][C]0.29371[/C][C]2.2939[/C][C]0.012626[/C][/ROW]
[ROW][C]8[/C][C]0.379082[/C][C]2.9607[/C][C]0.002184[/C][/ROW]
[ROW][C]9[/C][C]0.314034[/C][C]2.4527[/C][C]0.008527[/C][/ROW]
[ROW][C]10[/C][C]0.165544[/C][C]1.2929[/C][C]0.100454[/C][/ROW]
[ROW][C]11[/C][C]0.243936[/C][C]1.9052[/C][C]0.030735[/C][/ROW]
[ROW][C]12[/C][C]0.445199[/C][C]3.4771[/C][C]0.00047[/C][/ROW]
[ROW][C]13[/C][C]0.193111[/C][C]1.5082[/C][C]0.068327[/C][/ROW]
[ROW][C]14[/C][C]0.103016[/C][C]0.8046[/C][C]0.212094[/C][/ROW]
[ROW][C]15[/C][C]0.1347[/C][C]1.052[/C][C]0.148466[/C][/ROW]
[ROW][C]16[/C][C]0.164569[/C][C]1.2853[/C][C]0.101768[/C][/ROW]
[ROW][C]17[/C][C]0.113004[/C][C]0.8826[/C][C]0.190462[/C][/ROW]
[/TABLE]
Source: https://freestatistics.org/blog/index.php?pk=31093&T=1

Globally Unique Identifier (entire table): ba.freestatistics.org/blog/index.php?pk=31093&T=1

As an alternative you can also use a QR Code:  

The GUIDs for individual cells are displayed in the table below:

Autocorrelation Function
Time lag kACF(k)T-STATP-value
10.5767894.50491.5e-05
20.4529233.53740.000389
30.5430694.24153.8e-05
40.5045183.94040.000106
50.4247123.31710.000768
60.4494273.51010.000424
70.293712.29390.012626
80.3790822.96070.002184
90.3140342.45270.008527
100.1655441.29290.100454
110.2439361.90520.030735
120.4451993.47710.00047
130.1931111.50820.068327
140.1030160.80460.212094
150.13471.0520.148466
160.1645691.28530.101768
170.1130040.88260.190462


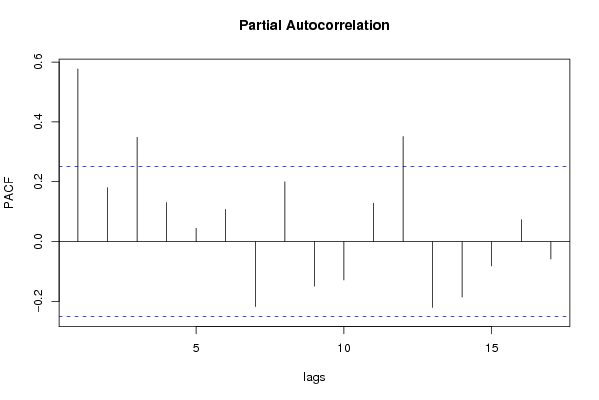
Partial Autocorrelation Function
Time lag kPACF(k)T-STATP-value
10.5767894.50491.5e-05
20.1801811.40730.082213
30.3484432.72140.00423
40.1301981.01690.156614
50.0442820.34590.365321
60.1072640.83780.202719
7-0.217128-1.69580.047509
80.1995371.55840.062152
9-0.149358-1.16650.123972
10-0.128289-1.0020.160158
110.1282951.0020.160147
120.3508362.74010.004022
13-0.220308-1.72070.045191
14-0.185603-1.44960.076145
15-0.081376-0.63560.263719
160.0729580.56980.285447
17-0.058324-0.45550.325176

\begin{tabular}{lllllllll}
\hline
Partial Autocorrelation Function \tabularnewline
Time lag k & PACF(k) & T-STAT & P-value \tabularnewline
1 & 0.576789 & 4.5049 & 1.5e-05 \tabularnewline
2 & 0.180181 & 1.4073 & 0.082213 \tabularnewline
3 & 0.348443 & 2.7214 & 0.00423 \tabularnewline
4 & 0.130198 & 1.0169 & 0.156614 \tabularnewline
5 & 0.044282 & 0.3459 & 0.365321 \tabularnewline
6 & 0.107264 & 0.8378 & 0.202719 \tabularnewline
7 & -0.217128 & -1.6958 & 0.047509 \tabularnewline
8 & 0.199537 & 1.5584 & 0.062152 \tabularnewline
9 & -0.149358 & -1.1665 & 0.123972 \tabularnewline
10 & -0.128289 & -1.002 & 0.160158 \tabularnewline
11 & 0.128295 & 1.002 & 0.160147 \tabularnewline
12 & 0.350836 & 2.7401 & 0.004022 \tabularnewline
13 & -0.220308 & -1.7207 & 0.045191 \tabularnewline
14 & -0.185603 & -1.4496 & 0.076145 \tabularnewline
15 & -0.081376 & -0.6356 & 0.263719 \tabularnewline
16 & 0.072958 & 0.5698 & 0.285447 \tabularnewline
17 & -0.058324 & -0.4555 & 0.325176 \tabularnewline
\hline
\end{tabular}
%Source: https://freestatistics.org/blog/index.php?pk=31093&T=2

[TABLE]
[ROW][C]Partial Autocorrelation Function[/C][/ROW]
[ROW][C]Time lag k[/C][C]PACF(k)[/C][C]T-STAT[/C][C]P-value[/C][/ROW]
[ROW][C]1[/C][C]0.576789[/C][C]4.5049[/C][C]1.5e-05[/C][/ROW]
[ROW][C]2[/C][C]0.180181[/C][C]1.4073[/C][C]0.082213[/C][/ROW]
[ROW][C]3[/C][C]0.348443[/C][C]2.7214[/C][C]0.00423[/C][/ROW]
[ROW][C]4[/C][C]0.130198[/C][C]1.0169[/C][C]0.156614[/C][/ROW]
[ROW][C]5[/C][C]0.044282[/C][C]0.3459[/C][C]0.365321[/C][/ROW]
[ROW][C]6[/C][C]0.107264[/C][C]0.8378[/C][C]0.202719[/C][/ROW]
[ROW][C]7[/C][C]-0.217128[/C][C]-1.6958[/C][C]0.047509[/C][/ROW]
[ROW][C]8[/C][C]0.199537[/C][C]1.5584[/C][C]0.062152[/C][/ROW]
[ROW][C]9[/C][C]-0.149358[/C][C]-1.1665[/C][C]0.123972[/C][/ROW]
[ROW][C]10[/C][C]-0.128289[/C][C]-1.002[/C][C]0.160158[/C][/ROW]
[ROW][C]11[/C][C]0.128295[/C][C]1.002[/C][C]0.160147[/C][/ROW]
[ROW][C]12[/C][C]0.350836[/C][C]2.7401[/C][C]0.004022[/C][/ROW]
[ROW][C]13[/C][C]-0.220308[/C][C]-1.7207[/C][C]0.045191[/C][/ROW]
[ROW][C]14[/C][C]-0.185603[/C][C]-1.4496[/C][C]0.076145[/C][/ROW]
[ROW][C]15[/C][C]-0.081376[/C][C]-0.6356[/C][C]0.263719[/C][/ROW]
[ROW][C]16[/C][C]0.072958[/C][C]0.5698[/C][C]0.285447[/C][/ROW]
[ROW][C]17[/C][C]-0.058324[/C][C]-0.4555[/C][C]0.325176[/C][/ROW]
[/TABLE]
Source: https://freestatistics.org/blog/index.php?pk=31093&T=2

Globally Unique Identifier (entire table): ba.freestatistics.org/blog/index.php?pk=31093&T=2

As an alternative you can also use a QR Code:  

The GUIDs for individual cells are displayed in the table below:

Partial Autocorrelation Function
Time lag kPACF(k)T-STATP-value
10.5767894.50491.5e-05
20.1801811.40730.082213
30.3484432.72140.00423
40.1301981.01690.156614
50.0442820.34590.365321
60.1072640.83780.202719
7-0.217128-1.69580.047509
80.1995371.55840.062152
9-0.149358-1.16650.123972
10-0.128289-1.0020.160158
110.1282951.0020.160147
120.3508362.74010.004022
13-0.220308-1.72070.045191
14-0.185603-1.44960.076145
15-0.081376-0.63560.263719
160.0729580.56980.285447
17-0.058324-0.45550.325176


Parameters (Session):
par1 = Default ; par2 = 1 ; par3 = 0 ; par4 = 0 ; par5 = 12 ;
Parameters (R input):
par1 = Default ; par2 = 1 ; par3 = 0 ; par4 = 0 ; par5 = 12 ;
R code (references can be found in the software module):
if (par1 == 'Default') {
par1 = 10*log10(length(x))
} else {
par1 <- as.numeric(par1)
}
par2 <- as.numeric(par2)
par3 <- as.numeric(par3)
par4 <- as.numeric(par4)
par5 <- as.numeric(par5)
if (par2 == 0) {
x <- log(x)
} else {
x <- (x ^ par2 - 1) / par2
}
if (par3 > 0) x <- diff(x,lag=1,difference=par3)
if (par4 > 0) x <- diff(x,lag=par5,difference=par4)
bitmap(file='pic1.png')
racf <- acf(x,par1,main='Autocorrelation',xlab='lags',ylab='ACF')
dev.off()
bitmap(file='pic2.png')
rpacf <- pacf(x,par1,main='Partial Autocorrelation',xlab='lags',ylab='PACF')
dev.off()
(myacf <- c(racf$acf))
(mypacf <- c(rpacf$acf))
lengthx <- length(x)
sqrtn <- sqrt(lengthx)
load(file='createtable')
a<-table.start()
a<-table.row.start(a)
a<-table.element(a,'Autocorrelation Function',4,TRUE)
a<-table.row.end(a)
a<-table.row.start(a)
a<-table.element(a,'Time lag k',header=TRUE)
a<-table.element(a,hyperlink('basics.htm','ACF(k)','click here for more information about the Autocorrelation Function'),header=TRUE)
a<-table.element(a,'T-STAT',header=TRUE)
a<-table.element(a,'P-value',header=TRUE)
a<-table.row.end(a)
for (i in 2:(par1+1)) {
a<-table.row.start(a)
a<-table.element(a,i-1,header=TRUE)
a<-table.element(a,round(myacf[i],6))
mytstat <- myacf[i]*sqrtn
a<-table.element(a,round(mytstat,4))
a<-table.element(a,round(1-pt(abs(mytstat),lengthx),6))
a<-table.row.end(a)
}
a<-table.end(a)
table.save(a,file='mytable.tab')
a<-table.start()
a<-table.row.start(a)
a<-table.element(a,'Partial Autocorrelation Function',4,TRUE)
a<-table.row.end(a)
a<-table.row.start(a)
a<-table.element(a,'Time lag k',header=TRUE)
a<-table.element(a,hyperlink('basics.htm','PACF(k)','click here for more information about the Partial Autocorrelation Function'),header=TRUE)
a<-table.element(a,'T-STAT',header=TRUE)
a<-table.element(a,'P-value',header=TRUE)
a<-table.row.end(a)
for (i in 1:par1) {
a<-table.row.start(a)
a<-table.element(a,i,header=TRUE)
a<-table.element(a,round(mypacf[i],6))
mytstat <- mypacf[i]*sqrtn
a<-table.element(a,round(mytstat,4))
a<-table.element(a,round(1-pt(abs(mytstat),lengthx),6))
a<-table.row.end(a)
}
a<-table.end(a)
table.save(a,file='mytable1.tab')