Free Statistics

of Irreproducible Research!

Author's title

Author*The author of this computation has been verified*
R Software Modulerwasp_arimabackwardselection.wasp
Title produced by softwareARIMA Backward Selection
Date of computationMon, 08 Dec 2008 14:50:31 -0700
Cite this page as followsStatistical Computations at FreeStatistics.org, Office for Research Development and Education, URL https://freestatistics.org/blog/index.php?v=date/2008/Dec/08/t1228773096g4dqcihhqn2bwtl.htm/, Retrieved Thu, 16 May 2024 11:13:14 +0000
Statistical Computations at FreeStatistics.org, Office for Research Development and Education, URL https://freestatistics.org/blog/index.php?pk=31089, Retrieved Thu, 16 May 2024 11:13:14 +0000
QR Codes:

Original text written by user:
IsPrivate?No (this computation is public)
User-defined keywords
Estimated Impact183
Family? (F = Feedback message, R = changed R code, M = changed R Module, P = changed Parameters, D = changed Data)
-     [Univariate Data Series] [Werkloosheid -25 ...] [2008-11-28 13:09:39] [6743688719638b0cb1c0a6e0bf433315]
-   P   [Univariate Data Series] [Unemployment unde...] [2008-12-02 17:58:48] [6743688719638b0cb1c0a6e0bf433315]
F RMP     [Variance Reduction Matrix] [Total unemploymen...] [2008-12-03 16:34:29] [6743688719638b0cb1c0a6e0bf433315]
F RM        [Standard Deviation-Mean Plot] [Under 25] [2008-12-08 21:47:27] [6743688719638b0cb1c0a6e0bf433315]
F RMP           [ARIMA Backward Selection] [ARMA] [2008-12-08 21:50:31] [9b05d7ef5dbcfba4217d280d9092f628] [Current]
Feedback Forum
2008-12-12 14:22:06 [9142cf052ad32d043faa9486189092cf] [reply
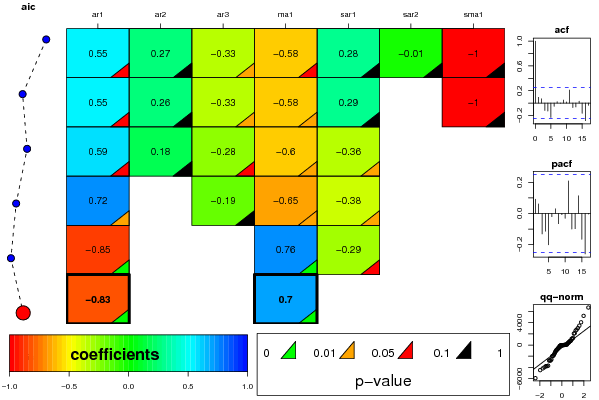
Het ARIMA model met Backward Selection method ontdekt nog 2 significante methodes namelijk het AR1 + MA1 patroon. Dit heeft de student ook vermeld in zijn conclusie.
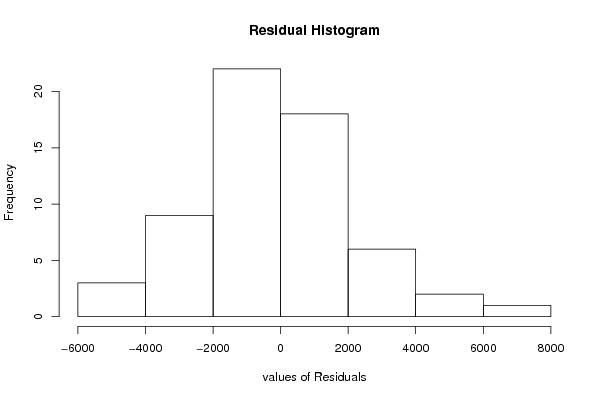
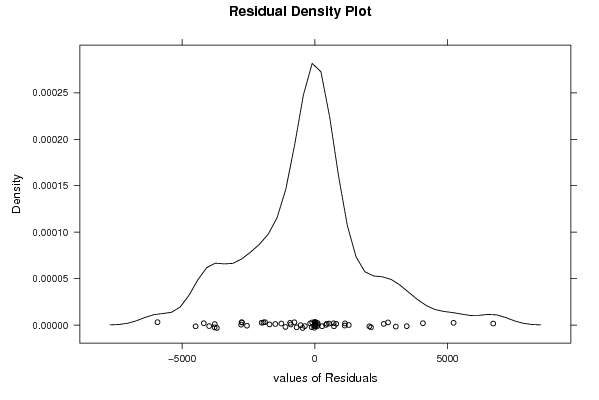
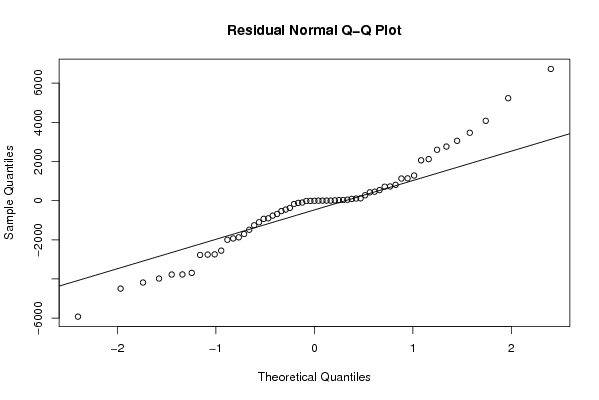
De Residual normal Q-Q plot vertoond geen normaal verdeling. Zoals de student vermeld heeft zien we op de density plot ook geen normaalverdeling.
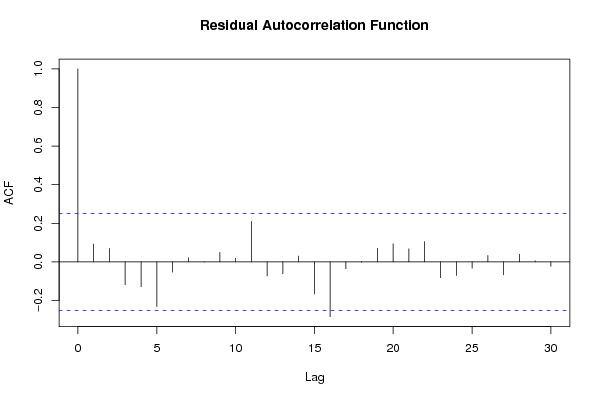
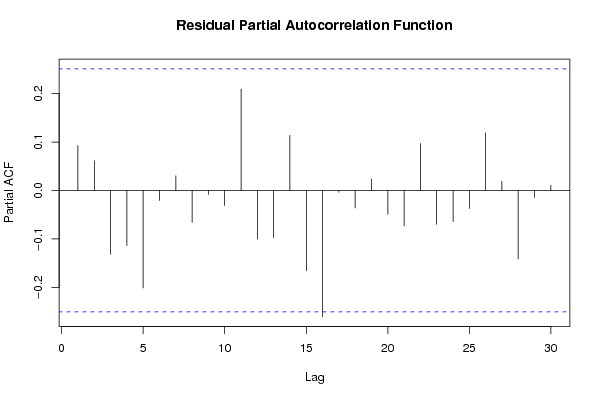
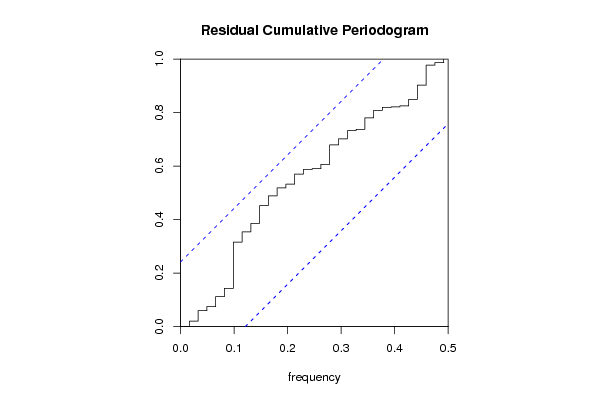
De conclusie van de student is correct het model is nog niet op punt.

Post a new message
Dataseries X:
150739
159129
157928
147768
137507
136919
136151
133001
125554
119647
114158
116193
152803
161761
160942
149470
139208
134588
130322
126611
122401
117352
112135
112879
148729
157230
157221
146681
136524
132111
125326
122716
116615
113719
110737
112093
143565
149946
149147
134339
122683
115614
116566
111272
104609
101802
94542
93051
124129
130374
123946
114971
105531
104919
104782
101281
94545
93248
84031
87486
115867


Summary of computational transaction
Raw Inputview raw input (R code)
Raw Outputview raw output of R engine
Computing time9 seconds
R Server'Gwilym Jenkins' @ 72.249.127.135

\begin{tabular}{lllllllll}
\hline
Summary of computational transaction \tabularnewline
Raw Input & view raw input (R code)  \tabularnewline
Raw Output & view raw output of R engine  \tabularnewline
Computing time & 9 seconds \tabularnewline
R Server & 'Gwilym Jenkins' @ 72.249.127.135 \tabularnewline
\hline
\end{tabular}
%Source: https://freestatistics.org/blog/index.php?pk=31089&T=0

[TABLE]
[ROW][C]Summary of computational transaction[/C][/ROW]
[ROW][C]Raw Input[/C][C]view raw input (R code) [/C][/ROW]
[ROW][C]Raw Output[/C][C]view raw output of R engine [/C][/ROW]
[ROW][C]Computing time[/C][C]9 seconds[/C][/ROW]
[ROW][C]R Server[/C][C]'Gwilym Jenkins' @ 72.249.127.135[/C][/ROW]
[/TABLE]
Source: https://freestatistics.org/blog/index.php?pk=31089&T=0

Globally Unique Identifier (entire table): ba.freestatistics.org/blog/index.php?pk=31089&T=0

As an alternative you can also use a QR Code:  

The GUIDs for individual cells are displayed in the table below:

Summary of computational transaction
Raw Inputview raw input (R code)
Raw Outputview raw output of R engine
Computing time9 seconds
R Server'Gwilym Jenkins' @ 72.249.127.135


ARIMA Parameter Estimation and Backward Selection
Iterationar1ar2ar3ma1sar1sar2sma1
Estimates ( 1 )0.5460.2653-0.3327-0.57630.2826-0.0147-0.9977
(p-val)(0.0803 )(0.1329 )(0.0317 )(0.0514 )(0.2797 )(0.9563 )(0.3082 )
Estimates ( 2 )0.54830.2623-0.3312-0.57720.28860-0.9956
(p-val)(0.0755 )(0.1162 )(0.0284 )(0.0498 )(0.2063 )(NA )(0.256 )
Estimates ( 3 )0.59290.1767-0.2791-0.5992-0.359300
(p-val)(0.0643 )(0.2934 )(0.0534 )(0.0493 )(0.0243 )(NA )(NA )
Estimates ( 4 )0.72190-0.1937-0.6493-0.378800
(p-val)(0.0126 )(NA )(0.1042 )(0.0153 )(0.0169 )(NA )(NA )
Estimates ( 5 )-0.8502000.7553-0.29300
(p-val)(5e-04 )(NA )(NA )(0.0049 )(0.0756 )(NA )(NA )
Estimates ( 6 )-0.8329000.7045000
(p-val)(0 )(NA )(NA )(0.0014 )(NA )(NA )(NA )
Estimates ( 7 )NANANANANANANA
(p-val)(NA )(NA )(NA )(NA )(NA )(NA )(NA )
Estimates ( 8 )NANANANANANANA
(p-val)(NA )(NA )(NA )(NA )(NA )(NA )(NA )
Estimates ( 9 )NANANANANANANA
(p-val)(NA )(NA )(NA )(NA )(NA )(NA )(NA )
Estimates ( 10 )NANANANANANANA
(p-val)(NA )(NA )(NA )(NA )(NA )(NA )(NA )
Estimates ( 11 )NANANANANANANA
(p-val)(NA )(NA )(NA )(NA )(NA )(NA )(NA )
Estimates ( 12 )NANANANANANANA
(p-val)(NA )(NA )(NA )(NA )(NA )(NA )(NA )
Estimates ( 13 )NANANANANANANA
(p-val)(NA )(NA )(NA )(NA )(NA )(NA )(NA )

\begin{tabular}{lllllllll}
\hline
ARIMA Parameter Estimation and Backward Selection \tabularnewline
Iteration & ar1 & ar2 & ar3 & ma1 & sar1 & sar2 & sma1 \tabularnewline
Estimates ( 1 ) & 0.546 & 0.2653 & -0.3327 & -0.5763 & 0.2826 & -0.0147 & -0.9977 \tabularnewline
(p-val) & (0.0803 ) & (0.1329 ) & (0.0317 ) & (0.0514 ) & (0.2797 ) & (0.9563 ) & (0.3082 ) \tabularnewline
Estimates ( 2 ) & 0.5483 & 0.2623 & -0.3312 & -0.5772 & 0.2886 & 0 & -0.9956 \tabularnewline
(p-val) & (0.0755 ) & (0.1162 ) & (0.0284 ) & (0.0498 ) & (0.2063 ) & (NA ) & (0.256 ) \tabularnewline
Estimates ( 3 ) & 0.5929 & 0.1767 & -0.2791 & -0.5992 & -0.3593 & 0 & 0 \tabularnewline
(p-val) & (0.0643 ) & (0.2934 ) & (0.0534 ) & (0.0493 ) & (0.0243 ) & (NA ) & (NA ) \tabularnewline
Estimates ( 4 ) & 0.7219 & 0 & -0.1937 & -0.6493 & -0.3788 & 0 & 0 \tabularnewline
(p-val) & (0.0126 ) & (NA ) & (0.1042 ) & (0.0153 ) & (0.0169 ) & (NA ) & (NA ) \tabularnewline
Estimates ( 5 ) & -0.8502 & 0 & 0 & 0.7553 & -0.293 & 0 & 0 \tabularnewline
(p-val) & (5e-04 ) & (NA ) & (NA ) & (0.0049 ) & (0.0756 ) & (NA ) & (NA ) \tabularnewline
Estimates ( 6 ) & -0.8329 & 0 & 0 & 0.7045 & 0 & 0 & 0 \tabularnewline
(p-val) & (0 ) & (NA ) & (NA ) & (0.0014 ) & (NA ) & (NA ) & (NA ) \tabularnewline
Estimates ( 7 ) & NA & NA & NA & NA & NA & NA & NA \tabularnewline
(p-val) & (NA ) & (NA ) & (NA ) & (NA ) & (NA ) & (NA ) & (NA ) \tabularnewline
Estimates ( 8 ) & NA & NA & NA & NA & NA & NA & NA \tabularnewline
(p-val) & (NA ) & (NA ) & (NA ) & (NA ) & (NA ) & (NA ) & (NA ) \tabularnewline
Estimates ( 9 ) & NA & NA & NA & NA & NA & NA & NA \tabularnewline
(p-val) & (NA ) & (NA ) & (NA ) & (NA ) & (NA ) & (NA ) & (NA ) \tabularnewline
Estimates ( 10 ) & NA & NA & NA & NA & NA & NA & NA \tabularnewline
(p-val) & (NA ) & (NA ) & (NA ) & (NA ) & (NA ) & (NA ) & (NA ) \tabularnewline
Estimates ( 11 ) & NA & NA & NA & NA & NA & NA & NA \tabularnewline
(p-val) & (NA ) & (NA ) & (NA ) & (NA ) & (NA ) & (NA ) & (NA ) \tabularnewline
Estimates ( 12 ) & NA & NA & NA & NA & NA & NA & NA \tabularnewline
(p-val) & (NA ) & (NA ) & (NA ) & (NA ) & (NA ) & (NA ) & (NA ) \tabularnewline
Estimates ( 13 ) & NA & NA & NA & NA & NA & NA & NA \tabularnewline
(p-val) & (NA ) & (NA ) & (NA ) & (NA ) & (NA ) & (NA ) & (NA ) \tabularnewline
\hline
\end{tabular}
%Source: https://freestatistics.org/blog/index.php?pk=31089&T=1

[TABLE]
[ROW][C]ARIMA Parameter Estimation and Backward Selection[/C][/ROW]
[ROW][C]Iteration[/C][C]ar1[/C][C]ar2[/C][C]ar3[/C][C]ma1[/C][C]sar1[/C][C]sar2[/C][C]sma1[/C][/ROW]
[ROW][C]Estimates ( 1 )[/C][C]0.546[/C][C]0.2653[/C][C]-0.3327[/C][C]-0.5763[/C][C]0.2826[/C][C]-0.0147[/C][C]-0.9977[/C][/ROW]
[ROW][C](p-val)[/C][C](0.0803 )[/C][C](0.1329 )[/C][C](0.0317 )[/C][C](0.0514 )[/C][C](0.2797 )[/C][C](0.9563 )[/C][C](0.3082 )[/C][/ROW]
[ROW][C]Estimates ( 2 )[/C][C]0.5483[/C][C]0.2623[/C][C]-0.3312[/C][C]-0.5772[/C][C]0.2886[/C][C]0[/C][C]-0.9956[/C][/ROW]
[ROW][C](p-val)[/C][C](0.0755 )[/C][C](0.1162 )[/C][C](0.0284 )[/C][C](0.0498 )[/C][C](0.2063 )[/C][C](NA )[/C][C](0.256 )[/C][/ROW]
[ROW][C]Estimates ( 3 )[/C][C]0.5929[/C][C]0.1767[/C][C]-0.2791[/C][C]-0.5992[/C][C]-0.3593[/C][C]0[/C][C]0[/C][/ROW]
[ROW][C](p-val)[/C][C](0.0643 )[/C][C](0.2934 )[/C][C](0.0534 )[/C][C](0.0493 )[/C][C](0.0243 )[/C][C](NA )[/C][C](NA )[/C][/ROW]
[ROW][C]Estimates ( 4 )[/C][C]0.7219[/C][C]0[/C][C]-0.1937[/C][C]-0.6493[/C][C]-0.3788[/C][C]0[/C][C]0[/C][/ROW]
[ROW][C](p-val)[/C][C](0.0126 )[/C][C](NA )[/C][C](0.1042 )[/C][C](0.0153 )[/C][C](0.0169 )[/C][C](NA )[/C][C](NA )[/C][/ROW]
[ROW][C]Estimates ( 5 )[/C][C]-0.8502[/C][C]0[/C][C]0[/C][C]0.7553[/C][C]-0.293[/C][C]0[/C][C]0[/C][/ROW]
[ROW][C](p-val)[/C][C](5e-04 )[/C][C](NA )[/C][C](NA )[/C][C](0.0049 )[/C][C](0.0756 )[/C][C](NA )[/C][C](NA )[/C][/ROW]
[ROW][C]Estimates ( 6 )[/C][C]-0.8329[/C][C]0[/C][C]0[/C][C]0.7045[/C][C]0[/C][C]0[/C][C]0[/C][/ROW]
[ROW][C](p-val)[/C][C](0 )[/C][C](NA )[/C][C](NA )[/C][C](0.0014 )[/C][C](NA )[/C][C](NA )[/C][C](NA )[/C][/ROW]
[ROW][C]Estimates ( 7 )[/C][C]NA[/C][C]NA[/C][C]NA[/C][C]NA[/C][C]NA[/C][C]NA[/C][C]NA[/C][/ROW]
[ROW][C](p-val)[/C][C](NA )[/C][C](NA )[/C][C](NA )[/C][C](NA )[/C][C](NA )[/C][C](NA )[/C][C](NA )[/C][/ROW]
[ROW][C]Estimates ( 8 )[/C][C]NA[/C][C]NA[/C][C]NA[/C][C]NA[/C][C]NA[/C][C]NA[/C][C]NA[/C][/ROW]
[ROW][C](p-val)[/C][C](NA )[/C][C](NA )[/C][C](NA )[/C][C](NA )[/C][C](NA )[/C][C](NA )[/C][C](NA )[/C][/ROW]
[ROW][C]Estimates ( 9 )[/C][C]NA[/C][C]NA[/C][C]NA[/C][C]NA[/C][C]NA[/C][C]NA[/C][C]NA[/C][/ROW]
[ROW][C](p-val)[/C][C](NA )[/C][C](NA )[/C][C](NA )[/C][C](NA )[/C][C](NA )[/C][C](NA )[/C][C](NA )[/C][/ROW]
[ROW][C]Estimates ( 10 )[/C][C]NA[/C][C]NA[/C][C]NA[/C][C]NA[/C][C]NA[/C][C]NA[/C][C]NA[/C][/ROW]
[ROW][C](p-val)[/C][C](NA )[/C][C](NA )[/C][C](NA )[/C][C](NA )[/C][C](NA )[/C][C](NA )[/C][C](NA )[/C][/ROW]
[ROW][C]Estimates ( 11 )[/C][C]NA[/C][C]NA[/C][C]NA[/C][C]NA[/C][C]NA[/C][C]NA[/C][C]NA[/C][/ROW]
[ROW][C](p-val)[/C][C](NA )[/C][C](NA )[/C][C](NA )[/C][C](NA )[/C][C](NA )[/C][C](NA )[/C][C](NA )[/C][/ROW]
[ROW][C]Estimates ( 12 )[/C][C]NA[/C][C]NA[/C][C]NA[/C][C]NA[/C][C]NA[/C][C]NA[/C][C]NA[/C][/ROW]
[ROW][C](p-val)[/C][C](NA )[/C][C](NA )[/C][C](NA )[/C][C](NA )[/C][C](NA )[/C][C](NA )[/C][C](NA )[/C][/ROW]
[ROW][C]Estimates ( 13 )[/C][C]NA[/C][C]NA[/C][C]NA[/C][C]NA[/C][C]NA[/C][C]NA[/C][C]NA[/C][/ROW]
[ROW][C](p-val)[/C][C](NA )[/C][C](NA )[/C][C](NA )[/C][C](NA )[/C][C](NA )[/C][C](NA )[/C][C](NA )[/C][/ROW]
[/TABLE]
Source: https://freestatistics.org/blog/index.php?pk=31089&T=1

Globally Unique Identifier (entire table): ba.freestatistics.org/blog/index.php?pk=31089&T=1

As an alternative you can also use a QR Code:  

The GUIDs for individual cells are displayed in the table below:

ARIMA Parameter Estimation and Backward Selection
Iterationar1ar2ar3ma1sar1sar2sma1
Estimates ( 1 )0.5460.2653-0.3327-0.57630.2826-0.0147-0.9977
(p-val)(0.0803 )(0.1329 )(0.0317 )(0.0514 )(0.2797 )(0.9563 )(0.3082 )
Estimates ( 2 )0.54830.2623-0.3312-0.57720.28860-0.9956
(p-val)(0.0755 )(0.1162 )(0.0284 )(0.0498 )(0.2063 )(NA )(0.256 )
Estimates ( 3 )0.59290.1767-0.2791-0.5992-0.359300
(p-val)(0.0643 )(0.2934 )(0.0534 )(0.0493 )(0.0243 )(NA )(NA )
Estimates ( 4 )0.72190-0.1937-0.6493-0.378800
(p-val)(0.0126 )(NA )(0.1042 )(0.0153 )(0.0169 )(NA )(NA )
Estimates ( 5 )-0.8502000.7553-0.29300
(p-val)(5e-04 )(NA )(NA )(0.0049 )(0.0756 )(NA )(NA )
Estimates ( 6 )-0.8329000.7045000
(p-val)(0 )(NA )(NA )(0.0014 )(NA )(NA )(NA )
Estimates ( 7 )NANANANANANANA
(p-val)(NA )(NA )(NA )(NA )(NA )(NA )(NA )
Estimates ( 8 )NANANANANANANA
(p-val)(NA )(NA )(NA )(NA )(NA )(NA )(NA )
Estimates ( 9 )NANANANANANANA
(p-val)(NA )(NA )(NA )(NA )(NA )(NA )(NA )
Estimates ( 10 )NANANANANANANA
(p-val)(NA )(NA )(NA )(NA )(NA )(NA )(NA )
Estimates ( 11 )NANANANANANANA
(p-val)(NA )(NA )(NA )(NA )(NA )(NA )(NA )
Estimates ( 12 )NANANANANANANA
(p-val)(NA )(NA )(NA )(NA )(NA )(NA )(NA )
Estimates ( 13 )NANANANANANANA
(p-val)(NA )(NA )(NA )(NA )(NA )(NA )(NA )


Estimated ARIMA Residuals
Value
-458.497183359502
537.266624093812
422.301616548739
-1259.56410728020
-116.506889682738
-3774.08052595833
-3768.62402382522
-533.466932849095
3051.43884161499
1136.48630589978
105.083594798034
-1105.1138629111
-930.203961820507
-174.757784433776
805.951269825786
722.854769033289
24.5519494730150
-903.905438988202
-3689.70998679673
709.783457355558
-682.126289057224
2118.29261674204
2759.1301678592
117.827952930823
-4491.00451079687
-2773.63802671072
-374.12324446527
-4182.18454772479
-1706.09489102596
-2555.09893021987
6721.9970039894
-1487.71481751929
-2000.20927019477
1281.65713291222
-3978.96270705582
-2742.86524440287
-1873.43767848334
-768.066464303402
-5924.23593138750
4073.96017069357
2595.77092017779
5228.78068587902
2057.27480752094
454.456152408846
274.808254503760
1126.43141210547
-2755.37723607874
3463.00362057391
-1932.08335878282

\begin{tabular}{lllllllll}
\hline
Estimated ARIMA Residuals \tabularnewline
Value \tabularnewline
-458.497183359502 \tabularnewline
537.266624093812 \tabularnewline
422.301616548739 \tabularnewline
-1259.56410728020 \tabularnewline
-116.506889682738 \tabularnewline
-3774.08052595833 \tabularnewline
-3768.62402382522 \tabularnewline
-533.466932849095 \tabularnewline
3051.43884161499 \tabularnewline
1136.48630589978 \tabularnewline
105.083594798034 \tabularnewline
-1105.1138629111 \tabularnewline
-930.203961820507 \tabularnewline
-174.757784433776 \tabularnewline
805.951269825786 \tabularnewline
722.854769033289 \tabularnewline
24.5519494730150 \tabularnewline
-903.905438988202 \tabularnewline
-3689.70998679673 \tabularnewline
709.783457355558 \tabularnewline
-682.126289057224 \tabularnewline
2118.29261674204 \tabularnewline
2759.1301678592 \tabularnewline
117.827952930823 \tabularnewline
-4491.00451079687 \tabularnewline
-2773.63802671072 \tabularnewline
-374.12324446527 \tabularnewline
-4182.18454772479 \tabularnewline
-1706.09489102596 \tabularnewline
-2555.09893021987 \tabularnewline
6721.9970039894 \tabularnewline
-1487.71481751929 \tabularnewline
-2000.20927019477 \tabularnewline
1281.65713291222 \tabularnewline
-3978.96270705582 \tabularnewline
-2742.86524440287 \tabularnewline
-1873.43767848334 \tabularnewline
-768.066464303402 \tabularnewline
-5924.23593138750 \tabularnewline
4073.96017069357 \tabularnewline
2595.77092017779 \tabularnewline
5228.78068587902 \tabularnewline
2057.27480752094 \tabularnewline
454.456152408846 \tabularnewline
274.808254503760 \tabularnewline
1126.43141210547 \tabularnewline
-2755.37723607874 \tabularnewline
3463.00362057391 \tabularnewline
-1932.08335878282 \tabularnewline
\hline
\end{tabular}
%Source: https://freestatistics.org/blog/index.php?pk=31089&T=2

[TABLE]
[ROW][C]Estimated ARIMA Residuals[/C][/ROW]
[ROW][C]Value[/C][/ROW]
[ROW][C]-458.497183359502[/C][/ROW]
[ROW][C]537.266624093812[/C][/ROW]
[ROW][C]422.301616548739[/C][/ROW]
[ROW][C]-1259.56410728020[/C][/ROW]
[ROW][C]-116.506889682738[/C][/ROW]
[ROW][C]-3774.08052595833[/C][/ROW]
[ROW][C]-3768.62402382522[/C][/ROW]
[ROW][C]-533.466932849095[/C][/ROW]
[ROW][C]3051.43884161499[/C][/ROW]
[ROW][C]1136.48630589978[/C][/ROW]
[ROW][C]105.083594798034[/C][/ROW]
[ROW][C]-1105.1138629111[/C][/ROW]
[ROW][C]-930.203961820507[/C][/ROW]
[ROW][C]-174.757784433776[/C][/ROW]
[ROW][C]805.951269825786[/C][/ROW]
[ROW][C]722.854769033289[/C][/ROW]
[ROW][C]24.5519494730150[/C][/ROW]
[ROW][C]-903.905438988202[/C][/ROW]
[ROW][C]-3689.70998679673[/C][/ROW]
[ROW][C]709.783457355558[/C][/ROW]
[ROW][C]-682.126289057224[/C][/ROW]
[ROW][C]2118.29261674204[/C][/ROW]
[ROW][C]2759.1301678592[/C][/ROW]
[ROW][C]117.827952930823[/C][/ROW]
[ROW][C]-4491.00451079687[/C][/ROW]
[ROW][C]-2773.63802671072[/C][/ROW]
[ROW][C]-374.12324446527[/C][/ROW]
[ROW][C]-4182.18454772479[/C][/ROW]
[ROW][C]-1706.09489102596[/C][/ROW]
[ROW][C]-2555.09893021987[/C][/ROW]
[ROW][C]6721.9970039894[/C][/ROW]
[ROW][C]-1487.71481751929[/C][/ROW]
[ROW][C]-2000.20927019477[/C][/ROW]
[ROW][C]1281.65713291222[/C][/ROW]
[ROW][C]-3978.96270705582[/C][/ROW]
[ROW][C]-2742.86524440287[/C][/ROW]
[ROW][C]-1873.43767848334[/C][/ROW]
[ROW][C]-768.066464303402[/C][/ROW]
[ROW][C]-5924.23593138750[/C][/ROW]
[ROW][C]4073.96017069357[/C][/ROW]
[ROW][C]2595.77092017779[/C][/ROW]
[ROW][C]5228.78068587902[/C][/ROW]
[ROW][C]2057.27480752094[/C][/ROW]
[ROW][C]454.456152408846[/C][/ROW]
[ROW][C]274.808254503760[/C][/ROW]
[ROW][C]1126.43141210547[/C][/ROW]
[ROW][C]-2755.37723607874[/C][/ROW]
[ROW][C]3463.00362057391[/C][/ROW]
[ROW][C]-1932.08335878282[/C][/ROW]
[/TABLE]
Source: https://freestatistics.org/blog/index.php?pk=31089&T=2

Globally Unique Identifier (entire table): ba.freestatistics.org/blog/index.php?pk=31089&T=2

As an alternative you can also use a QR Code:  

The GUIDs for individual cells are displayed in the table below:

Estimated ARIMA Residuals
Value
-458.497183359502
537.266624093812
422.301616548739
-1259.56410728020
-116.506889682738
-3774.08052595833
-3768.62402382522
-533.466932849095
3051.43884161499
1136.48630589978
105.083594798034
-1105.1138629111
-930.203961820507
-174.757784433776
805.951269825786
722.854769033289
24.5519494730150
-903.905438988202
-3689.70998679673
709.783457355558
-682.126289057224
2118.29261674204
2759.1301678592
117.827952930823
-4491.00451079687
-2773.63802671072
-374.12324446527
-4182.18454772479
-1706.09489102596
-2555.09893021987
6721.9970039894
-1487.71481751929
-2000.20927019477
1281.65713291222
-3978.96270705582
-2742.86524440287
-1873.43767848334
-768.066464303402
-5924.23593138750
4073.96017069357
2595.77092017779
5228.78068587902
2057.27480752094
454.456152408846
274.808254503760
1126.43141210547
-2755.37723607874
3463.00362057391
-1932.08335878282


Parameters (Session):
par1 = FALSE ; par2 = 1 ; par3 = 1 ; par4 = 1 ; par5 = 12 ; par6 = 3 ; par7 = 1 ; par8 = 2 ; par9 = 1 ;
Parameters (R input):
par1 = FALSE ; par2 = 1 ; par3 = 1 ; par4 = 1 ; par5 = 12 ; par6 = 3 ; par7 = 1 ; par8 = 2 ; par9 = 1 ;
R code (references can be found in the software module):
library(lattice)
if (par1 == 'TRUE') par1 <- TRUE
if (par1 == 'FALSE') par1 <- FALSE
par2 <- as.numeric(par2) #Box-Cox lambda transformation parameter
par3 <- as.numeric(par3) #degree of non-seasonal differencing
par4 <- as.numeric(par4) #degree of seasonal differencing
par5 <- as.numeric(par5) #seasonal period
par6 <- as.numeric(par6) #degree (p) of the non-seasonal AR(p) polynomial
par7 <- as.numeric(par7) #degree (q) of the non-seasonal MA(q) polynomial
par8 <- as.numeric(par8) #degree (P) of the seasonal AR(P) polynomial
par9 <- as.numeric(par9) #degree (Q) of the seasonal MA(Q) polynomial
armaGR <- function(arima.out, names, n){
try1 <- arima.out$coef
try2 <- sqrt(diag(arima.out$var.coef))
try.data.frame <- data.frame(matrix(NA,ncol=4,nrow=length(names)))
dimnames(try.data.frame) <- list(names,c('coef','std','tstat','pv'))
try.data.frame[,1] <- try1
for(i in 1:length(try2)) try.data.frame[which(rownames(try.data.frame)==names(try2)[i]),2] <- try2[i]
try.data.frame[,3] <- try.data.frame[,1] / try.data.frame[,2]
try.data.frame[,4] <- round((1-pt(abs(try.data.frame[,3]),df=n-(length(try2)+1)))*2,5)
vector <- rep(NA,length(names))
vector[is.na(try.data.frame[,4])] <- 0
maxi <- which.max(try.data.frame[,4])
continue <- max(try.data.frame[,4],na.rm=TRUE) > .05
vector[maxi] <- 0
list(summary=try.data.frame,next.vector=vector,continue=continue)
}
arimaSelect <- function(series, order=c(13,0,0), seasonal=list(order=c(2,0,0),period=12), include.mean=F){
nrc <- order[1]+order[3]+seasonal$order[1]+seasonal$order[3]
coeff <- matrix(NA, nrow=nrc*2, ncol=nrc)
pval <- matrix(NA, nrow=nrc*2, ncol=nrc)
mylist <- rep(list(NULL), nrc)
names <- NULL
if(order[1] > 0) names <- paste('ar',1:order[1],sep='')
if(order[3] > 0) names <- c( names , paste('ma',1:order[3],sep='') )
if(seasonal$order[1] > 0) names <- c(names, paste('sar',1:seasonal$order[1],sep=''))
if(seasonal$order[3] > 0) names <- c(names, paste('sma',1:seasonal$order[3],sep=''))
arima.out <- arima(series, order=order, seasonal=seasonal, include.mean=include.mean, method='ML')
mylist[[1]] <- arima.out
last.arma <- armaGR(arima.out, names, length(series))
mystop <- FALSE
i <- 1
coeff[i,] <- last.arma[[1]][,1]
pval [i,] <- last.arma[[1]][,4]
i <- 2
aic <- arima.out$aic
while(!mystop){
mylist[[i]] <- arima.out
arima.out <- arima(series, order=order, seasonal=seasonal, include.mean=include.mean, method='ML', fixed=last.arma$next.vector)
aic <- c(aic, arima.out$aic)
last.arma <- armaGR(arima.out, names, length(series))
mystop <- !last.arma$continue
coeff[i,] <- last.arma[[1]][,1]
pval [i,] <- last.arma[[1]][,4]
i <- i+1
}
list(coeff, pval, mylist, aic=aic)
}
arimaSelectplot <- function(arimaSelect.out,noms,choix){
noms <- names(arimaSelect.out[[3]][[1]]$coef)
coeff <- arimaSelect.out[[1]]
k <- min(which(is.na(coeff[,1])))-1
coeff <- coeff[1:k,]
pval <- arimaSelect.out[[2]][1:k,]
aic <- arimaSelect.out$aic[1:k]
coeff[coeff==0] <- NA
n <- ncol(coeff)
if(missing(choix)) choix <- k
layout(matrix(c(1,1,1,2,
3,3,3,2,
3,3,3,4,
5,6,7,7),nr=4),
widths=c(10,35,45,15),
heights=c(30,30,15,15))
couleurs <- rainbow(75)[1:50]#(50)
ticks <- pretty(coeff)
par(mar=c(1,1,3,1))
plot(aic,k:1-.5,type='o',pch=21,bg='blue',cex=2,axes=F,lty=2,xpd=NA)
points(aic[choix],k-choix+.5,pch=21,cex=4,bg=2,xpd=NA)
title('aic',line=2)
par(mar=c(3,0,0,0))
plot(0,axes=F,xlab='',ylab='',xlim=range(ticks),ylim=c(.1,1))
rect(xleft = min(ticks) + (0:49)/50*(max(ticks)-min(ticks)),
xright = min(ticks) + (1:50)/50*(max(ticks)-min(ticks)),
ytop = rep(1,50),
ybottom= rep(0,50),col=couleurs,border=NA)
axis(1,ticks)
rect(xleft=min(ticks),xright=max(ticks),ytop=1,ybottom=0)
text(mean(coeff,na.rm=T),.5,'coefficients',cex=2,font=2)
par(mar=c(1,1,3,1))
image(1:n,1:k,t(coeff[k:1,]),axes=F,col=couleurs,zlim=range(ticks))
for(i in 1:n) for(j in 1:k) if(!is.na(coeff[j,i])) {
if(pval[j,i]<.01) symb = 'green'
else if( (pval[j,i]<.05) & (pval[j,i]>=.01)) symb = 'orange'
else if( (pval[j,i]<.1) & (pval[j,i]>=.05)) symb = 'red'
else symb = 'black'
polygon(c(i+.5 ,i+.2 ,i+.5 ,i+.5),
c(k-j+0.5,k-j+0.5,k-j+0.8,k-j+0.5),
col=symb)
if(j==choix) {
rect(xleft=i-.5,
xright=i+.5,
ybottom=k-j+1.5,
ytop=k-j+.5,
lwd=4)
text(i,
k-j+1,
round(coeff[j,i],2),
cex=1.2,
font=2)
}
else{
rect(xleft=i-.5,xright=i+.5,ybottom=k-j+1.5,ytop=k-j+.5)
text(i,k-j+1,round(coeff[j,i],2),cex=1.2,font=1)
}
}
axis(3,1:n,noms)
par(mar=c(0.5,0,0,0.5))
plot(0,axes=F,xlab='',ylab='',type='n',xlim=c(0,8),ylim=c(-.2,.8))
cols <- c('green','orange','red','black')
niv <- c('0','0.01','0.05','0.1')
for(i in 0:3){
polygon(c(1+2*i ,1+2*i ,1+2*i-.5 ,1+2*i),
c(.4 ,.7 , .4 , .4),
col=cols[i+1])
text(2*i,0.5,niv[i+1],cex=1.5)
}
text(8,.5,1,cex=1.5)
text(4,0,'p-value',cex=2)
box()
residus <- arimaSelect.out[[3]][[choix]]$res
par(mar=c(1,2,4,1))
acf(residus,main='')
title('acf',line=.5)
par(mar=c(1,2,4,1))
pacf(residus,main='')
title('pacf',line=.5)
par(mar=c(2,2,4,1))
qqnorm(residus,main='')
title('qq-norm',line=.5)
qqline(residus)
residus
}
if (par2 == 0) x <- log(x)
if (par2 != 0) x <- x^par2
(selection <- arimaSelect(x, order=c(par6,par3,par7), seasonal=list(order=c(par8,par4,par9), period=par5)))
bitmap(file='test1.png')
resid <- arimaSelectplot(selection)
dev.off()
resid
bitmap(file='test2.png')
acf(resid,length(resid)/2, main='Residual Autocorrelation Function')
dev.off()
bitmap(file='test3.png')
pacf(resid,length(resid)/2, main='Residual Partial Autocorrelation Function')
dev.off()
bitmap(file='test4.png')
cpgram(resid, main='Residual Cumulative Periodogram')
dev.off()
bitmap(file='test5.png')
hist(resid, main='Residual Histogram', xlab='values of Residuals')
dev.off()
bitmap(file='test6.png')
densityplot(~resid,col='black',main='Residual Density Plot', xlab='values of Residuals')
dev.off()
bitmap(file='test7.png')
qqnorm(resid, main='Residual Normal Q-Q Plot')
qqline(resid)
dev.off()
ncols <- length(selection[[1]][1,])
nrows <- length(selection[[2]][,1])-1
load(file='createtable')
a<-table.start()
a<-table.row.start(a)
a<-table.element(a,'ARIMA Parameter Estimation and Backward Selection', ncols+1,TRUE)
a<-table.row.end(a)
a<-table.row.start(a)
a<-table.element(a,'Iteration', header=TRUE)
for (i in 1:ncols) {
a<-table.element(a,names(selection[[3]][[1]]$coef)[i],header=TRUE)
}
a<-table.row.end(a)
for (j in 1:nrows) {
a<-table.row.start(a)
mydum <- 'Estimates ('
mydum <- paste(mydum,j)
mydum <- paste(mydum,')')
a<-table.element(a,mydum, header=TRUE)
for (i in 1:ncols) {
a<-table.element(a,round(selection[[1]][j,i],4))
}
a<-table.row.end(a)
a<-table.row.start(a)
a<-table.element(a,'(p-val)', header=TRUE)
for (i in 1:ncols) {
mydum <- '('
mydum <- paste(mydum,round(selection[[2]][j,i],4),sep='')
mydum <- paste(mydum,')')
a<-table.element(a,mydum)
}
a<-table.row.end(a)
}
a<-table.end(a)
table.save(a,file='mytable.tab')
a<-table.start()
a<-table.row.start(a)
a<-table.element(a,'Estimated ARIMA Residuals', 1,TRUE)
a<-table.row.end(a)
a<-table.row.start(a)
a<-table.element(a,'Value', 1,TRUE)
a<-table.row.end(a)
for (i in (par4*par5+par3):length(resid)) {
a<-table.row.start(a)
a<-table.element(a,resid[i])
a<-table.row.end(a)
}
a<-table.end(a)
table.save(a,file='mytable1.tab')