Free Statistics

of Irreproducible Research!

Author's title

Author*The author of this computation has been verified*
R Software Modulerwasp_smp.wasp
Title produced by softwareStandard Deviation-Mean Plot
Date of computationMon, 08 Dec 2008 14:43:44 -0700
Cite this page as followsStatistical Computations at FreeStatistics.org, Office for Research Development and Education, URL https://freestatistics.org/blog/index.php?v=date/2008/Dec/08/t1228772733jps8f0wi4zi8q7l.htm/, Retrieved Thu, 16 May 2024 12:57:49 +0000
Statistical Computations at FreeStatistics.org, Office for Research Development and Education, URL https://freestatistics.org/blog/index.php?pk=31084, Retrieved Thu, 16 May 2024 12:57:49 +0000
QR Codes:

Original text written by user:
IsPrivate?No (this computation is public)
User-defined keywords
Estimated Impact145
Family? (F = Feedback message, R = changed R code, M = changed R Module, P = changed Parameters, D = changed Data)
-     [Univariate Data Series] [data set] [2008-12-01 19:54:57] [b98453cac15ba1066b407e146608df68]
F RMPD    [Standard Deviation-Mean Plot] [Arma process: eig...] [2008-12-08 21:43:44] [d6e9f26c3644bfc30f06303d9993b878] [Current]
Feedback Forum
2008-12-12 19:32:14 [Bas van Keken] [reply
Lambda waarde is in principe juist gevonden en is af te ronden op 2 als waarde om in te kunnen voeren in de (partial) autocorrelation software. Maar deze waarde is niet goed te gebruiken want de P-value is 0.197451813170098. Dit is vrij hoog en dient onder de 0,05 te zitten. Hier kunt u het beste de Lambda waarde 1 nemen in de bovengenoemde module.
2008-12-13 13:36:28 [An De Koninck] [reply
De student komt in eerste instantie al een hoge lambdawaarde uit. Normaal dient deze onder de 5% te zitten. Als die zo is betekent dat beta significant verschillend is van nul en dat er dus iets moet gebeuren om de tijdsreeks stationair te maken.
Hier is de lambdawaarde dus groter dan 5%. Deze parameter moet dus ingesteld worden op 1.
2008-12-15 11:50:59 [Romina Machiels] [reply
De vraag is juist beantwoord.
Maar de lambda-waarde is te hoog, moet onder 5% zitten. Dus neem je best 1 als parameter.
2008-12-15 22:03:56 [df2ed12c9b09685cd516719b004050c5] [reply
We gebruiken de SMP om de variantie gelijk te maken en om de transformatie toe te passen.
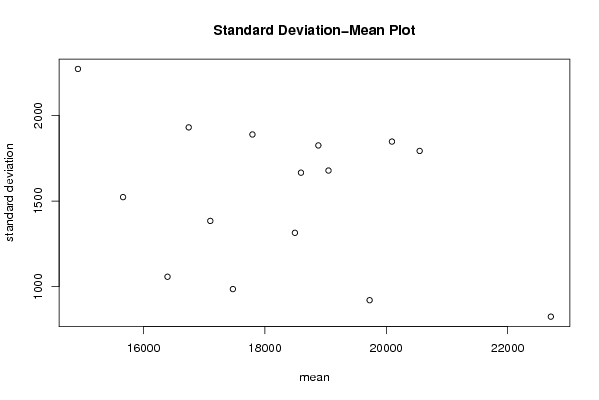
Standard deviation meanplot: bij een scatterplot weet je niet wanneer in de tijdreeks een outlier zich voordoet. Wat wel belangrijk is of deze outlier helemaal links of rechts ligt. Want deze kan dan de helling van de regressierechte beïnvloeden ( die door de punten van de scatterplot wordt getrokken ). Hier zien we 2 outliers, links bovenaan en rechts onderaan. Dit zorgt dus voor problemen.

2de tabel: de p-waarde heeft betrekking op de beta (helling van de regressielijn). De beta wordt hier dus getoetst. Hier is de beta niet significant verschillend van 0. (p-waarde 0.197451813170098 is groter dan 5% (bij 95% betrouwbaarheid) Er is dus geen verband tussen de SE en het gemiddelde. We moeten de lambda op 1 zetten.

3de tabel: Hier lezen we de lambda af ALS de beta uit de 2de tabel significant verschillend is van 0 en als in de scatterplot geen outliers zijn die de regressievergelijking beïnvloeden.
De 2 voorwaarden zijn niet voldaan, dus we mogen deze lambda niet gebruiken. Dus we zetten de lambda op 1.

Post a new message
Dataseries X:
11703,7
16283,6
16726,5
14968,9
14861,0
14583,3
15305,8
17903,9
16379,4
15420,3
17870,5
15912,8
13866,5
17823,2
17872,0
17420,4
16704,4
15991,2
16583,6
19123,5
17838,7
17209,4
18586,5
16258,1
15141,6
19202,1
17746,5
19090,1
18040,3
17515,5
17751,8
21072,4
17170,0
19439,5
19795,4
17574,9
16165,4
19464,6
19932,1
19961,2
17343,4
18924,2
18574,1
21350,6
18594,6
19823,1
20844,4
19640,2
17735,4
19813,6
22160,0
20664,3
17877,4
21211,2
21423,1
21688,7
23243,2
21490,2
22925,8
23184,8
18562,2


Summary of computational transaction
Raw Inputview raw input (R code)
Raw Outputview raw output of R engine
Computing time3 seconds
R Server'Herman Ole Andreas Wold' @ 193.190.124.10:1001

\begin{tabular}{lllllllll}
\hline
Summary of computational transaction \tabularnewline
Raw Input & view raw input (R code)  \tabularnewline
Raw Output & view raw output of R engine  \tabularnewline
Computing time & 3 seconds \tabularnewline
R Server & 'Herman Ole Andreas Wold' @ 193.190.124.10:1001 \tabularnewline
\hline
\end{tabular}
%Source: https://freestatistics.org/blog/index.php?pk=31084&T=0

[TABLE]
[ROW][C]Summary of computational transaction[/C][/ROW]
[ROW][C]Raw Input[/C][C]view raw input (R code) [/C][/ROW]
[ROW][C]Raw Output[/C][C]view raw output of R engine [/C][/ROW]
[ROW][C]Computing time[/C][C]3 seconds[/C][/ROW]
[ROW][C]R Server[/C][C]'Herman Ole Andreas Wold' @ 193.190.124.10:1001[/C][/ROW]
[/TABLE]
Source: https://freestatistics.org/blog/index.php?pk=31084&T=0

Globally Unique Identifier (entire table): ba.freestatistics.org/blog/index.php?pk=31084&T=0

As an alternative you can also use a QR Code:  

The GUIDs for individual cells are displayed in the table below:

Summary of computational transaction
Raw Inputview raw input (R code)
Raw Outputview raw output of R engine
Computing time3 seconds
R Server'Herman Ole Andreas Wold' @ 193.190.124.10:1001


Standard Deviation-Mean Plot
SectionMeanStandard DeviationRange
114920.6752270.816467521475022.8
215663.51522.955431608773320.6
316395.751058.284506485222450.2
416745.5251929.988820995264005.5
517100.6751384.094913351923132.3
617473.175986.4220846912682328.4
717795.0751888.570730076054060.5
8185951665.483847615063556.9
918494.951314.702679949602625.4
1018880.8251824.528747147243795.8
1119048.0751678.048027471204007.2
1219725.575921.5338386805642249.80000000000
1320093.3251847.089096163654424.6
1420550.11792.476634901183811.3
1522711825.472583837081753

\begin{tabular}{lllllllll}
\hline
Standard Deviation-Mean Plot \tabularnewline
Section & Mean & Standard Deviation & Range \tabularnewline
1 & 14920.675 & 2270.81646752147 & 5022.8 \tabularnewline
2 & 15663.5 & 1522.95543160877 & 3320.6 \tabularnewline
3 & 16395.75 & 1058.28450648522 & 2450.2 \tabularnewline
4 & 16745.525 & 1929.98882099526 & 4005.5 \tabularnewline
5 & 17100.675 & 1384.09491335192 & 3132.3 \tabularnewline
6 & 17473.175 & 986.422084691268 & 2328.4 \tabularnewline
7 & 17795.075 & 1888.57073007605 & 4060.5 \tabularnewline
8 & 18595 & 1665.48384761506 & 3556.9 \tabularnewline
9 & 18494.95 & 1314.70267994960 & 2625.4 \tabularnewline
10 & 18880.825 & 1824.52874714724 & 3795.8 \tabularnewline
11 & 19048.075 & 1678.04802747120 & 4007.2 \tabularnewline
12 & 19725.575 & 921.533838680564 & 2249.80000000000 \tabularnewline
13 & 20093.325 & 1847.08909616365 & 4424.6 \tabularnewline
14 & 20550.1 & 1792.47663490118 & 3811.3 \tabularnewline
15 & 22711 & 825.47258383708 & 1753 \tabularnewline
\hline
\end{tabular}
%Source: https://freestatistics.org/blog/index.php?pk=31084&T=1

[TABLE]
[ROW][C]Standard Deviation-Mean Plot[/C][/ROW]
[ROW][C]Section[/C][C]Mean[/C][C]Standard Deviation[/C][C]Range[/C][/ROW]
[ROW][C]1[/C][C]14920.675[/C][C]2270.81646752147[/C][C]5022.8[/C][/ROW]
[ROW][C]2[/C][C]15663.5[/C][C]1522.95543160877[/C][C]3320.6[/C][/ROW]
[ROW][C]3[/C][C]16395.75[/C][C]1058.28450648522[/C][C]2450.2[/C][/ROW]
[ROW][C]4[/C][C]16745.525[/C][C]1929.98882099526[/C][C]4005.5[/C][/ROW]
[ROW][C]5[/C][C]17100.675[/C][C]1384.09491335192[/C][C]3132.3[/C][/ROW]
[ROW][C]6[/C][C]17473.175[/C][C]986.422084691268[/C][C]2328.4[/C][/ROW]
[ROW][C]7[/C][C]17795.075[/C][C]1888.57073007605[/C][C]4060.5[/C][/ROW]
[ROW][C]8[/C][C]18595[/C][C]1665.48384761506[/C][C]3556.9[/C][/ROW]
[ROW][C]9[/C][C]18494.95[/C][C]1314.70267994960[/C][C]2625.4[/C][/ROW]
[ROW][C]10[/C][C]18880.825[/C][C]1824.52874714724[/C][C]3795.8[/C][/ROW]
[ROW][C]11[/C][C]19048.075[/C][C]1678.04802747120[/C][C]4007.2[/C][/ROW]
[ROW][C]12[/C][C]19725.575[/C][C]921.533838680564[/C][C]2249.80000000000[/C][/ROW]
[ROW][C]13[/C][C]20093.325[/C][C]1847.08909616365[/C][C]4424.6[/C][/ROW]
[ROW][C]14[/C][C]20550.1[/C][C]1792.47663490118[/C][C]3811.3[/C][/ROW]
[ROW][C]15[/C][C]22711[/C][C]825.47258383708[/C][C]1753[/C][/ROW]
[/TABLE]
Source: https://freestatistics.org/blog/index.php?pk=31084&T=1

Globally Unique Identifier (entire table): ba.freestatistics.org/blog/index.php?pk=31084&T=1

As an alternative you can also use a QR Code:  

The GUIDs for individual cells are displayed in the table below:

Standard Deviation-Mean Plot
SectionMeanStandard DeviationRange
114920.6752270.816467521475022.8
215663.51522.955431608773320.6
316395.751058.284506485222450.2
416745.5251929.988820995264005.5
517100.6751384.094913351923132.3
617473.175986.4220846912682328.4
717795.0751888.570730076054060.5
8185951665.483847615063556.9
918494.951314.702679949602625.4
1018880.8251824.528747147243795.8
1119048.0751678.048027471204007.2
1219725.575921.5338386805642249.80000000000
1320093.3251847.089096163654424.6
1420550.11792.476634901183811.3
1522711825.472583837081753


Regression: S.E.(k) = alpha + beta * Mean(k)
alpha2893.17800640192
beta-0.0747181178000781
S.D.0.055005639597577
T-STAT-1.35837194779877
p-value0.197451813170098

\begin{tabular}{lllllllll}
\hline
Regression: S.E.(k) = alpha + beta * Mean(k) \tabularnewline
alpha & 2893.17800640192 \tabularnewline
beta & -0.0747181178000781 \tabularnewline
S.D. & 0.055005639597577 \tabularnewline
T-STAT & -1.35837194779877 \tabularnewline
p-value & 0.197451813170098 \tabularnewline
\hline
\end{tabular}
%Source: https://freestatistics.org/blog/index.php?pk=31084&T=2

[TABLE]
[ROW][C]Regression: S.E.(k) = alpha + beta * Mean(k)[/C][/ROW]
[ROW][C]alpha[/C][C]2893.17800640192[/C][/ROW]
[ROW][C]beta[/C][C]-0.0747181178000781[/C][/ROW]
[ROW][C]S.D.[/C][C]0.055005639597577[/C][/ROW]
[ROW][C]T-STAT[/C][C]-1.35837194779877[/C][/ROW]
[ROW][C]p-value[/C][C]0.197451813170098[/C][/ROW]
[/TABLE]
Source: https://freestatistics.org/blog/index.php?pk=31084&T=2

Globally Unique Identifier (entire table): ba.freestatistics.org/blog/index.php?pk=31084&T=2

As an alternative you can also use a QR Code:  

The GUIDs for individual cells are displayed in the table below:

Regression: S.E.(k) = alpha + beta * Mean(k)
alpha2893.17800640192
beta-0.0747181178000781
S.D.0.055005639597577
T-STAT-1.35837194779877
p-value0.197451813170098


Regression: ln S.E.(k) = alpha + beta * ln Mean(k)
alpha17.0717399589404
beta-0.997372535290324
S.D.0.725474501147471
T-STAT-1.37478647934944
p-value0.192431168732869
Lambda1.99737253529032

\begin{tabular}{lllllllll}
\hline
Regression: ln S.E.(k) = alpha + beta * ln Mean(k) \tabularnewline
alpha & 17.0717399589404 \tabularnewline
beta & -0.997372535290324 \tabularnewline
S.D. & 0.725474501147471 \tabularnewline
T-STAT & -1.37478647934944 \tabularnewline
p-value & 0.192431168732869 \tabularnewline
Lambda & 1.99737253529032 \tabularnewline
\hline
\end{tabular}
%Source: https://freestatistics.org/blog/index.php?pk=31084&T=3

[TABLE]
[ROW][C]Regression: ln S.E.(k) = alpha + beta * ln Mean(k)[/C][/ROW]
[ROW][C]alpha[/C][C]17.0717399589404[/C][/ROW]
[ROW][C]beta[/C][C]-0.997372535290324[/C][/ROW]
[ROW][C]S.D.[/C][C]0.725474501147471[/C][/ROW]
[ROW][C]T-STAT[/C][C]-1.37478647934944[/C][/ROW]
[ROW][C]p-value[/C][C]0.192431168732869[/C][/ROW]
[ROW][C]Lambda[/C][C]1.99737253529032[/C][/ROW]
[/TABLE]
Source: https://freestatistics.org/blog/index.php?pk=31084&T=3

Globally Unique Identifier (entire table): ba.freestatistics.org/blog/index.php?pk=31084&T=3

As an alternative you can also use a QR Code:  

The GUIDs for individual cells are displayed in the table below:

Regression: ln S.E.(k) = alpha + beta * ln Mean(k)
alpha17.0717399589404
beta-0.997372535290324
S.D.0.725474501147471
T-STAT-1.37478647934944
p-value0.192431168732869
Lambda1.99737253529032


Parameters (Session):
par1 = 4 ;
Parameters (R input):
par1 = 4 ;
R code (references can be found in the software module):
par1 <- as.numeric(par1)
(n <- length(x))
(np <- floor(n / par1))
arr <- array(NA,dim=c(par1,np))
j <- 0
k <- 1
for (i in 1:(np*par1))
{
j = j + 1
arr[j,k] <- x[i]
if (j == par1) {
j = 0
k=k+1
}
}
arr
arr.mean <- array(NA,dim=np)
arr.sd <- array(NA,dim=np)
arr.range <- array(NA,dim=np)
for (j in 1:np)
{
arr.mean[j] <- mean(arr[,j],na.rm=TRUE)
arr.sd[j] <- sd(arr[,j],na.rm=TRUE)
arr.range[j] <- max(arr[,j],na.rm=TRUE) - min(arr[,j],na.rm=TRUE)
}
arr.mean
arr.sd
arr.range
(lm1 <- lm(arr.sd~arr.mean))
(lnlm1 <- lm(log(arr.sd)~log(arr.mean)))
(lm2 <- lm(arr.range~arr.mean))
bitmap(file='test1.png')
plot(arr.mean,arr.sd,main='Standard Deviation-Mean Plot',xlab='mean',ylab='standard deviation')
dev.off()
bitmap(file='test2.png')
plot(arr.mean,arr.range,main='Range-Mean Plot',xlab='mean',ylab='range')
dev.off()
load(file='createtable')
a<-table.start()
a<-table.row.start(a)
a<-table.element(a,'Standard Deviation-Mean Plot',4,TRUE)
a<-table.row.end(a)
a<-table.row.start(a)
a<-table.element(a,'Section',header=TRUE)
a<-table.element(a,'Mean',header=TRUE)
a<-table.element(a,'Standard Deviation',header=TRUE)
a<-table.element(a,'Range',header=TRUE)
a<-table.row.end(a)
for (j in 1:np) {
a<-table.row.start(a)
a<-table.element(a,j,header=TRUE)
a<-table.element(a,arr.mean[j])
a<-table.element(a,arr.sd[j] )
a<-table.element(a,arr.range[j] )
a<-table.row.end(a)
}
a<-table.end(a)
table.save(a,file='mytable.tab')
a<-table.start()
a<-table.row.start(a)
a<-table.element(a,'Regression: S.E.(k) = alpha + beta * Mean(k)',2,TRUE)
a<-table.row.end(a)
a<-table.row.start(a)
a<-table.element(a,'alpha',header=TRUE)
a<-table.element(a,lm1$coefficients[[1]])
a<-table.row.end(a)
a<-table.row.start(a)
a<-table.element(a,'beta',header=TRUE)
a<-table.element(a,lm1$coefficients[[2]])
a<-table.row.end(a)
a<-table.row.start(a)
a<-table.element(a,'S.D.',header=TRUE)
a<-table.element(a,summary(lm1)$coefficients[2,2])
a<-table.row.end(a)
a<-table.row.start(a)
a<-table.element(a,'T-STAT',header=TRUE)
a<-table.element(a,summary(lm1)$coefficients[2,3])
a<-table.row.end(a)
a<-table.row.start(a)
a<-table.element(a,'p-value',header=TRUE)
a<-table.element(a,summary(lm1)$coefficients[2,4])
a<-table.row.end(a)
a<-table.end(a)
table.save(a,file='mytable1.tab')
a<-table.start()
a<-table.row.start(a)
a<-table.element(a,'Regression: ln S.E.(k) = alpha + beta * ln Mean(k)',2,TRUE)
a<-table.row.end(a)
a<-table.row.start(a)
a<-table.element(a,'alpha',header=TRUE)
a<-table.element(a,lnlm1$coefficients[[1]])
a<-table.row.end(a)
a<-table.row.start(a)
a<-table.element(a,'beta',header=TRUE)
a<-table.element(a,lnlm1$coefficients[[2]])
a<-table.row.end(a)
a<-table.row.start(a)
a<-table.element(a,'S.D.',header=TRUE)
a<-table.element(a,summary(lnlm1)$coefficients[2,2])
a<-table.row.end(a)
a<-table.row.start(a)
a<-table.element(a,'T-STAT',header=TRUE)
a<-table.element(a,summary(lnlm1)$coefficients[2,3])
a<-table.row.end(a)
a<-table.row.start(a)
a<-table.element(a,'p-value',header=TRUE)
a<-table.element(a,summary(lnlm1)$coefficients[2,4])
a<-table.row.end(a)
a<-table.row.start(a)
a<-table.element(a,'Lambda',header=TRUE)
a<-table.element(a,1-lnlm1$coefficients[[2]])
a<-table.row.end(a)
a<-table.end(a)
table.save(a,file='mytable2.tab')