Free Statistics

of Irreproducible Research!

Author's title

Author*The author of this computation has been verified*
R Software Modulerwasp_arimabackwardselection.wasp
Title produced by softwareARIMA Backward Selection
Date of computationMon, 08 Dec 2008 14:38:33 -0700
Cite this page as followsStatistical Computations at FreeStatistics.org, Office for Research Development and Education, URL https://freestatistics.org/blog/index.php?v=date/2008/Dec/08/t1228772343sx4j3ui29o4lpoa.htm/, Retrieved Thu, 16 May 2024 23:42:11 +0000
Statistical Computations at FreeStatistics.org, Office for Research Development and Education, URL https://freestatistics.org/blog/index.php?pk=31077, Retrieved Thu, 16 May 2024 23:42:11 +0000
QR Codes:

Original text written by user:
IsPrivate?No (this computation is public)
User-defined keywords
Estimated Impact199
Family? (F = Feedback message, R = changed R code, M = changed R Module, P = changed Parameters, D = changed Data)
-     [Spectral Analysis] [Unemployment - St...] [2008-12-08 17:28:52] [57850c80fd59ccfb28f882be994e814e]
F RMP   [ARIMA Backward Selection] [Unemployment - St...] [2008-12-08 18:25:12] [57850c80fd59ccfb28f882be994e814e]
F   PD      [ARIMA Backward Selection] [] [2008-12-08 21:38:33] [6d40a467de0f28bd2350f82ac9522c51] [Current]
Feedback Forum
2008-12-14 08:54:14 [Kristof Van Esbroeck] [reply
We gebruiken de Backward selection software.

http://www.freestatistics.org/blog/index.php?v=date/2008/Dec/14/t12292424787wvowtmxxmiuihm.htm

We onderzoeken twee assumpties, nl de vaste locatie en de vaste variantie.

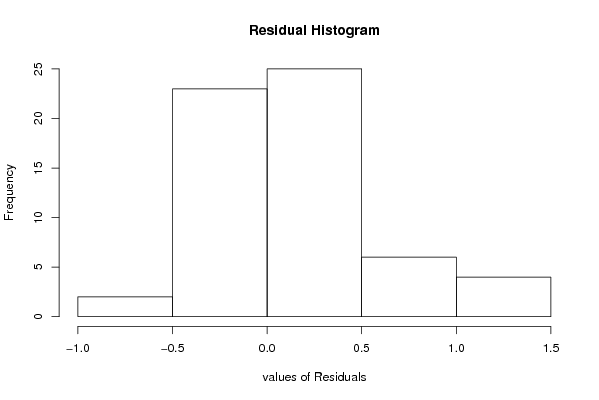
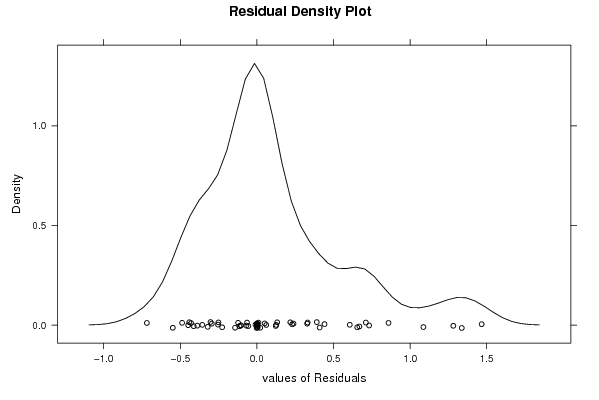
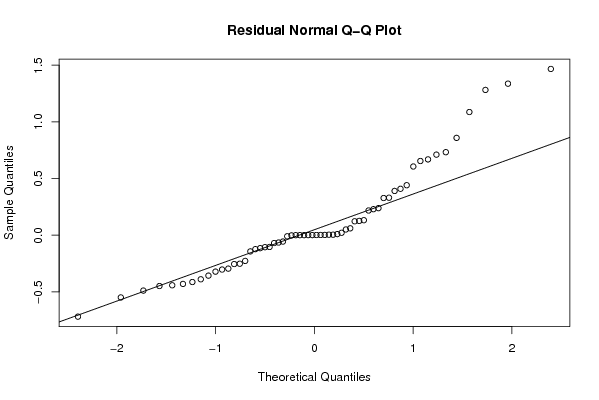
Wanneer we de grafische voorstelling van het Residual Histogram, Residual Density Plot en Residual Normal Q - Q plot bekijken stellen we vast dat deze de normaalverdeling benaderen.

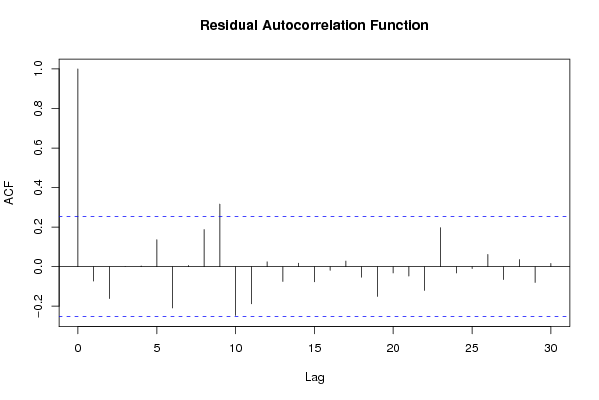
Vervolgens dienen we de Randomness te bekijken. We stellen vast na interpretatie van de Residual Autocorrelatiefunctie dat alle lags binnen het betrouwbaarheidsinterval liggen. De datareeks is dus random.

Er kan nu een betrouwbare voorspelling van deze gegevens gemaakt worden.

2008-12-15 09:06:27 [Nathalie Koulouris] [reply
De student had hier de ARIMA selection backward methode moeten gebruiken.

Post a new message
Dataseries X:
299,63
305,945
382,252
348,846
335,367
373,617
312,612
312,232
337,161
331,476
350,103
345,127
297,256
295,979
361,007
321,803
354,937
349,432
290,979
349,576
327,625
349,377
336,777
339,134
323,321
318,86
373,583
333,03
408,556
414,646
291,514
348,857
349,368
375,765
364,136
349,53
348,167
332,856
360,551
346,969
392,815
372,02
371,027
342,672
367,343
390,786
343,785
362,6
349,468
340,624
369,536
407,782
392,239
404,824
373,669
344,902
396,7
398,911
366,009
392,484


Summary of computational transaction
Raw Inputview raw input (R code)
Raw Outputview raw output of R engine
Computing time8 seconds
R Server'Gwilym Jenkins' @ 72.249.127.135

\begin{tabular}{lllllllll}
\hline
Summary of computational transaction \tabularnewline
Raw Input & view raw input (R code)  \tabularnewline
Raw Output & view raw output of R engine  \tabularnewline
Computing time & 8 seconds \tabularnewline
R Server & 'Gwilym Jenkins' @ 72.249.127.135 \tabularnewline
\hline
\end{tabular}
%Source: https://freestatistics.org/blog/index.php?pk=31077&T=0

[TABLE]
[ROW][C]Summary of computational transaction[/C][/ROW]
[ROW][C]Raw Input[/C][C]view raw input (R code) [/C][/ROW]
[ROW][C]Raw Output[/C][C]view raw output of R engine [/C][/ROW]
[ROW][C]Computing time[/C][C]8 seconds[/C][/ROW]
[ROW][C]R Server[/C][C]'Gwilym Jenkins' @ 72.249.127.135[/C][/ROW]
[/TABLE]
Source: https://freestatistics.org/blog/index.php?pk=31077&T=0

Globally Unique Identifier (entire table): ba.freestatistics.org/blog/index.php?pk=31077&T=0

As an alternative you can also use a QR Code:  

The GUIDs for individual cells are displayed in the table below:

Summary of computational transaction
Raw Inputview raw input (R code)
Raw Outputview raw output of R engine
Computing time8 seconds
R Server'Gwilym Jenkins' @ 72.249.127.135


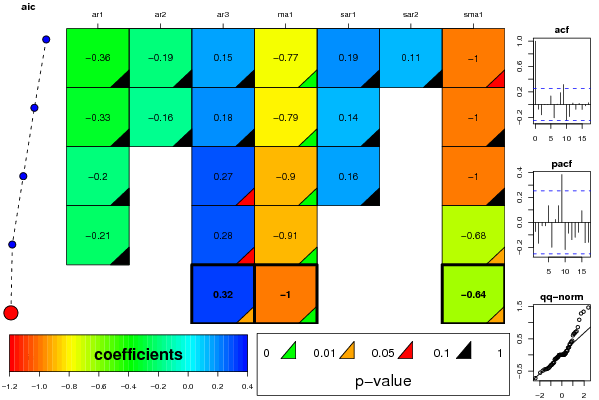
ARIMA Parameter Estimation and Backward Selection
Iterationar1ar2ar3ma1sar1sar2sma1
Estimates ( 1 )-0.3634-0.19060.1533-0.77410.19420.1148-0.9998
(p-val)(0.199 )(0.4979 )(0.4977 )(6e-04 )(0.4609 )(0.6811 )(0.0856 )
Estimates ( 2 )-0.3276-0.1590.1764-0.78740.14030-1.0001
(p-val)(0.2368 )(0.5641 )(0.4304 )(7e-04 )(0.5354 )(NA )(0.3411 )
Estimates ( 3 )-0.195400.2739-0.90190.16120-1.0002
(p-val)(0.2414 )(NA )(0.0861 )(0 )(0.4706 )(NA )(0.195 )
Estimates ( 4 )-0.212900.279-0.90700-0.6787
(p-val)(0.1845 )(NA )(0.0762 )(0 )(NA )(NA )(0.034 )
Estimates ( 5 )000.3153-100-0.6386
(p-val)(NA )(NA )(0.04 )(0 )(NA )(NA )(0.0278 )
Estimates ( 6 )NANANANANANANA
(p-val)(NA )(NA )(NA )(NA )(NA )(NA )(NA )
Estimates ( 7 )NANANANANANANA
(p-val)(NA )(NA )(NA )(NA )(NA )(NA )(NA )
Estimates ( 8 )NANANANANANANA
(p-val)(NA )(NA )(NA )(NA )(NA )(NA )(NA )
Estimates ( 9 )NANANANANANANA
(p-val)(NA )(NA )(NA )(NA )(NA )(NA )(NA )
Estimates ( 10 )NANANANANANANA
(p-val)(NA )(NA )(NA )(NA )(NA )(NA )(NA )
Estimates ( 11 )NANANANANANANA
(p-val)(NA )(NA )(NA )(NA )(NA )(NA )(NA )
Estimates ( 12 )NANANANANANANA
(p-val)(NA )(NA )(NA )(NA )(NA )(NA )(NA )
Estimates ( 13 )NANANANANANANA
(p-val)(NA )(NA )(NA )(NA )(NA )(NA )(NA )

\begin{tabular}{lllllllll}
\hline
ARIMA Parameter Estimation and Backward Selection \tabularnewline
Iteration & ar1 & ar2 & ar3 & ma1 & sar1 & sar2 & sma1 \tabularnewline
Estimates ( 1 ) & -0.3634 & -0.1906 & 0.1533 & -0.7741 & 0.1942 & 0.1148 & -0.9998 \tabularnewline
(p-val) & (0.199 ) & (0.4979 ) & (0.4977 ) & (6e-04 ) & (0.4609 ) & (0.6811 ) & (0.0856 ) \tabularnewline
Estimates ( 2 ) & -0.3276 & -0.159 & 0.1764 & -0.7874 & 0.1403 & 0 & -1.0001 \tabularnewline
(p-val) & (0.2368 ) & (0.5641 ) & (0.4304 ) & (7e-04 ) & (0.5354 ) & (NA ) & (0.3411 ) \tabularnewline
Estimates ( 3 ) & -0.1954 & 0 & 0.2739 & -0.9019 & 0.1612 & 0 & -1.0002 \tabularnewline
(p-val) & (0.2414 ) & (NA ) & (0.0861 ) & (0 ) & (0.4706 ) & (NA ) & (0.195 ) \tabularnewline
Estimates ( 4 ) & -0.2129 & 0 & 0.279 & -0.907 & 0 & 0 & -0.6787 \tabularnewline
(p-val) & (0.1845 ) & (NA ) & (0.0762 ) & (0 ) & (NA ) & (NA ) & (0.034 ) \tabularnewline
Estimates ( 5 ) & 0 & 0 & 0.3153 & -1 & 0 & 0 & -0.6386 \tabularnewline
(p-val) & (NA ) & (NA ) & (0.04 ) & (0 ) & (NA ) & (NA ) & (0.0278 ) \tabularnewline
Estimates ( 6 ) & NA & NA & NA & NA & NA & NA & NA \tabularnewline
(p-val) & (NA ) & (NA ) & (NA ) & (NA ) & (NA ) & (NA ) & (NA ) \tabularnewline
Estimates ( 7 ) & NA & NA & NA & NA & NA & NA & NA \tabularnewline
(p-val) & (NA ) & (NA ) & (NA ) & (NA ) & (NA ) & (NA ) & (NA ) \tabularnewline
Estimates ( 8 ) & NA & NA & NA & NA & NA & NA & NA \tabularnewline
(p-val) & (NA ) & (NA ) & (NA ) & (NA ) & (NA ) & (NA ) & (NA ) \tabularnewline
Estimates ( 9 ) & NA & NA & NA & NA & NA & NA & NA \tabularnewline
(p-val) & (NA ) & (NA ) & (NA ) & (NA ) & (NA ) & (NA ) & (NA ) \tabularnewline
Estimates ( 10 ) & NA & NA & NA & NA & NA & NA & NA \tabularnewline
(p-val) & (NA ) & (NA ) & (NA ) & (NA ) & (NA ) & (NA ) & (NA ) \tabularnewline
Estimates ( 11 ) & NA & NA & NA & NA & NA & NA & NA \tabularnewline
(p-val) & (NA ) & (NA ) & (NA ) & (NA ) & (NA ) & (NA ) & (NA ) \tabularnewline
Estimates ( 12 ) & NA & NA & NA & NA & NA & NA & NA \tabularnewline
(p-val) & (NA ) & (NA ) & (NA ) & (NA ) & (NA ) & (NA ) & (NA ) \tabularnewline
Estimates ( 13 ) & NA & NA & NA & NA & NA & NA & NA \tabularnewline
(p-val) & (NA ) & (NA ) & (NA ) & (NA ) & (NA ) & (NA ) & (NA ) \tabularnewline
\hline
\end{tabular}
%Source: https://freestatistics.org/blog/index.php?pk=31077&T=1

[TABLE]
[ROW][C]ARIMA Parameter Estimation and Backward Selection[/C][/ROW]
[ROW][C]Iteration[/C][C]ar1[/C][C]ar2[/C][C]ar3[/C][C]ma1[/C][C]sar1[/C][C]sar2[/C][C]sma1[/C][/ROW]
[ROW][C]Estimates ( 1 )[/C][C]-0.3634[/C][C]-0.1906[/C][C]0.1533[/C][C]-0.7741[/C][C]0.1942[/C][C]0.1148[/C][C]-0.9998[/C][/ROW]
[ROW][C](p-val)[/C][C](0.199 )[/C][C](0.4979 )[/C][C](0.4977 )[/C][C](6e-04 )[/C][C](0.4609 )[/C][C](0.6811 )[/C][C](0.0856 )[/C][/ROW]
[ROW][C]Estimates ( 2 )[/C][C]-0.3276[/C][C]-0.159[/C][C]0.1764[/C][C]-0.7874[/C][C]0.1403[/C][C]0[/C][C]-1.0001[/C][/ROW]
[ROW][C](p-val)[/C][C](0.2368 )[/C][C](0.5641 )[/C][C](0.4304 )[/C][C](7e-04 )[/C][C](0.5354 )[/C][C](NA )[/C][C](0.3411 )[/C][/ROW]
[ROW][C]Estimates ( 3 )[/C][C]-0.1954[/C][C]0[/C][C]0.2739[/C][C]-0.9019[/C][C]0.1612[/C][C]0[/C][C]-1.0002[/C][/ROW]
[ROW][C](p-val)[/C][C](0.2414 )[/C][C](NA )[/C][C](0.0861 )[/C][C](0 )[/C][C](0.4706 )[/C][C](NA )[/C][C](0.195 )[/C][/ROW]
[ROW][C]Estimates ( 4 )[/C][C]-0.2129[/C][C]0[/C][C]0.279[/C][C]-0.907[/C][C]0[/C][C]0[/C][C]-0.6787[/C][/ROW]
[ROW][C](p-val)[/C][C](0.1845 )[/C][C](NA )[/C][C](0.0762 )[/C][C](0 )[/C][C](NA )[/C][C](NA )[/C][C](0.034 )[/C][/ROW]
[ROW][C]Estimates ( 5 )[/C][C]0[/C][C]0[/C][C]0.3153[/C][C]-1[/C][C]0[/C][C]0[/C][C]-0.6386[/C][/ROW]
[ROW][C](p-val)[/C][C](NA )[/C][C](NA )[/C][C](0.04 )[/C][C](0 )[/C][C](NA )[/C][C](NA )[/C][C](0.0278 )[/C][/ROW]
[ROW][C]Estimates ( 6 )[/C][C]NA[/C][C]NA[/C][C]NA[/C][C]NA[/C][C]NA[/C][C]NA[/C][C]NA[/C][/ROW]
[ROW][C](p-val)[/C][C](NA )[/C][C](NA )[/C][C](NA )[/C][C](NA )[/C][C](NA )[/C][C](NA )[/C][C](NA )[/C][/ROW]
[ROW][C]Estimates ( 7 )[/C][C]NA[/C][C]NA[/C][C]NA[/C][C]NA[/C][C]NA[/C][C]NA[/C][C]NA[/C][/ROW]
[ROW][C](p-val)[/C][C](NA )[/C][C](NA )[/C][C](NA )[/C][C](NA )[/C][C](NA )[/C][C](NA )[/C][C](NA )[/C][/ROW]
[ROW][C]Estimates ( 8 )[/C][C]NA[/C][C]NA[/C][C]NA[/C][C]NA[/C][C]NA[/C][C]NA[/C][C]NA[/C][/ROW]
[ROW][C](p-val)[/C][C](NA )[/C][C](NA )[/C][C](NA )[/C][C](NA )[/C][C](NA )[/C][C](NA )[/C][C](NA )[/C][/ROW]
[ROW][C]Estimates ( 9 )[/C][C]NA[/C][C]NA[/C][C]NA[/C][C]NA[/C][C]NA[/C][C]NA[/C][C]NA[/C][/ROW]
[ROW][C](p-val)[/C][C](NA )[/C][C](NA )[/C][C](NA )[/C][C](NA )[/C][C](NA )[/C][C](NA )[/C][C](NA )[/C][/ROW]
[ROW][C]Estimates ( 10 )[/C][C]NA[/C][C]NA[/C][C]NA[/C][C]NA[/C][C]NA[/C][C]NA[/C][C]NA[/C][/ROW]
[ROW][C](p-val)[/C][C](NA )[/C][C](NA )[/C][C](NA )[/C][C](NA )[/C][C](NA )[/C][C](NA )[/C][C](NA )[/C][/ROW]
[ROW][C]Estimates ( 11 )[/C][C]NA[/C][C]NA[/C][C]NA[/C][C]NA[/C][C]NA[/C][C]NA[/C][C]NA[/C][/ROW]
[ROW][C](p-val)[/C][C](NA )[/C][C](NA )[/C][C](NA )[/C][C](NA )[/C][C](NA )[/C][C](NA )[/C][C](NA )[/C][/ROW]
[ROW][C]Estimates ( 12 )[/C][C]NA[/C][C]NA[/C][C]NA[/C][C]NA[/C][C]NA[/C][C]NA[/C][C]NA[/C][/ROW]
[ROW][C](p-val)[/C][C](NA )[/C][C](NA )[/C][C](NA )[/C][C](NA )[/C][C](NA )[/C][C](NA )[/C][C](NA )[/C][/ROW]
[ROW][C]Estimates ( 13 )[/C][C]NA[/C][C]NA[/C][C]NA[/C][C]NA[/C][C]NA[/C][C]NA[/C][C]NA[/C][/ROW]
[ROW][C](p-val)[/C][C](NA )[/C][C](NA )[/C][C](NA )[/C][C](NA )[/C][C](NA )[/C][C](NA )[/C][C](NA )[/C][/ROW]
[/TABLE]
Source: https://freestatistics.org/blog/index.php?pk=31077&T=1

Globally Unique Identifier (entire table): ba.freestatistics.org/blog/index.php?pk=31077&T=1

As an alternative you can also use a QR Code:  

The GUIDs for individual cells are displayed in the table below:

ARIMA Parameter Estimation and Backward Selection
Iterationar1ar2ar3ma1sar1sar2sma1
Estimates ( 1 )-0.3634-0.19060.1533-0.77410.19420.1148-0.9998
(p-val)(0.199 )(0.4979 )(0.4977 )(6e-04 )(0.4609 )(0.6811 )(0.0856 )
Estimates ( 2 )-0.3276-0.1590.1764-0.78740.14030-1.0001
(p-val)(0.2368 )(0.5641 )(0.4304 )(7e-04 )(0.5354 )(NA )(0.3411 )
Estimates ( 3 )-0.195400.2739-0.90190.16120-1.0002
(p-val)(0.2414 )(NA )(0.0861 )(0 )(0.4706 )(NA )(0.195 )
Estimates ( 4 )-0.212900.279-0.90700-0.6787
(p-val)(0.1845 )(NA )(0.0762 )(0 )(NA )(NA )(0.034 )
Estimates ( 5 )000.3153-100-0.6386
(p-val)(NA )(NA )(0.04 )(0 )(NA )(NA )(0.0278 )
Estimates ( 6 )NANANANANANANA
(p-val)(NA )(NA )(NA )(NA )(NA )(NA )(NA )
Estimates ( 7 )NANANANANANANA
(p-val)(NA )(NA )(NA )(NA )(NA )(NA )(NA )
Estimates ( 8 )NANANANANANANA
(p-val)(NA )(NA )(NA )(NA )(NA )(NA )(NA )
Estimates ( 9 )NANANANANANANA
(p-val)(NA )(NA )(NA )(NA )(NA )(NA )(NA )
Estimates ( 10 )NANANANANANANA
(p-val)(NA )(NA )(NA )(NA )(NA )(NA )(NA )
Estimates ( 11 )NANANANANANANA
(p-val)(NA )(NA )(NA )(NA )(NA )(NA )(NA )
Estimates ( 12 )NANANANANANANA
(p-val)(NA )(NA )(NA )(NA )(NA )(NA )(NA )
Estimates ( 13 )NANANANANANANA
(p-val)(NA )(NA )(NA )(NA )(NA )(NA )(NA )


Estimated ARIMA Residuals
Value
-0.0645327137243455
-0.113952614137700
-0.251426739122758
-0.429808257099355
0.669120428620666
-0.103461117345896
-0.226744540656663
0.859085060176797
0.229777630206815
0.60633376119242
-0.412929750420221
-0.105408906976053
0.654987764357445
0.711133844429797
0.126310777483413
-0.302781564439296
1.28215117714652
1.33742215144886
-0.356577531544235
-0.388714224131719
-0.142541573709847
0.732700952352894
0.218141037986994
-0.254187701277637
0.409810127735047
0.238842621669700
-0.718410955245222
-0.441560131873685
0.0507641805716118
-0.448414945170152
1.46719356955504
-0.122822986588970
0.328093865088653
-0.00140718734179613
-0.548936726683883
-0.294603320136185
0.0609611863991854
0.331107083745638
-0.488378091051888
1.08687178224799
-0.055853526124487
0.123004006518497
0.390897727246008
-0.32133750469631
0.441381189630645
0.0215378739606403
-0.0689313056252462
0.132537306446828

\begin{tabular}{lllllllll}
\hline
Estimated ARIMA Residuals \tabularnewline
Value \tabularnewline
-0.0645327137243455 \tabularnewline
-0.113952614137700 \tabularnewline
-0.251426739122758 \tabularnewline
-0.429808257099355 \tabularnewline
0.669120428620666 \tabularnewline
-0.103461117345896 \tabularnewline
-0.226744540656663 \tabularnewline
0.859085060176797 \tabularnewline
0.229777630206815 \tabularnewline
0.60633376119242 \tabularnewline
-0.412929750420221 \tabularnewline
-0.105408906976053 \tabularnewline
0.654987764357445 \tabularnewline
0.711133844429797 \tabularnewline
0.126310777483413 \tabularnewline
-0.302781564439296 \tabularnewline
1.28215117714652 \tabularnewline
1.33742215144886 \tabularnewline
-0.356577531544235 \tabularnewline
-0.388714224131719 \tabularnewline
-0.142541573709847 \tabularnewline
0.732700952352894 \tabularnewline
0.218141037986994 \tabularnewline
-0.254187701277637 \tabularnewline
0.409810127735047 \tabularnewline
0.238842621669700 \tabularnewline
-0.718410955245222 \tabularnewline
-0.441560131873685 \tabularnewline
0.0507641805716118 \tabularnewline
-0.448414945170152 \tabularnewline
1.46719356955504 \tabularnewline
-0.122822986588970 \tabularnewline
0.328093865088653 \tabularnewline
-0.00140718734179613 \tabularnewline
-0.548936726683883 \tabularnewline
-0.294603320136185 \tabularnewline
0.0609611863991854 \tabularnewline
0.331107083745638 \tabularnewline
-0.488378091051888 \tabularnewline
1.08687178224799 \tabularnewline
-0.055853526124487 \tabularnewline
0.123004006518497 \tabularnewline
0.390897727246008 \tabularnewline
-0.32133750469631 \tabularnewline
0.441381189630645 \tabularnewline
0.0215378739606403 \tabularnewline
-0.0689313056252462 \tabularnewline
0.132537306446828 \tabularnewline
\hline
\end{tabular}
%Source: https://freestatistics.org/blog/index.php?pk=31077&T=2

[TABLE]
[ROW][C]Estimated ARIMA Residuals[/C][/ROW]
[ROW][C]Value[/C][/ROW]
[ROW][C]-0.0645327137243455[/C][/ROW]
[ROW][C]-0.113952614137700[/C][/ROW]
[ROW][C]-0.251426739122758[/C][/ROW]
[ROW][C]-0.429808257099355[/C][/ROW]
[ROW][C]0.669120428620666[/C][/ROW]
[ROW][C]-0.103461117345896[/C][/ROW]
[ROW][C]-0.226744540656663[/C][/ROW]
[ROW][C]0.859085060176797[/C][/ROW]
[ROW][C]0.229777630206815[/C][/ROW]
[ROW][C]0.60633376119242[/C][/ROW]
[ROW][C]-0.412929750420221[/C][/ROW]
[ROW][C]-0.105408906976053[/C][/ROW]
[ROW][C]0.654987764357445[/C][/ROW]
[ROW][C]0.711133844429797[/C][/ROW]
[ROW][C]0.126310777483413[/C][/ROW]
[ROW][C]-0.302781564439296[/C][/ROW]
[ROW][C]1.28215117714652[/C][/ROW]
[ROW][C]1.33742215144886[/C][/ROW]
[ROW][C]-0.356577531544235[/C][/ROW]
[ROW][C]-0.388714224131719[/C][/ROW]
[ROW][C]-0.142541573709847[/C][/ROW]
[ROW][C]0.732700952352894[/C][/ROW]
[ROW][C]0.218141037986994[/C][/ROW]
[ROW][C]-0.254187701277637[/C][/ROW]
[ROW][C]0.409810127735047[/C][/ROW]
[ROW][C]0.238842621669700[/C][/ROW]
[ROW][C]-0.718410955245222[/C][/ROW]
[ROW][C]-0.441560131873685[/C][/ROW]
[ROW][C]0.0507641805716118[/C][/ROW]
[ROW][C]-0.448414945170152[/C][/ROW]
[ROW][C]1.46719356955504[/C][/ROW]
[ROW][C]-0.122822986588970[/C][/ROW]
[ROW][C]0.328093865088653[/C][/ROW]
[ROW][C]-0.00140718734179613[/C][/ROW]
[ROW][C]-0.548936726683883[/C][/ROW]
[ROW][C]-0.294603320136185[/C][/ROW]
[ROW][C]0.0609611863991854[/C][/ROW]
[ROW][C]0.331107083745638[/C][/ROW]
[ROW][C]-0.488378091051888[/C][/ROW]
[ROW][C]1.08687178224799[/C][/ROW]
[ROW][C]-0.055853526124487[/C][/ROW]
[ROW][C]0.123004006518497[/C][/ROW]
[ROW][C]0.390897727246008[/C][/ROW]
[ROW][C]-0.32133750469631[/C][/ROW]
[ROW][C]0.441381189630645[/C][/ROW]
[ROW][C]0.0215378739606403[/C][/ROW]
[ROW][C]-0.0689313056252462[/C][/ROW]
[ROW][C]0.132537306446828[/C][/ROW]
[/TABLE]
Source: https://freestatistics.org/blog/index.php?pk=31077&T=2

Globally Unique Identifier (entire table): ba.freestatistics.org/blog/index.php?pk=31077&T=2

As an alternative you can also use a QR Code:  

The GUIDs for individual cells are displayed in the table below:

Estimated ARIMA Residuals
Value
-0.0645327137243455
-0.113952614137700
-0.251426739122758
-0.429808257099355
0.669120428620666
-0.103461117345896
-0.226744540656663
0.859085060176797
0.229777630206815
0.60633376119242
-0.412929750420221
-0.105408906976053
0.654987764357445
0.711133844429797
0.126310777483413
-0.302781564439296
1.28215117714652
1.33742215144886
-0.356577531544235
-0.388714224131719
-0.142541573709847
0.732700952352894
0.218141037986994
-0.254187701277637
0.409810127735047
0.238842621669700
-0.718410955245222
-0.441560131873685
0.0507641805716118
-0.448414945170152
1.46719356955504
-0.122822986588970
0.328093865088653
-0.00140718734179613
-0.548936726683883
-0.294603320136185
0.0609611863991854
0.331107083745638
-0.488378091051888
1.08687178224799
-0.055853526124487
0.123004006518497
0.390897727246008
-0.32133750469631
0.441381189630645
0.0215378739606403
-0.0689313056252462
0.132537306446828


Parameters (Session):
par1 = 60 ; par2 = 1 ; par3 = 1 ; par4 = 1 ; par5 = 12 ;
Parameters (R input):
par1 = FALSE ; par2 = 0.5 ; par3 = 1 ; par4 = 1 ; par5 = 12 ; par6 = 3 ; par7 = 1 ; par8 = 2 ; par9 = 1 ;
R code (references can be found in the software module):
library(lattice)
if (par1 == 'TRUE') par1 <- TRUE
if (par1 == 'FALSE') par1 <- FALSE
par2 <- as.numeric(par2) #Box-Cox lambda transformation parameter
par3 <- as.numeric(par3) #degree of non-seasonal differencing
par4 <- as.numeric(par4) #degree of seasonal differencing
par5 <- as.numeric(par5) #seasonal period
par6 <- as.numeric(par6) #degree (p) of the non-seasonal AR(p) polynomial
par7 <- as.numeric(par7) #degree (q) of the non-seasonal MA(q) polynomial
par8 <- as.numeric(par8) #degree (P) of the seasonal AR(P) polynomial
par9 <- as.numeric(par9) #degree (Q) of the seasonal MA(Q) polynomial
armaGR <- function(arima.out, names, n){
try1 <- arima.out$coef
try2 <- sqrt(diag(arima.out$var.coef))
try.data.frame <- data.frame(matrix(NA,ncol=4,nrow=length(names)))
dimnames(try.data.frame) <- list(names,c('coef','std','tstat','pv'))
try.data.frame[,1] <- try1
for(i in 1:length(try2)) try.data.frame[which(rownames(try.data.frame)==names(try2)[i]),2] <- try2[i]
try.data.frame[,3] <- try.data.frame[,1] / try.data.frame[,2]
try.data.frame[,4] <- round((1-pt(abs(try.data.frame[,3]),df=n-(length(try2)+1)))*2,5)
vector <- rep(NA,length(names))
vector[is.na(try.data.frame[,4])] <- 0
maxi <- which.max(try.data.frame[,4])
continue <- max(try.data.frame[,4],na.rm=TRUE) > .05
vector[maxi] <- 0
list(summary=try.data.frame,next.vector=vector,continue=continue)
}
arimaSelect <- function(series, order=c(13,0,0), seasonal=list(order=c(2,0,0),period=12), include.mean=F){
nrc <- order[1]+order[3]+seasonal$order[1]+seasonal$order[3]
coeff <- matrix(NA, nrow=nrc*2, ncol=nrc)
pval <- matrix(NA, nrow=nrc*2, ncol=nrc)
mylist <- rep(list(NULL), nrc)
names <- NULL
if(order[1] > 0) names <- paste('ar',1:order[1],sep='')
if(order[3] > 0) names <- c( names , paste('ma',1:order[3],sep='') )
if(seasonal$order[1] > 0) names <- c(names, paste('sar',1:seasonal$order[1],sep=''))
if(seasonal$order[3] > 0) names <- c(names, paste('sma',1:seasonal$order[3],sep=''))
arima.out <- arima(series, order=order, seasonal=seasonal, include.mean=include.mean, method='ML')
mylist[[1]] <- arima.out
last.arma <- armaGR(arima.out, names, length(series))
mystop <- FALSE
i <- 1
coeff[i,] <- last.arma[[1]][,1]
pval [i,] <- last.arma[[1]][,4]
i <- 2
aic <- arima.out$aic
while(!mystop){
mylist[[i]] <- arima.out
arima.out <- arima(series, order=order, seasonal=seasonal, include.mean=include.mean, method='ML', fixed=last.arma$next.vector)
aic <- c(aic, arima.out$aic)
last.arma <- armaGR(arima.out, names, length(series))
mystop <- !last.arma$continue
coeff[i,] <- last.arma[[1]][,1]
pval [i,] <- last.arma[[1]][,4]
i <- i+1
}
list(coeff, pval, mylist, aic=aic)
}
arimaSelectplot <- function(arimaSelect.out,noms,choix){
noms <- names(arimaSelect.out[[3]][[1]]$coef)
coeff <- arimaSelect.out[[1]]
k <- min(which(is.na(coeff[,1])))-1
coeff <- coeff[1:k,]
pval <- arimaSelect.out[[2]][1:k,]
aic <- arimaSelect.out$aic[1:k]
coeff[coeff==0] <- NA
n <- ncol(coeff)
if(missing(choix)) choix <- k
layout(matrix(c(1,1,1,2,
3,3,3,2,
3,3,3,4,
5,6,7,7),nr=4),
widths=c(10,35,45,15),
heights=c(30,30,15,15))
couleurs <- rainbow(75)[1:50]#(50)
ticks <- pretty(coeff)
par(mar=c(1,1,3,1))
plot(aic,k:1-.5,type='o',pch=21,bg='blue',cex=2,axes=F,lty=2,xpd=NA)
points(aic[choix],k-choix+.5,pch=21,cex=4,bg=2,xpd=NA)
title('aic',line=2)
par(mar=c(3,0,0,0))
plot(0,axes=F,xlab='',ylab='',xlim=range(ticks),ylim=c(.1,1))
rect(xleft = min(ticks) + (0:49)/50*(max(ticks)-min(ticks)),
xright = min(ticks) + (1:50)/50*(max(ticks)-min(ticks)),
ytop = rep(1,50),
ybottom= rep(0,50),col=couleurs,border=NA)
axis(1,ticks)
rect(xleft=min(ticks),xright=max(ticks),ytop=1,ybottom=0)
text(mean(coeff,na.rm=T),.5,'coefficients',cex=2,font=2)
par(mar=c(1,1,3,1))
image(1:n,1:k,t(coeff[k:1,]),axes=F,col=couleurs,zlim=range(ticks))
for(i in 1:n) for(j in 1:k) if(!is.na(coeff[j,i])) {
if(pval[j,i]<.01) symb = 'green'
else if( (pval[j,i]<.05) & (pval[j,i]>=.01)) symb = 'orange'
else if( (pval[j,i]<.1) & (pval[j,i]>=.05)) symb = 'red'
else symb = 'black'
polygon(c(i+.5 ,i+.2 ,i+.5 ,i+.5),
c(k-j+0.5,k-j+0.5,k-j+0.8,k-j+0.5),
col=symb)
if(j==choix) {
rect(xleft=i-.5,
xright=i+.5,
ybottom=k-j+1.5,
ytop=k-j+.5,
lwd=4)
text(i,
k-j+1,
round(coeff[j,i],2),
cex=1.2,
font=2)
}
else{
rect(xleft=i-.5,xright=i+.5,ybottom=k-j+1.5,ytop=k-j+.5)
text(i,k-j+1,round(coeff[j,i],2),cex=1.2,font=1)
}
}
axis(3,1:n,noms)
par(mar=c(0.5,0,0,0.5))
plot(0,axes=F,xlab='',ylab='',type='n',xlim=c(0,8),ylim=c(-.2,.8))
cols <- c('green','orange','red','black')
niv <- c('0','0.01','0.05','0.1')
for(i in 0:3){
polygon(c(1+2*i ,1+2*i ,1+2*i-.5 ,1+2*i),
c(.4 ,.7 , .4 , .4),
col=cols[i+1])
text(2*i,0.5,niv[i+1],cex=1.5)
}
text(8,.5,1,cex=1.5)
text(4,0,'p-value',cex=2)
box()
residus <- arimaSelect.out[[3]][[choix]]$res
par(mar=c(1,2,4,1))
acf(residus,main='')
title('acf',line=.5)
par(mar=c(1,2,4,1))
pacf(residus,main='')
title('pacf',line=.5)
par(mar=c(2,2,4,1))
qqnorm(residus,main='')
title('qq-norm',line=.5)
qqline(residus)
residus
}
if (par2 == 0) x <- log(x)
if (par2 != 0) x <- x^par2
(selection <- arimaSelect(x, order=c(par6,par3,par7), seasonal=list(order=c(par8,par4,par9), period=par5)))
bitmap(file='test1.png')
resid <- arimaSelectplot(selection)
dev.off()
resid
bitmap(file='test2.png')
acf(resid,length(resid)/2, main='Residual Autocorrelation Function')
dev.off()
bitmap(file='test3.png')
pacf(resid,length(resid)/2, main='Residual Partial Autocorrelation Function')
dev.off()
bitmap(file='test4.png')
cpgram(resid, main='Residual Cumulative Periodogram')
dev.off()
bitmap(file='test5.png')
hist(resid, main='Residual Histogram', xlab='values of Residuals')
dev.off()
bitmap(file='test6.png')
densityplot(~resid,col='black',main='Residual Density Plot', xlab='values of Residuals')
dev.off()
bitmap(file='test7.png')
qqnorm(resid, main='Residual Normal Q-Q Plot')
qqline(resid)
dev.off()
ncols <- length(selection[[1]][1,])
nrows <- length(selection[[2]][,1])-1
load(file='createtable')
a<-table.start()
a<-table.row.start(a)
a<-table.element(a,'ARIMA Parameter Estimation and Backward Selection', ncols+1,TRUE)
a<-table.row.end(a)
a<-table.row.start(a)
a<-table.element(a,'Iteration', header=TRUE)
for (i in 1:ncols) {
a<-table.element(a,names(selection[[3]][[1]]$coef)[i],header=TRUE)
}
a<-table.row.end(a)
for (j in 1:nrows) {
a<-table.row.start(a)
mydum <- 'Estimates ('
mydum <- paste(mydum,j)
mydum <- paste(mydum,')')
a<-table.element(a,mydum, header=TRUE)
for (i in 1:ncols) {
a<-table.element(a,round(selection[[1]][j,i],4))
}
a<-table.row.end(a)
a<-table.row.start(a)
a<-table.element(a,'(p-val)', header=TRUE)
for (i in 1:ncols) {
mydum <- '('
mydum <- paste(mydum,round(selection[[2]][j,i],4),sep='')
mydum <- paste(mydum,')')
a<-table.element(a,mydum)
}
a<-table.row.end(a)
}
a<-table.end(a)
table.save(a,file='mytable.tab')
a<-table.start()
a<-table.row.start(a)
a<-table.element(a,'Estimated ARIMA Residuals', 1,TRUE)
a<-table.row.end(a)
a<-table.row.start(a)
a<-table.element(a,'Value', 1,TRUE)
a<-table.row.end(a)
for (i in (par4*par5+par3):length(resid)) {
a<-table.row.start(a)
a<-table.element(a,resid[i])
a<-table.row.end(a)
}
a<-table.end(a)
table.save(a,file='mytable1.tab')