Free Statistics

of Irreproducible Research!

Author's title

Author*The author of this computation has been verified*
R Software Modulerwasp_autocorrelation.wasp
Title produced by software(Partial) Autocorrelation Function
Date of computationMon, 08 Dec 2008 14:23:17 -0700
Cite this page as followsStatistical Computations at FreeStatistics.org, Office for Research Development and Education, URL https://freestatistics.org/blog/index.php?v=date/2008/Dec/08/t1228771489f0on6ny0ayrulds.htm/, Retrieved Thu, 16 May 2024 19:19:13 +0000
Statistical Computations at FreeStatistics.org, Office for Research Development and Education, URL https://freestatistics.org/blog/index.php?pk=31059, Retrieved Thu, 16 May 2024 19:19:13 +0000
QR Codes:

Original text written by user:
IsPrivate?No (this computation is public)
User-defined keywords
Estimated Impact163
Family? (F = Feedback message, R = changed R code, M = changed R Module, P = changed Parameters, D = changed Data)
-     [Univariate Data Series] [data set] [2008-12-01 19:54:57] [b98453cac15ba1066b407e146608df68]
F RMP   [Variance Reduction Matrix] [Q1 Identification...] [2008-12-07 12:23:19] [c993f605b206b366f754f7f8c1fcc291]
F RMPD      [(Partial) Autocorrelation Function] [autocorrelatie eigen] [2008-12-08 21:23:17] [70ba55c7ff8e068610dc28fc16e6d1e2] [Current]
-   P         [(Partial) Autocorrelation Function] [Assessment verbet...] [2008-12-10 16:14:55] [46c5a5fbda57fdfa1d4ef48658f82a0c]
Feedback Forum
2008-12-10 16:34:14 [Ken Van den Heuvel] [reply
Je werkt me de verkeerde lambda (cfr. verbetering vorige vragen).

Lambda = 1

http://www.freestatistics.org/blog/index.php?v=date/2008/Dec/10/t12289257297lx6fgc7avz6xll.htm/

Hier heb je de blog met de juiste lambda. Gelukkig veranderd er niet al te veel aan de grafiek. Je had dus nog wel tot de juiste ARMA paramters kunnen komen met jouw gegevens. Dit deed je echter niet.

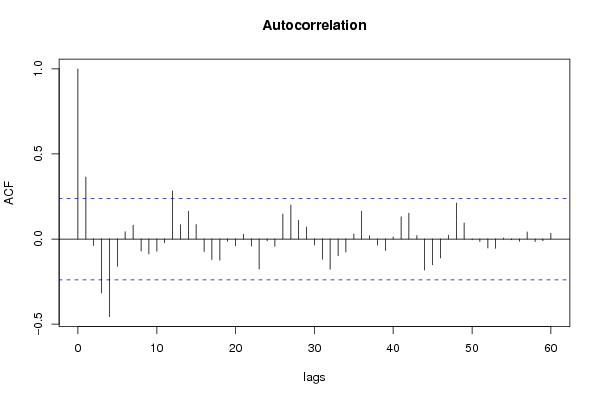
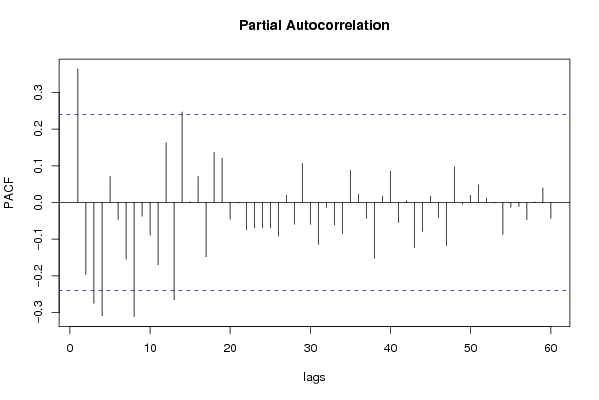
De grafiek is inderdaad niet simpel te interpreteren. Ik echter mits verbeelding toch een mogelijk AR2 (ACF, afwisselend positief negatief) en MA1 (PACF, eerste streepjes negatief en naar 0)proces.

Verder verwijs ik naar de ARIMA backwards selector om te assisteren bij het analyseren. De feedback daaromtrent tref je op het bijhorende feedbackforum van de door jouw geblogde ARIMA backwards selector computatie.

Post a new message
Dataseries X:
7.8
7.6
7.5
7.6
7.5
7.3
7.6
7.5
7.6
7.9
7.9
8.1
8.2
8.0
7.5
6.8
6.5
6.6
7.6
8.0
8.0
7.7
7.5
7.6
7.7
7.9
7.8
7.5
7.5
7.1
7.5
7.5
7.6
7.7
7.7
7.9
8.1
8.2
8.2
8.1
7.9
7.3
6.9
6.6
6.7
6.9
7.0
7.1
7.2
7.1
6.9
7.0
6.8
6.4
6.7
6.7
6.4
6.3
6.2
6.5
6.8
6.8
6.5
6.3
5.9
5.9
6.4
6.4


Summary of computational transaction
Raw Inputview raw input (R code)
Raw Outputview raw output of R engine
Computing time2 seconds
R Server'Sir Ronald Aylmer Fisher' @ 193.190.124.24

\begin{tabular}{lllllllll}
\hline
Summary of computational transaction \tabularnewline
Raw Input & view raw input (R code)  \tabularnewline
Raw Output & view raw output of R engine  \tabularnewline
Computing time & 2 seconds \tabularnewline
R Server & 'Sir Ronald Aylmer Fisher' @ 193.190.124.24 \tabularnewline
\hline
\end{tabular}
%Source: https://freestatistics.org/blog/index.php?pk=31059&T=0

[TABLE]
[ROW][C]Summary of computational transaction[/C][/ROW]
[ROW][C]Raw Input[/C][C]view raw input (R code) [/C][/ROW]
[ROW][C]Raw Output[/C][C]view raw output of R engine [/C][/ROW]
[ROW][C]Computing time[/C][C]2 seconds[/C][/ROW]
[ROW][C]R Server[/C][C]'Sir Ronald Aylmer Fisher' @ 193.190.124.24[/C][/ROW]
[/TABLE]
Source: https://freestatistics.org/blog/index.php?pk=31059&T=0

Globally Unique Identifier (entire table): ba.freestatistics.org/blog/index.php?pk=31059&T=0

As an alternative you can also use a QR Code:  

The GUIDs for individual cells are displayed in the table below:

Summary of computational transaction
Raw Inputview raw input (R code)
Raw Outputview raw output of R engine
Computing time2 seconds
R Server'Sir Ronald Aylmer Fisher' @ 193.190.124.24


Autocorrelation Function
Time lag kACF(k)T-STATP-value
10.3641672.98080.002002
2-0.037788-0.30930.379025
3-0.317456-2.59850.005752
4-0.456428-3.7360.000194
5-0.160519-1.31390.09668
60.0434950.3560.361472
70.0809890.66290.254828
8-0.070521-0.57720.282856
9-0.087354-0.7150.23854
10-0.07238-0.59250.277769
11-0.022454-0.18380.427365
120.2821232.30930.01201
130.084530.69190.245694
140.1633431.3370.09287
150.0849840.69560.244536
16-0.073211-0.59930.27551
17-0.120281-0.98450.164195
18-0.124341-1.01780.156224
19-0.012836-0.10510.458317
20-0.039447-0.32290.373893
210.0288020.23580.407172
22-0.04089-0.33470.369449
23-0.176609-1.44560.076475
24-0.010489-0.08590.465917
25-0.042856-0.35080.363424
260.1464951.19910.117354
270.1998631.63590.05327
280.1107820.90680.183885
290.0705830.57770.282685
30-0.035825-0.29320.385122
31-0.118461-0.96960.167856
32-0.177351-1.45170.075628
33-0.098471-0.8060.211541
34-0.076014-0.62220.267961
350.0294010.24070.405277
360.1639581.34210.092055
370.019850.16250.435708
38-0.03553-0.29080.386042
39-0.067607-0.55340.290921
400.012180.09970.460442
410.1313321.0750.143115
420.1511971.23760.110091
430.0200220.16390.435156
44-0.182579-1.49450.069874
45-0.151372-1.2390.109828
46-0.110988-0.90850.183443
470.0224770.1840.427291
480.2117951.73360.043793
490.094580.77420.220775
50-0.004254-0.03480.486162
51-0.014231-0.11650.453809
52-0.052229-0.42750.335187
53-0.054135-0.44310.329554
540.0053250.04360.48268
55-0.004371-0.03580.485784
56-0.013064-0.10690.45758
570.0410380.33590.368995
58-0.014281-0.11690.453645
59-0.009615-0.07870.468751
600.0337680.27640.391546

\begin{tabular}{lllllllll}
\hline
Autocorrelation Function \tabularnewline
Time lag k & ACF(k) & T-STAT & P-value \tabularnewline
1 & 0.364167 & 2.9808 & 0.002002 \tabularnewline
2 & -0.037788 & -0.3093 & 0.379025 \tabularnewline
3 & -0.317456 & -2.5985 & 0.005752 \tabularnewline
4 & -0.456428 & -3.736 & 0.000194 \tabularnewline
5 & -0.160519 & -1.3139 & 0.09668 \tabularnewline
6 & 0.043495 & 0.356 & 0.361472 \tabularnewline
7 & 0.080989 & 0.6629 & 0.254828 \tabularnewline
8 & -0.070521 & -0.5772 & 0.282856 \tabularnewline
9 & -0.087354 & -0.715 & 0.23854 \tabularnewline
10 & -0.07238 & -0.5925 & 0.277769 \tabularnewline
11 & -0.022454 & -0.1838 & 0.427365 \tabularnewline
12 & 0.282123 & 2.3093 & 0.01201 \tabularnewline
13 & 0.08453 & 0.6919 & 0.245694 \tabularnewline
14 & 0.163343 & 1.337 & 0.09287 \tabularnewline
15 & 0.084984 & 0.6956 & 0.244536 \tabularnewline
16 & -0.073211 & -0.5993 & 0.27551 \tabularnewline
17 & -0.120281 & -0.9845 & 0.164195 \tabularnewline
18 & -0.124341 & -1.0178 & 0.156224 \tabularnewline
19 & -0.012836 & -0.1051 & 0.458317 \tabularnewline
20 & -0.039447 & -0.3229 & 0.373893 \tabularnewline
21 & 0.028802 & 0.2358 & 0.407172 \tabularnewline
22 & -0.04089 & -0.3347 & 0.369449 \tabularnewline
23 & -0.176609 & -1.4456 & 0.076475 \tabularnewline
24 & -0.010489 & -0.0859 & 0.465917 \tabularnewline
25 & -0.042856 & -0.3508 & 0.363424 \tabularnewline
26 & 0.146495 & 1.1991 & 0.117354 \tabularnewline
27 & 0.199863 & 1.6359 & 0.05327 \tabularnewline
28 & 0.110782 & 0.9068 & 0.183885 \tabularnewline
29 & 0.070583 & 0.5777 & 0.282685 \tabularnewline
30 & -0.035825 & -0.2932 & 0.385122 \tabularnewline
31 & -0.118461 & -0.9696 & 0.167856 \tabularnewline
32 & -0.177351 & -1.4517 & 0.075628 \tabularnewline
33 & -0.098471 & -0.806 & 0.211541 \tabularnewline
34 & -0.076014 & -0.6222 & 0.267961 \tabularnewline
35 & 0.029401 & 0.2407 & 0.405277 \tabularnewline
36 & 0.163958 & 1.3421 & 0.092055 \tabularnewline
37 & 0.01985 & 0.1625 & 0.435708 \tabularnewline
38 & -0.03553 & -0.2908 & 0.386042 \tabularnewline
39 & -0.067607 & -0.5534 & 0.290921 \tabularnewline
40 & 0.01218 & 0.0997 & 0.460442 \tabularnewline
41 & 0.131332 & 1.075 & 0.143115 \tabularnewline
42 & 0.151197 & 1.2376 & 0.110091 \tabularnewline
43 & 0.020022 & 0.1639 & 0.435156 \tabularnewline
44 & -0.182579 & -1.4945 & 0.069874 \tabularnewline
45 & -0.151372 & -1.239 & 0.109828 \tabularnewline
46 & -0.110988 & -0.9085 & 0.183443 \tabularnewline
47 & 0.022477 & 0.184 & 0.427291 \tabularnewline
48 & 0.211795 & 1.7336 & 0.043793 \tabularnewline
49 & 0.09458 & 0.7742 & 0.220775 \tabularnewline
50 & -0.004254 & -0.0348 & 0.486162 \tabularnewline
51 & -0.014231 & -0.1165 & 0.453809 \tabularnewline
52 & -0.052229 & -0.4275 & 0.335187 \tabularnewline
53 & -0.054135 & -0.4431 & 0.329554 \tabularnewline
54 & 0.005325 & 0.0436 & 0.48268 \tabularnewline
55 & -0.004371 & -0.0358 & 0.485784 \tabularnewline
56 & -0.013064 & -0.1069 & 0.45758 \tabularnewline
57 & 0.041038 & 0.3359 & 0.368995 \tabularnewline
58 & -0.014281 & -0.1169 & 0.453645 \tabularnewline
59 & -0.009615 & -0.0787 & 0.468751 \tabularnewline
60 & 0.033768 & 0.2764 & 0.391546 \tabularnewline
\hline
\end{tabular}
%Source: https://freestatistics.org/blog/index.php?pk=31059&T=1

[TABLE]
[ROW][C]Autocorrelation Function[/C][/ROW]
[ROW][C]Time lag k[/C][C]ACF(k)[/C][C]T-STAT[/C][C]P-value[/C][/ROW]
[ROW][C]1[/C][C]0.364167[/C][C]2.9808[/C][C]0.002002[/C][/ROW]
[ROW][C]2[/C][C]-0.037788[/C][C]-0.3093[/C][C]0.379025[/C][/ROW]
[ROW][C]3[/C][C]-0.317456[/C][C]-2.5985[/C][C]0.005752[/C][/ROW]
[ROW][C]4[/C][C]-0.456428[/C][C]-3.736[/C][C]0.000194[/C][/ROW]
[ROW][C]5[/C][C]-0.160519[/C][C]-1.3139[/C][C]0.09668[/C][/ROW]
[ROW][C]6[/C][C]0.043495[/C][C]0.356[/C][C]0.361472[/C][/ROW]
[ROW][C]7[/C][C]0.080989[/C][C]0.6629[/C][C]0.254828[/C][/ROW]
[ROW][C]8[/C][C]-0.070521[/C][C]-0.5772[/C][C]0.282856[/C][/ROW]
[ROW][C]9[/C][C]-0.087354[/C][C]-0.715[/C][C]0.23854[/C][/ROW]
[ROW][C]10[/C][C]-0.07238[/C][C]-0.5925[/C][C]0.277769[/C][/ROW]
[ROW][C]11[/C][C]-0.022454[/C][C]-0.1838[/C][C]0.427365[/C][/ROW]
[ROW][C]12[/C][C]0.282123[/C][C]2.3093[/C][C]0.01201[/C][/ROW]
[ROW][C]13[/C][C]0.08453[/C][C]0.6919[/C][C]0.245694[/C][/ROW]
[ROW][C]14[/C][C]0.163343[/C][C]1.337[/C][C]0.09287[/C][/ROW]
[ROW][C]15[/C][C]0.084984[/C][C]0.6956[/C][C]0.244536[/C][/ROW]
[ROW][C]16[/C][C]-0.073211[/C][C]-0.5993[/C][C]0.27551[/C][/ROW]
[ROW][C]17[/C][C]-0.120281[/C][C]-0.9845[/C][C]0.164195[/C][/ROW]
[ROW][C]18[/C][C]-0.124341[/C][C]-1.0178[/C][C]0.156224[/C][/ROW]
[ROW][C]19[/C][C]-0.012836[/C][C]-0.1051[/C][C]0.458317[/C][/ROW]
[ROW][C]20[/C][C]-0.039447[/C][C]-0.3229[/C][C]0.373893[/C][/ROW]
[ROW][C]21[/C][C]0.028802[/C][C]0.2358[/C][C]0.407172[/C][/ROW]
[ROW][C]22[/C][C]-0.04089[/C][C]-0.3347[/C][C]0.369449[/C][/ROW]
[ROW][C]23[/C][C]-0.176609[/C][C]-1.4456[/C][C]0.076475[/C][/ROW]
[ROW][C]24[/C][C]-0.010489[/C][C]-0.0859[/C][C]0.465917[/C][/ROW]
[ROW][C]25[/C][C]-0.042856[/C][C]-0.3508[/C][C]0.363424[/C][/ROW]
[ROW][C]26[/C][C]0.146495[/C][C]1.1991[/C][C]0.117354[/C][/ROW]
[ROW][C]27[/C][C]0.199863[/C][C]1.6359[/C][C]0.05327[/C][/ROW]
[ROW][C]28[/C][C]0.110782[/C][C]0.9068[/C][C]0.183885[/C][/ROW]
[ROW][C]29[/C][C]0.070583[/C][C]0.5777[/C][C]0.282685[/C][/ROW]
[ROW][C]30[/C][C]-0.035825[/C][C]-0.2932[/C][C]0.385122[/C][/ROW]
[ROW][C]31[/C][C]-0.118461[/C][C]-0.9696[/C][C]0.167856[/C][/ROW]
[ROW][C]32[/C][C]-0.177351[/C][C]-1.4517[/C][C]0.075628[/C][/ROW]
[ROW][C]33[/C][C]-0.098471[/C][C]-0.806[/C][C]0.211541[/C][/ROW]
[ROW][C]34[/C][C]-0.076014[/C][C]-0.6222[/C][C]0.267961[/C][/ROW]
[ROW][C]35[/C][C]0.029401[/C][C]0.2407[/C][C]0.405277[/C][/ROW]
[ROW][C]36[/C][C]0.163958[/C][C]1.3421[/C][C]0.092055[/C][/ROW]
[ROW][C]37[/C][C]0.01985[/C][C]0.1625[/C][C]0.435708[/C][/ROW]
[ROW][C]38[/C][C]-0.03553[/C][C]-0.2908[/C][C]0.386042[/C][/ROW]
[ROW][C]39[/C][C]-0.067607[/C][C]-0.5534[/C][C]0.290921[/C][/ROW]
[ROW][C]40[/C][C]0.01218[/C][C]0.0997[/C][C]0.460442[/C][/ROW]
[ROW][C]41[/C][C]0.131332[/C][C]1.075[/C][C]0.143115[/C][/ROW]
[ROW][C]42[/C][C]0.151197[/C][C]1.2376[/C][C]0.110091[/C][/ROW]
[ROW][C]43[/C][C]0.020022[/C][C]0.1639[/C][C]0.435156[/C][/ROW]
[ROW][C]44[/C][C]-0.182579[/C][C]-1.4945[/C][C]0.069874[/C][/ROW]
[ROW][C]45[/C][C]-0.151372[/C][C]-1.239[/C][C]0.109828[/C][/ROW]
[ROW][C]46[/C][C]-0.110988[/C][C]-0.9085[/C][C]0.183443[/C][/ROW]
[ROW][C]47[/C][C]0.022477[/C][C]0.184[/C][C]0.427291[/C][/ROW]
[ROW][C]48[/C][C]0.211795[/C][C]1.7336[/C][C]0.043793[/C][/ROW]
[ROW][C]49[/C][C]0.09458[/C][C]0.7742[/C][C]0.220775[/C][/ROW]
[ROW][C]50[/C][C]-0.004254[/C][C]-0.0348[/C][C]0.486162[/C][/ROW]
[ROW][C]51[/C][C]-0.014231[/C][C]-0.1165[/C][C]0.453809[/C][/ROW]
[ROW][C]52[/C][C]-0.052229[/C][C]-0.4275[/C][C]0.335187[/C][/ROW]
[ROW][C]53[/C][C]-0.054135[/C][C]-0.4431[/C][C]0.329554[/C][/ROW]
[ROW][C]54[/C][C]0.005325[/C][C]0.0436[/C][C]0.48268[/C][/ROW]
[ROW][C]55[/C][C]-0.004371[/C][C]-0.0358[/C][C]0.485784[/C][/ROW]
[ROW][C]56[/C][C]-0.013064[/C][C]-0.1069[/C][C]0.45758[/C][/ROW]
[ROW][C]57[/C][C]0.041038[/C][C]0.3359[/C][C]0.368995[/C][/ROW]
[ROW][C]58[/C][C]-0.014281[/C][C]-0.1169[/C][C]0.453645[/C][/ROW]
[ROW][C]59[/C][C]-0.009615[/C][C]-0.0787[/C][C]0.468751[/C][/ROW]
[ROW][C]60[/C][C]0.033768[/C][C]0.2764[/C][C]0.391546[/C][/ROW]
[/TABLE]
Source: https://freestatistics.org/blog/index.php?pk=31059&T=1

Globally Unique Identifier (entire table): ba.freestatistics.org/blog/index.php?pk=31059&T=1

As an alternative you can also use a QR Code:  

The GUIDs for individual cells are displayed in the table below:

Autocorrelation Function
Time lag kACF(k)T-STATP-value
10.3641672.98080.002002
2-0.037788-0.30930.379025
3-0.317456-2.59850.005752
4-0.456428-3.7360.000194
5-0.160519-1.31390.09668
60.0434950.3560.361472
70.0809890.66290.254828
8-0.070521-0.57720.282856
9-0.087354-0.7150.23854
10-0.07238-0.59250.277769
11-0.022454-0.18380.427365
120.2821232.30930.01201
130.084530.69190.245694
140.1633431.3370.09287
150.0849840.69560.244536
16-0.073211-0.59930.27551
17-0.120281-0.98450.164195
18-0.124341-1.01780.156224
19-0.012836-0.10510.458317
20-0.039447-0.32290.373893
210.0288020.23580.407172
22-0.04089-0.33470.369449
23-0.176609-1.44560.076475
24-0.010489-0.08590.465917
25-0.042856-0.35080.363424
260.1464951.19910.117354
270.1998631.63590.05327
280.1107820.90680.183885
290.0705830.57770.282685
30-0.035825-0.29320.385122
31-0.118461-0.96960.167856
32-0.177351-1.45170.075628
33-0.098471-0.8060.211541
34-0.076014-0.62220.267961
350.0294010.24070.405277
360.1639581.34210.092055
370.019850.16250.435708
38-0.03553-0.29080.386042
39-0.067607-0.55340.290921
400.012180.09970.460442
410.1313321.0750.143115
420.1511971.23760.110091
430.0200220.16390.435156
44-0.182579-1.49450.069874
45-0.151372-1.2390.109828
46-0.110988-0.90850.183443
470.0224770.1840.427291
480.2117951.73360.043793
490.094580.77420.220775
50-0.004254-0.03480.486162
51-0.014231-0.11650.453809
52-0.052229-0.42750.335187
53-0.054135-0.44310.329554
540.0053250.04360.48268
55-0.004371-0.03580.485784
56-0.013064-0.10690.45758
570.0410380.33590.368995
58-0.014281-0.11690.453645
59-0.009615-0.07870.468751
600.0337680.27640.391546


Partial Autocorrelation Function
Time lag kPACF(k)T-STATP-value
10.3641672.98080.002002
2-0.19646-1.60810.056259
3-0.275148-2.25220.013796
4-0.308733-2.52710.006934
50.0711010.5820.281265
6-0.046161-0.37780.353371
7-0.155169-1.27010.104219
8-0.311396-2.54890.006552
9-0.037755-0.3090.379126
10-0.089178-0.730.233982
11-0.170146-1.39270.084157
120.1631321.33530.09315
13-0.265109-2.170.016778
140.2466272.01870.02376
150.0016720.01370.494561
160.0708380.57980.281987
17-0.147709-1.2090.115447
180.136551.11770.133841
190.1206680.98770.163424
20-0.045803-0.37490.354454
21-0.001418-0.01160.495386
22-0.075236-0.61580.270044
23-0.068611-0.56160.288129
24-0.068491-0.56060.288463
25-0.069175-0.56620.286566
26-0.091341-0.74770.228641
270.019570.16020.436609
28-0.059089-0.48370.315102
290.1063840.87080.193488
30-0.059693-0.48860.313358
31-0.113962-0.93280.177131
32-0.013569-0.11110.455949
33-0.060826-0.49790.310099
34-0.084764-0.69380.245095
350.0873590.71510.238527
360.0227880.18650.426298
37-0.042697-0.34950.363907
38-0.152421-1.24760.108256
390.0172830.14150.443963
400.0853770.69880.243536
41-0.054649-0.44730.328042
420.0046390.0380.484911
43-0.123077-1.00740.158676
44-0.07872-0.64430.260775
450.0167790.13730.445585
46-0.041143-0.33680.368672
47-0.117914-0.96520.168966
480.0970730.79460.214832
49-0.004474-0.03660.48545
500.0194290.1590.43706
510.0474970.38880.349336
520.0122090.09990.460346
53-0.001538-0.01260.494996
54-0.087198-0.71370.238933
55-0.013177-0.10790.457216
56-0.010968-0.08980.464367
57-0.046261-0.37870.353067
580.001630.01330.494698
590.0393440.3220.37421
60-0.043016-0.35210.362935

\begin{tabular}{lllllllll}
\hline
Partial Autocorrelation Function \tabularnewline
Time lag k & PACF(k) & T-STAT & P-value \tabularnewline
1 & 0.364167 & 2.9808 & 0.002002 \tabularnewline
2 & -0.19646 & -1.6081 & 0.056259 \tabularnewline
3 & -0.275148 & -2.2522 & 0.013796 \tabularnewline
4 & -0.308733 & -2.5271 & 0.006934 \tabularnewline
5 & 0.071101 & 0.582 & 0.281265 \tabularnewline
6 & -0.046161 & -0.3778 & 0.353371 \tabularnewline
7 & -0.155169 & -1.2701 & 0.104219 \tabularnewline
8 & -0.311396 & -2.5489 & 0.006552 \tabularnewline
9 & -0.037755 & -0.309 & 0.379126 \tabularnewline
10 & -0.089178 & -0.73 & 0.233982 \tabularnewline
11 & -0.170146 & -1.3927 & 0.084157 \tabularnewline
12 & 0.163132 & 1.3353 & 0.09315 \tabularnewline
13 & -0.265109 & -2.17 & 0.016778 \tabularnewline
14 & 0.246627 & 2.0187 & 0.02376 \tabularnewline
15 & 0.001672 & 0.0137 & 0.494561 \tabularnewline
16 & 0.070838 & 0.5798 & 0.281987 \tabularnewline
17 & -0.147709 & -1.209 & 0.115447 \tabularnewline
18 & 0.13655 & 1.1177 & 0.133841 \tabularnewline
19 & 0.120668 & 0.9877 & 0.163424 \tabularnewline
20 & -0.045803 & -0.3749 & 0.354454 \tabularnewline
21 & -0.001418 & -0.0116 & 0.495386 \tabularnewline
22 & -0.075236 & -0.6158 & 0.270044 \tabularnewline
23 & -0.068611 & -0.5616 & 0.288129 \tabularnewline
24 & -0.068491 & -0.5606 & 0.288463 \tabularnewline
25 & -0.069175 & -0.5662 & 0.286566 \tabularnewline
26 & -0.091341 & -0.7477 & 0.228641 \tabularnewline
27 & 0.01957 & 0.1602 & 0.436609 \tabularnewline
28 & -0.059089 & -0.4837 & 0.315102 \tabularnewline
29 & 0.106384 & 0.8708 & 0.193488 \tabularnewline
30 & -0.059693 & -0.4886 & 0.313358 \tabularnewline
31 & -0.113962 & -0.9328 & 0.177131 \tabularnewline
32 & -0.013569 & -0.1111 & 0.455949 \tabularnewline
33 & -0.060826 & -0.4979 & 0.310099 \tabularnewline
34 & -0.084764 & -0.6938 & 0.245095 \tabularnewline
35 & 0.087359 & 0.7151 & 0.238527 \tabularnewline
36 & 0.022788 & 0.1865 & 0.426298 \tabularnewline
37 & -0.042697 & -0.3495 & 0.363907 \tabularnewline
38 & -0.152421 & -1.2476 & 0.108256 \tabularnewline
39 & 0.017283 & 0.1415 & 0.443963 \tabularnewline
40 & 0.085377 & 0.6988 & 0.243536 \tabularnewline
41 & -0.054649 & -0.4473 & 0.328042 \tabularnewline
42 & 0.004639 & 0.038 & 0.484911 \tabularnewline
43 & -0.123077 & -1.0074 & 0.158676 \tabularnewline
44 & -0.07872 & -0.6443 & 0.260775 \tabularnewline
45 & 0.016779 & 0.1373 & 0.445585 \tabularnewline
46 & -0.041143 & -0.3368 & 0.368672 \tabularnewline
47 & -0.117914 & -0.9652 & 0.168966 \tabularnewline
48 & 0.097073 & 0.7946 & 0.214832 \tabularnewline
49 & -0.004474 & -0.0366 & 0.48545 \tabularnewline
50 & 0.019429 & 0.159 & 0.43706 \tabularnewline
51 & 0.047497 & 0.3888 & 0.349336 \tabularnewline
52 & 0.012209 & 0.0999 & 0.460346 \tabularnewline
53 & -0.001538 & -0.0126 & 0.494996 \tabularnewline
54 & -0.087198 & -0.7137 & 0.238933 \tabularnewline
55 & -0.013177 & -0.1079 & 0.457216 \tabularnewline
56 & -0.010968 & -0.0898 & 0.464367 \tabularnewline
57 & -0.046261 & -0.3787 & 0.353067 \tabularnewline
58 & 0.00163 & 0.0133 & 0.494698 \tabularnewline
59 & 0.039344 & 0.322 & 0.37421 \tabularnewline
60 & -0.043016 & -0.3521 & 0.362935 \tabularnewline
\hline
\end{tabular}
%Source: https://freestatistics.org/blog/index.php?pk=31059&T=2

[TABLE]
[ROW][C]Partial Autocorrelation Function[/C][/ROW]
[ROW][C]Time lag k[/C][C]PACF(k)[/C][C]T-STAT[/C][C]P-value[/C][/ROW]
[ROW][C]1[/C][C]0.364167[/C][C]2.9808[/C][C]0.002002[/C][/ROW]
[ROW][C]2[/C][C]-0.19646[/C][C]-1.6081[/C][C]0.056259[/C][/ROW]
[ROW][C]3[/C][C]-0.275148[/C][C]-2.2522[/C][C]0.013796[/C][/ROW]
[ROW][C]4[/C][C]-0.308733[/C][C]-2.5271[/C][C]0.006934[/C][/ROW]
[ROW][C]5[/C][C]0.071101[/C][C]0.582[/C][C]0.281265[/C][/ROW]
[ROW][C]6[/C][C]-0.046161[/C][C]-0.3778[/C][C]0.353371[/C][/ROW]
[ROW][C]7[/C][C]-0.155169[/C][C]-1.2701[/C][C]0.104219[/C][/ROW]
[ROW][C]8[/C][C]-0.311396[/C][C]-2.5489[/C][C]0.006552[/C][/ROW]
[ROW][C]9[/C][C]-0.037755[/C][C]-0.309[/C][C]0.379126[/C][/ROW]
[ROW][C]10[/C][C]-0.089178[/C][C]-0.73[/C][C]0.233982[/C][/ROW]
[ROW][C]11[/C][C]-0.170146[/C][C]-1.3927[/C][C]0.084157[/C][/ROW]
[ROW][C]12[/C][C]0.163132[/C][C]1.3353[/C][C]0.09315[/C][/ROW]
[ROW][C]13[/C][C]-0.265109[/C][C]-2.17[/C][C]0.016778[/C][/ROW]
[ROW][C]14[/C][C]0.246627[/C][C]2.0187[/C][C]0.02376[/C][/ROW]
[ROW][C]15[/C][C]0.001672[/C][C]0.0137[/C][C]0.494561[/C][/ROW]
[ROW][C]16[/C][C]0.070838[/C][C]0.5798[/C][C]0.281987[/C][/ROW]
[ROW][C]17[/C][C]-0.147709[/C][C]-1.209[/C][C]0.115447[/C][/ROW]
[ROW][C]18[/C][C]0.13655[/C][C]1.1177[/C][C]0.133841[/C][/ROW]
[ROW][C]19[/C][C]0.120668[/C][C]0.9877[/C][C]0.163424[/C][/ROW]
[ROW][C]20[/C][C]-0.045803[/C][C]-0.3749[/C][C]0.354454[/C][/ROW]
[ROW][C]21[/C][C]-0.001418[/C][C]-0.0116[/C][C]0.495386[/C][/ROW]
[ROW][C]22[/C][C]-0.075236[/C][C]-0.6158[/C][C]0.270044[/C][/ROW]
[ROW][C]23[/C][C]-0.068611[/C][C]-0.5616[/C][C]0.288129[/C][/ROW]
[ROW][C]24[/C][C]-0.068491[/C][C]-0.5606[/C][C]0.288463[/C][/ROW]
[ROW][C]25[/C][C]-0.069175[/C][C]-0.5662[/C][C]0.286566[/C][/ROW]
[ROW][C]26[/C][C]-0.091341[/C][C]-0.7477[/C][C]0.228641[/C][/ROW]
[ROW][C]27[/C][C]0.01957[/C][C]0.1602[/C][C]0.436609[/C][/ROW]
[ROW][C]28[/C][C]-0.059089[/C][C]-0.4837[/C][C]0.315102[/C][/ROW]
[ROW][C]29[/C][C]0.106384[/C][C]0.8708[/C][C]0.193488[/C][/ROW]
[ROW][C]30[/C][C]-0.059693[/C][C]-0.4886[/C][C]0.313358[/C][/ROW]
[ROW][C]31[/C][C]-0.113962[/C][C]-0.9328[/C][C]0.177131[/C][/ROW]
[ROW][C]32[/C][C]-0.013569[/C][C]-0.1111[/C][C]0.455949[/C][/ROW]
[ROW][C]33[/C][C]-0.060826[/C][C]-0.4979[/C][C]0.310099[/C][/ROW]
[ROW][C]34[/C][C]-0.084764[/C][C]-0.6938[/C][C]0.245095[/C][/ROW]
[ROW][C]35[/C][C]0.087359[/C][C]0.7151[/C][C]0.238527[/C][/ROW]
[ROW][C]36[/C][C]0.022788[/C][C]0.1865[/C][C]0.426298[/C][/ROW]
[ROW][C]37[/C][C]-0.042697[/C][C]-0.3495[/C][C]0.363907[/C][/ROW]
[ROW][C]38[/C][C]-0.152421[/C][C]-1.2476[/C][C]0.108256[/C][/ROW]
[ROW][C]39[/C][C]0.017283[/C][C]0.1415[/C][C]0.443963[/C][/ROW]
[ROW][C]40[/C][C]0.085377[/C][C]0.6988[/C][C]0.243536[/C][/ROW]
[ROW][C]41[/C][C]-0.054649[/C][C]-0.4473[/C][C]0.328042[/C][/ROW]
[ROW][C]42[/C][C]0.004639[/C][C]0.038[/C][C]0.484911[/C][/ROW]
[ROW][C]43[/C][C]-0.123077[/C][C]-1.0074[/C][C]0.158676[/C][/ROW]
[ROW][C]44[/C][C]-0.07872[/C][C]-0.6443[/C][C]0.260775[/C][/ROW]
[ROW][C]45[/C][C]0.016779[/C][C]0.1373[/C][C]0.445585[/C][/ROW]
[ROW][C]46[/C][C]-0.041143[/C][C]-0.3368[/C][C]0.368672[/C][/ROW]
[ROW][C]47[/C][C]-0.117914[/C][C]-0.9652[/C][C]0.168966[/C][/ROW]
[ROW][C]48[/C][C]0.097073[/C][C]0.7946[/C][C]0.214832[/C][/ROW]
[ROW][C]49[/C][C]-0.004474[/C][C]-0.0366[/C][C]0.48545[/C][/ROW]
[ROW][C]50[/C][C]0.019429[/C][C]0.159[/C][C]0.43706[/C][/ROW]
[ROW][C]51[/C][C]0.047497[/C][C]0.3888[/C][C]0.349336[/C][/ROW]
[ROW][C]52[/C][C]0.012209[/C][C]0.0999[/C][C]0.460346[/C][/ROW]
[ROW][C]53[/C][C]-0.001538[/C][C]-0.0126[/C][C]0.494996[/C][/ROW]
[ROW][C]54[/C][C]-0.087198[/C][C]-0.7137[/C][C]0.238933[/C][/ROW]
[ROW][C]55[/C][C]-0.013177[/C][C]-0.1079[/C][C]0.457216[/C][/ROW]
[ROW][C]56[/C][C]-0.010968[/C][C]-0.0898[/C][C]0.464367[/C][/ROW]
[ROW][C]57[/C][C]-0.046261[/C][C]-0.3787[/C][C]0.353067[/C][/ROW]
[ROW][C]58[/C][C]0.00163[/C][C]0.0133[/C][C]0.494698[/C][/ROW]
[ROW][C]59[/C][C]0.039344[/C][C]0.322[/C][C]0.37421[/C][/ROW]
[ROW][C]60[/C][C]-0.043016[/C][C]-0.3521[/C][C]0.362935[/C][/ROW]
[/TABLE]
Source: https://freestatistics.org/blog/index.php?pk=31059&T=2

Globally Unique Identifier (entire table): ba.freestatistics.org/blog/index.php?pk=31059&T=2

As an alternative you can also use a QR Code:  

The GUIDs for individual cells are displayed in the table below:

Partial Autocorrelation Function
Time lag kPACF(k)T-STATP-value
10.3641672.98080.002002
2-0.19646-1.60810.056259
3-0.275148-2.25220.013796
4-0.308733-2.52710.006934
50.0711010.5820.281265
6-0.046161-0.37780.353371
7-0.155169-1.27010.104219
8-0.311396-2.54890.006552
9-0.037755-0.3090.379126
10-0.089178-0.730.233982
11-0.170146-1.39270.084157
120.1631321.33530.09315
13-0.265109-2.170.016778
140.2466272.01870.02376
150.0016720.01370.494561
160.0708380.57980.281987
17-0.147709-1.2090.115447
180.136551.11770.133841
190.1206680.98770.163424
20-0.045803-0.37490.354454
21-0.001418-0.01160.495386
22-0.075236-0.61580.270044
23-0.068611-0.56160.288129
24-0.068491-0.56060.288463
25-0.069175-0.56620.286566
26-0.091341-0.74770.228641
270.019570.16020.436609
28-0.059089-0.48370.315102
290.1063840.87080.193488
30-0.059693-0.48860.313358
31-0.113962-0.93280.177131
32-0.013569-0.11110.455949
33-0.060826-0.49790.310099
34-0.084764-0.69380.245095
350.0873590.71510.238527
360.0227880.18650.426298
37-0.042697-0.34950.363907
38-0.152421-1.24760.108256
390.0172830.14150.443963
400.0853770.69880.243536
41-0.054649-0.44730.328042
420.0046390.0380.484911
43-0.123077-1.00740.158676
44-0.07872-0.64430.260775
450.0167790.13730.445585
46-0.041143-0.33680.368672
47-0.117914-0.96520.168966
480.0970730.79460.214832
49-0.004474-0.03660.48545
500.0194290.1590.43706
510.0474970.38880.349336
520.0122090.09990.460346
53-0.001538-0.01260.494996
54-0.087198-0.71370.238933
55-0.013177-0.10790.457216
56-0.010968-0.08980.464367
57-0.046261-0.37870.353067
580.001630.01330.494698
590.0393440.3220.37421
60-0.043016-0.35210.362935


Parameters (Session):
par1 = 60 ; par2 = 2.0 ; par3 = 1 ; par4 = 1 ; par5 = 12 ;
Parameters (R input):
par1 = 60 ; par2 = 2.0 ; par3 = 1 ; par4 = 0 ; par5 = 12 ;
R code (references can be found in the software module):
if (par1 == 'Default') {
par1 = 10*log10(length(x))
} else {
par1 <- as.numeric(par1)
}
par2 <- as.numeric(par2)
par3 <- as.numeric(par3)
par4 <- as.numeric(par4)
par5 <- as.numeric(par5)
if (par2 == 0) {
x <- log(x)
} else {
x <- (x ^ par2 - 1) / par2
}
if (par3 > 0) x <- diff(x,lag=1,difference=par3)
if (par4 > 0) x <- diff(x,lag=par5,difference=par4)
bitmap(file='pic1.png')
racf <- acf(x,par1,main='Autocorrelation',xlab='lags',ylab='ACF')
dev.off()
bitmap(file='pic2.png')
rpacf <- pacf(x,par1,main='Partial Autocorrelation',xlab='lags',ylab='PACF')
dev.off()
(myacf <- c(racf$acf))
(mypacf <- c(rpacf$acf))
lengthx <- length(x)
sqrtn <- sqrt(lengthx)
load(file='createtable')
a<-table.start()
a<-table.row.start(a)
a<-table.element(a,'Autocorrelation Function',4,TRUE)
a<-table.row.end(a)
a<-table.row.start(a)
a<-table.element(a,'Time lag k',header=TRUE)
a<-table.element(a,hyperlink('basics.htm','ACF(k)','click here for more information about the Autocorrelation Function'),header=TRUE)
a<-table.element(a,'T-STAT',header=TRUE)
a<-table.element(a,'P-value',header=TRUE)
a<-table.row.end(a)
for (i in 2:(par1+1)) {
a<-table.row.start(a)
a<-table.element(a,i-1,header=TRUE)
a<-table.element(a,round(myacf[i],6))
mytstat <- myacf[i]*sqrtn
a<-table.element(a,round(mytstat,4))
a<-table.element(a,round(1-pt(abs(mytstat),lengthx),6))
a<-table.row.end(a)
}
a<-table.end(a)
table.save(a,file='mytable.tab')
a<-table.start()
a<-table.row.start(a)
a<-table.element(a,'Partial Autocorrelation Function',4,TRUE)
a<-table.row.end(a)
a<-table.row.start(a)
a<-table.element(a,'Time lag k',header=TRUE)
a<-table.element(a,hyperlink('basics.htm','PACF(k)','click here for more information about the Partial Autocorrelation Function'),header=TRUE)
a<-table.element(a,'T-STAT',header=TRUE)
a<-table.element(a,'P-value',header=TRUE)
a<-table.row.end(a)
for (i in 1:par1) {
a<-table.row.start(a)
a<-table.element(a,i,header=TRUE)
a<-table.element(a,round(mypacf[i],6))
mytstat <- mypacf[i]*sqrtn
a<-table.element(a,round(mytstat,4))
a<-table.element(a,round(1-pt(abs(mytstat),lengthx),6))
a<-table.row.end(a)
}
a<-table.end(a)
table.save(a,file='mytable1.tab')