Free Statistics

of Irreproducible Research!

Author's title

Author*The author of this computation has been verified*
R Software Modulerwasp_hierarchicalclustering.wasp
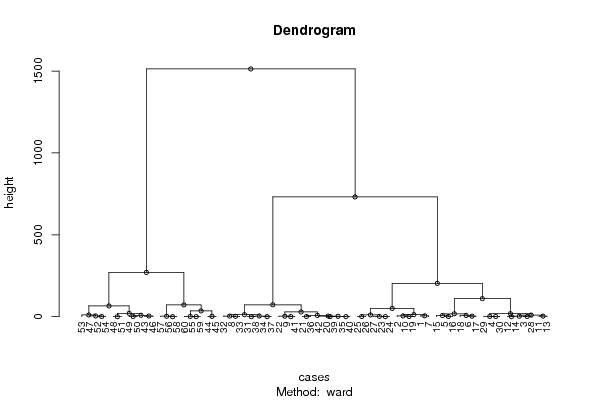
Title produced by softwareHierarchical Clustering
Date of computationMon, 08 Dec 2008 14:13:44 -0700
Cite this page as followsStatistical Computations at FreeStatistics.org, Office for Research Development and Education, URL https://freestatistics.org/blog/index.php?v=date/2008/Dec/08/t12287708545547vdnzy1v87nb.htm/, Retrieved Thu, 16 May 2024 09:46:53 +0000
Statistical Computations at FreeStatistics.org, Office for Research Development and Education, URL https://freestatistics.org/blog/index.php?pk=31037, Retrieved Thu, 16 May 2024 09:46:53 +0000
QR Codes:

Original text written by user:
IsPrivate?No (this computation is public)
User-defined keywords
Estimated Impact175
Family? (F = Feedback message, R = changed R code, M = changed R Module, P = changed Parameters, D = changed Data)
-     [Hierarchical Clustering] [paper] [2007-12-05 22:51:14] [8d3192ea84fef628e5e980e3df2ac42d]
-    D  [Hierarchical Clustering] [paper 1.12 Hierar...] [2008-12-05 10:19:00] [819b576fab25b35cfda70f80599828ec]
-           [Hierarchical Clustering] [paper 1.12 Hierar...] [2008-12-08 21:13:44] [2ae704d6b0222e84f58032588d68322b] [Current]
Feedback Forum

Post a new message
Dataseries X:
493.000
481.000
462.000
457.000
442.000
439.000
488.000
521.000
501.000
485.000
464.000
460.000
467.000
460.000
448.000
443.000
436.000
431.000
484.000
510.000
513.000
503.000
471.000
471.000
476.000
475.000
470.000
461.000
455.000
456.000
517.000
525.000
523.000
519.000
509.000
512.000
519.000
517.000
510.000
509.000
501.000
507.000
569.000
580.000
578.000
565.000
547.000
555.000
562.000
561.000
555.000
544.000
537.000
543.000
594.000
611.000
613.000
611.000
594.000
595.000


Summary of computational transaction
Raw Inputview raw input (R code)
Raw Outputview raw output of R engine
Computing time4 seconds
R Server'Herman Ole Andreas Wold' @ 193.190.124.10:1001

\begin{tabular}{lllllllll}
\hline
Summary of computational transaction \tabularnewline
Raw Input & view raw input (R code)  \tabularnewline
Raw Output & view raw output of R engine  \tabularnewline
Computing time & 4 seconds \tabularnewline
R Server & 'Herman Ole Andreas Wold' @ 193.190.124.10:1001 \tabularnewline
\hline
\end{tabular}
%Source: https://freestatistics.org/blog/index.php?pk=31037&T=0

[TABLE]
[ROW][C]Summary of computational transaction[/C][/ROW]
[ROW][C]Raw Input[/C][C]view raw input (R code) [/C][/ROW]
[ROW][C]Raw Output[/C][C]view raw output of R engine [/C][/ROW]
[ROW][C]Computing time[/C][C]4 seconds[/C][/ROW]
[ROW][C]R Server[/C][C]'Herman Ole Andreas Wold' @ 193.190.124.10:1001[/C][/ROW]
[/TABLE]
Source: https://freestatistics.org/blog/index.php?pk=31037&T=0

Globally Unique Identifier (entire table): ba.freestatistics.org/blog/index.php?pk=31037&T=0

As an alternative you can also use a QR Code:  

The GUIDs for individual cells are displayed in the table below:

Summary of computational transaction
Raw Inputview raw input (R code)
Raw Outputview raw output of R engine
Computing time4 seconds
R Server'Herman Ole Andreas Wold' @ 193.190.124.10:1001


Summary of Dendrogram
LabelHeight
10
20
30
40
50
60
70
80
90
100
111
121
131
141
151
161
171
181
191.33333333333333
201.33333333333333
211.66666666666667
222
232
242
252.5
262.66666666666667
272.66666666666667
283
293
303.33333333333333
313.6
324
334
344.33333333333333
354.33333333333333
365
377
387.66666666666667
397.68571428571429
408.5
419.5
4210.1666666666667
4310.4666666666667
4412.0666666666667
4512.3809523809524
4617.6666666666667
4718.2222222222222
4820.1666666666667
4928.8476190476190
5035.0666666666667
5150.4
5265.6333333333333
5371.9333333333333
5472.4857142857143
55110.244444444444
56203.253333333333
57270.2
58731.441904761905
591513.27142857143

\begin{tabular}{lllllllll}
\hline
Summary of Dendrogram \tabularnewline
Label & Height \tabularnewline
1 & 0 \tabularnewline
2 & 0 \tabularnewline
3 & 0 \tabularnewline
4 & 0 \tabularnewline
5 & 0 \tabularnewline
6 & 0 \tabularnewline
7 & 0 \tabularnewline
8 & 0 \tabularnewline
9 & 0 \tabularnewline
10 & 0 \tabularnewline
11 & 1 \tabularnewline
12 & 1 \tabularnewline
13 & 1 \tabularnewline
14 & 1 \tabularnewline
15 & 1 \tabularnewline
16 & 1 \tabularnewline
17 & 1 \tabularnewline
18 & 1 \tabularnewline
19 & 1.33333333333333 \tabularnewline
20 & 1.33333333333333 \tabularnewline
21 & 1.66666666666667 \tabularnewline
22 & 2 \tabularnewline
23 & 2 \tabularnewline
24 & 2 \tabularnewline
25 & 2.5 \tabularnewline
26 & 2.66666666666667 \tabularnewline
27 & 2.66666666666667 \tabularnewline
28 & 3 \tabularnewline
29 & 3 \tabularnewline
30 & 3.33333333333333 \tabularnewline
31 & 3.6 \tabularnewline
32 & 4 \tabularnewline
33 & 4 \tabularnewline
34 & 4.33333333333333 \tabularnewline
35 & 4.33333333333333 \tabularnewline
36 & 5 \tabularnewline
37 & 7 \tabularnewline
38 & 7.66666666666667 \tabularnewline
39 & 7.68571428571429 \tabularnewline
40 & 8.5 \tabularnewline
41 & 9.5 \tabularnewline
42 & 10.1666666666667 \tabularnewline
43 & 10.4666666666667 \tabularnewline
44 & 12.0666666666667 \tabularnewline
45 & 12.3809523809524 \tabularnewline
46 & 17.6666666666667 \tabularnewline
47 & 18.2222222222222 \tabularnewline
48 & 20.1666666666667 \tabularnewline
49 & 28.8476190476190 \tabularnewline
50 & 35.0666666666667 \tabularnewline
51 & 50.4 \tabularnewline
52 & 65.6333333333333 \tabularnewline
53 & 71.9333333333333 \tabularnewline
54 & 72.4857142857143 \tabularnewline
55 & 110.244444444444 \tabularnewline
56 & 203.253333333333 \tabularnewline
57 & 270.2 \tabularnewline
58 & 731.441904761905 \tabularnewline
59 & 1513.27142857143 \tabularnewline
\hline
\end{tabular}
%Source: https://freestatistics.org/blog/index.php?pk=31037&T=1

[TABLE]
[ROW][C]Summary of Dendrogram[/C][/ROW]
[ROW][C]Label[/C][C]Height[/C][/ROW]
[ROW][C]1[/C][C]0[/C][/ROW]
[ROW][C]2[/C][C]0[/C][/ROW]
[ROW][C]3[/C][C]0[/C][/ROW]
[ROW][C]4[/C][C]0[/C][/ROW]
[ROW][C]5[/C][C]0[/C][/ROW]
[ROW][C]6[/C][C]0[/C][/ROW]
[ROW][C]7[/C][C]0[/C][/ROW]
[ROW][C]8[/C][C]0[/C][/ROW]
[ROW][C]9[/C][C]0[/C][/ROW]
[ROW][C]10[/C][C]0[/C][/ROW]
[ROW][C]11[/C][C]1[/C][/ROW]
[ROW][C]12[/C][C]1[/C][/ROW]
[ROW][C]13[/C][C]1[/C][/ROW]
[ROW][C]14[/C][C]1[/C][/ROW]
[ROW][C]15[/C][C]1[/C][/ROW]
[ROW][C]16[/C][C]1[/C][/ROW]
[ROW][C]17[/C][C]1[/C][/ROW]
[ROW][C]18[/C][C]1[/C][/ROW]
[ROW][C]19[/C][C]1.33333333333333[/C][/ROW]
[ROW][C]20[/C][C]1.33333333333333[/C][/ROW]
[ROW][C]21[/C][C]1.66666666666667[/C][/ROW]
[ROW][C]22[/C][C]2[/C][/ROW]
[ROW][C]23[/C][C]2[/C][/ROW]
[ROW][C]24[/C][C]2[/C][/ROW]
[ROW][C]25[/C][C]2.5[/C][/ROW]
[ROW][C]26[/C][C]2.66666666666667[/C][/ROW]
[ROW][C]27[/C][C]2.66666666666667[/C][/ROW]
[ROW][C]28[/C][C]3[/C][/ROW]
[ROW][C]29[/C][C]3[/C][/ROW]
[ROW][C]30[/C][C]3.33333333333333[/C][/ROW]
[ROW][C]31[/C][C]3.6[/C][/ROW]
[ROW][C]32[/C][C]4[/C][/ROW]
[ROW][C]33[/C][C]4[/C][/ROW]
[ROW][C]34[/C][C]4.33333333333333[/C][/ROW]
[ROW][C]35[/C][C]4.33333333333333[/C][/ROW]
[ROW][C]36[/C][C]5[/C][/ROW]
[ROW][C]37[/C][C]7[/C][/ROW]
[ROW][C]38[/C][C]7.66666666666667[/C][/ROW]
[ROW][C]39[/C][C]7.68571428571429[/C][/ROW]
[ROW][C]40[/C][C]8.5[/C][/ROW]
[ROW][C]41[/C][C]9.5[/C][/ROW]
[ROW][C]42[/C][C]10.1666666666667[/C][/ROW]
[ROW][C]43[/C][C]10.4666666666667[/C][/ROW]
[ROW][C]44[/C][C]12.0666666666667[/C][/ROW]
[ROW][C]45[/C][C]12.3809523809524[/C][/ROW]
[ROW][C]46[/C][C]17.6666666666667[/C][/ROW]
[ROW][C]47[/C][C]18.2222222222222[/C][/ROW]
[ROW][C]48[/C][C]20.1666666666667[/C][/ROW]
[ROW][C]49[/C][C]28.8476190476190[/C][/ROW]
[ROW][C]50[/C][C]35.0666666666667[/C][/ROW]
[ROW][C]51[/C][C]50.4[/C][/ROW]
[ROW][C]52[/C][C]65.6333333333333[/C][/ROW]
[ROW][C]53[/C][C]71.9333333333333[/C][/ROW]
[ROW][C]54[/C][C]72.4857142857143[/C][/ROW]
[ROW][C]55[/C][C]110.244444444444[/C][/ROW]
[ROW][C]56[/C][C]203.253333333333[/C][/ROW]
[ROW][C]57[/C][C]270.2[/C][/ROW]
[ROW][C]58[/C][C]731.441904761905[/C][/ROW]
[ROW][C]59[/C][C]1513.27142857143[/C][/ROW]
[/TABLE]
Source: https://freestatistics.org/blog/index.php?pk=31037&T=1

Globally Unique Identifier (entire table): ba.freestatistics.org/blog/index.php?pk=31037&T=1

As an alternative you can also use a QR Code:  

The GUIDs for individual cells are displayed in the table below:

Summary of Dendrogram
LabelHeight
10
20
30
40
50
60
70
80
90
100
111
121
131
141
151
161
171
181
191.33333333333333
201.33333333333333
211.66666666666667
222
232
242
252.5
262.66666666666667
272.66666666666667
283
293
303.33333333333333
313.6
324
334
344.33333333333333
354.33333333333333
365
377
387.66666666666667
397.68571428571429
408.5
419.5
4210.1666666666667
4310.4666666666667
4412.0666666666667
4512.3809523809524
4617.6666666666667
4718.2222222222222
4820.1666666666667
4928.8476190476190
5035.0666666666667
5150.4
5265.6333333333333
5371.9333333333333
5472.4857142857143
55110.244444444444
56203.253333333333
57270.2
58731.441904761905
591513.27142857143


Parameters (Session):
par1 = ward ; par2 = ALL ; par3 = FALSE ; par4 = FALSE ;
Parameters (R input):
par1 = ward ; par2 = ALL ; par3 = FALSE ; par4 = FALSE ;
R code (references can be found in the software module):
par3 <- as.logical(par3)
par4 <- as.logical(par4)
if (par3 == 'TRUE'){
dum = xlab
xlab = ylab
ylab = dum
}
x <- t(y)
hc <- hclust(dist(x),method=par1)
d <- as.dendrogram(hc)
str(d)
mysub <- paste('Method: ',par1)
bitmap(file='test1.png')
if (par4 == 'TRUE'){
plot(d,main=main,ylab=ylab,xlab=xlab,horiz=par3, nodePar=list(pch = c(1,NA), cex=0.8, lab.cex = 0.8),type='t',center=T, sub=mysub)
} else {
plot(d,main=main,ylab=ylab,xlab=xlab,horiz=par3, nodePar=list(pch = c(1,NA), cex=0.8, lab.cex = 0.8), sub=mysub)
}
dev.off()
if (par2 != 'ALL'){
if (par3 == 'TRUE'){
ylab = 'cluster'
} else {
xlab = 'cluster'
}
par2 <- as.numeric(par2)
memb <- cutree(hc, k = par2)
cent <- NULL
for(k in 1:par2){
cent <- rbind(cent, colMeans(x[memb == k, , drop = FALSE]))
}
hc1 <- hclust(dist(cent),method=par1, members = table(memb))
de <- as.dendrogram(hc1)
bitmap(file='test2.png')
if (par4 == 'TRUE'){
plot(de,main=main,ylab=ylab,xlab=xlab,horiz=par3, nodePar=list(pch = c(1,NA), cex=0.8, lab.cex = 0.8),type='t',center=T, sub=mysub)
} else {
plot(de,main=main,ylab=ylab,xlab=xlab,horiz=par3, nodePar=list(pch = c(1,NA), cex=0.8, lab.cex = 0.8), sub=mysub)
}
dev.off()
str(de)
}
load(file='createtable')
a<-table.start()
a<-table.row.start(a)
a<-table.element(a,'Summary of Dendrogram',2,TRUE)
a<-table.row.end(a)
a<-table.row.start(a)
a<-table.element(a,'Label',header=TRUE)
a<-table.element(a,'Height',header=TRUE)
a<-table.row.end(a)
num <- length(x[,1])-1
for (i in 1:num)
{
a<-table.row.start(a)
a<-table.element(a,hc$labels[i])
a<-table.element(a,hc$height[i])
a<-table.row.end(a)
}
a<-table.end(a)
table.save(a,file='mytable1.tab')
if (par2 != 'ALL'){
a<-table.start()
a<-table.row.start(a)
a<-table.element(a,'Summary of Cut Dendrogram',2,TRUE)
a<-table.row.end(a)
a<-table.row.start(a)
a<-table.element(a,'Label',header=TRUE)
a<-table.element(a,'Height',header=TRUE)
a<-table.row.end(a)
num <- par2-1
for (i in 1:num)
{
a<-table.row.start(a)
a<-table.element(a,i)
a<-table.element(a,hc1$height[i])
a<-table.row.end(a)
}
a<-table.end(a)
table.save(a,file='mytable2.tab')
}