Free Statistics

of Irreproducible Research!

Author's title

Author*The author of this computation has been verified*
R Software Modulerwasp_arimabackwardselection.wasp
Title produced by softwareARIMA Backward Selection
Date of computationMon, 08 Dec 2008 14:03:53 -0700
Cite this page as followsStatistical Computations at FreeStatistics.org, Office for Research Development and Education, URL https://freestatistics.org/blog/index.php?v=date/2008/Dec/08/t1228770328161wls1hk3bv183.htm/, Retrieved Thu, 16 May 2024 12:53:27 +0000
Statistical Computations at FreeStatistics.org, Office for Research Development and Education, URL https://freestatistics.org/blog/index.php?pk=31018, Retrieved Thu, 16 May 2024 12:53:27 +0000
QR Codes:

Original text written by user:
IsPrivate?No (this computation is public)
User-defined keywords
Estimated Impact201
Family? (F = Feedback message, R = changed R code, M = changed R Module, P = changed Parameters, D = changed Data)
-     [Spectral Analysis] [Unemployment - St...] [2008-12-08 17:28:52] [57850c80fd59ccfb28f882be994e814e]
F RMP   [ARIMA Backward Selection] [Unemployment - St...] [2008-12-08 18:25:12] [57850c80fd59ccfb28f882be994e814e]
F           [ARIMA Backward Selection] [Step 5] [2008-12-08 21:03:53] [14a75ec03b2c0d8ddd8b141a7b1594fd] [Current]
F   PD        [ARIMA Backward Selection] [step 5] [2008-12-08 22:38:06] [cf9c64468d04c2c4dd548cc66b4e3677]
F   P           [ARIMA Backward Selection] [Step 5] [2008-12-08 23:15:27] [6816386b1f3c2f6c0c9f2aa1e5bc9362]
-                 [ARIMA Backward Selection] [step 5] [2008-12-08 23:45:15] [73d6180dc45497329efd1b6934a84aba]
F                 [ARIMA Backward Selection] [] [2008-12-09 00:23:28] [74be16979710d4c4e7c6647856088456]
-   P           [ARIMA Backward Selection] [Verbetering works...] [2008-12-15 10:37:49] [cf9c64468d04c2c4dd548cc66b4e3677]
-             [ARIMA Backward Selection] [] [2008-12-09 00:36:31] [74be16979710d4c4e7c6647856088456]
-    D        [ARIMA Backward Selection] [verbetering step 5] [2008-12-14 18:23:12] [73d6180dc45497329efd1b6934a84aba]
-               [ARIMA Backward Selection] [Verbetering step 5] [2008-12-15 02:54:59] [6816386b1f3c2f6c0c9f2aa1e5bc9362]
Feedback Forum
2008-12-15 00:00:43 [Gregory Van Overmeiren] [reply
Hier ben ik de mist in gegaan=> heb niet alle waarden op maximum gezet… de parameters moesten dus als volgt zijn:
 Lambda = 0,5
 d = 1
 D = 1
 Seiz. = 12
 Max p = 3
 Max q = 1
 Max P = 2
 Max Q = 1

Ik bekom nu dit http://www.freestatistics.org/blog/index.php?v=date/2008/Dec/14/t1229279062efkeldufa9m318o.htm


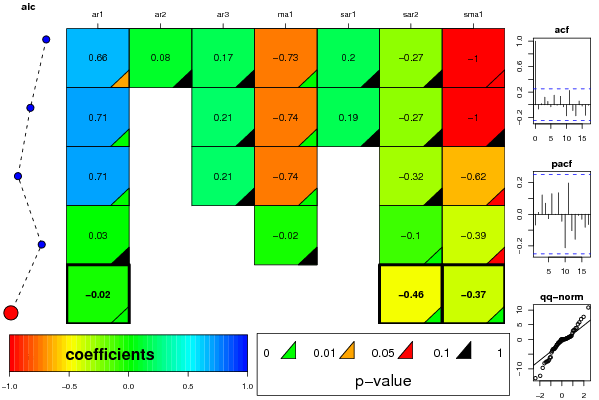
We zien in elk vierkantje rechtsonder een klein driehoekje zitten.
Deze driehoekjes kunnen 4 verschillende kleuren hebben.
-Groen: P-waarde = 0
-Bruin: P-waarde =tussen 0,01 / 0,05
-Rood: P-waarde = tussen 0,05 / 0,1
-Zwart: P-waarde = tussen 0,1 / 1


=> In de eerste rij zie je dat AR 3 niet significant is, daar het driehoekje zwart is gekleurd.


In de 2e rij krijgen we een AR 2 proces! We merken nu wel op dat er twee driehoekjes zijn bijgekomen die zwart kleuren. Sar 1 en Sar 2.
=>We moeten deze nu ook elimineren.


In de 3e rij heeft de computer Sar 2 weggelaten omdat deze de hoogste waarde van de twee had. We zien dat Sar 1 nog steeds een zwart driehoekje bevat.

In de 4e rij kunnen we zien om welk model het hier gaat. Je kan dit simpelweg aflezen. In dit geval gaat het over een AR2 , MA1 en SMA1 Proces.

Post a new message
Dataseries X:
569323
579714
577992
565464
547344
554788
562325
560854
555332
543599
536662
542722
593530
610763
612613
611324
594167
595454
590865
589379
584428
573100
567456
569028
620735
628884
628232
612117
595404
597141
593408
590072
579799
574205
572775
572942
619567
625809
619916
587625
565742
557274
560576
548854
531673
525919
511038
498662
555362
564591
541657
527070
509846
514258
516922
507561
492622
490243
469357
477580
528379


Summary of computational transaction
Raw Inputview raw input (R code)
Raw Outputview raw output of R engine
Computing time15 seconds
R Server'Sir Ronald Aylmer Fisher' @ 193.190.124.24

\begin{tabular}{lllllllll}
\hline
Summary of computational transaction \tabularnewline
Raw Input & view raw input (R code)  \tabularnewline
Raw Output & view raw output of R engine  \tabularnewline
Computing time & 15 seconds \tabularnewline
R Server & 'Sir Ronald Aylmer Fisher' @ 193.190.124.24 \tabularnewline
\hline
\end{tabular}
%Source: https://freestatistics.org/blog/index.php?pk=31018&T=0

[TABLE]
[ROW][C]Summary of computational transaction[/C][/ROW]
[ROW][C]Raw Input[/C][C]view raw input (R code) [/C][/ROW]
[ROW][C]Raw Output[/C][C]view raw output of R engine [/C][/ROW]
[ROW][C]Computing time[/C][C]15 seconds[/C][/ROW]
[ROW][C]R Server[/C][C]'Sir Ronald Aylmer Fisher' @ 193.190.124.24[/C][/ROW]
[/TABLE]
Source: https://freestatistics.org/blog/index.php?pk=31018&T=0

Globally Unique Identifier (entire table): ba.freestatistics.org/blog/index.php?pk=31018&T=0

As an alternative you can also use a QR Code:  

The GUIDs for individual cells are displayed in the table below:

Summary of computational transaction
Raw Inputview raw input (R code)
Raw Outputview raw output of R engine
Computing time15 seconds
R Server'Sir Ronald Aylmer Fisher' @ 193.190.124.24


ARIMA Parameter Estimation and Backward Selection
Iterationar1ar2ar3ma1sar1sar2sma1
Estimates ( 1 )0.66120.08160.1695-0.73250.198-0.2723-0.9996
(p-val)(0.0187 )(0.643 )(0.3393 )(0.0022 )(0.3668 )(0.2474 )(0.0917 )
Estimates ( 2 )0.705900.2084-0.73940.1895-0.2681-0.9989
(p-val)(0.0085 )(NA )(0.1708 )(0.0015 )(0.3851 )(0.2566 )(0.1018 )
Estimates ( 3 )0.709400.2094-0.74210-0.315-0.6249
(p-val)(0.0027 )(NA )(0.1768 )(4e-04 )(NA )(0.1341 )(0.085 )
Estimates ( 4 )0.031700-0.02050-0.0977-0.3927
(p-val)(0.1006 )(NA )(NA )(0.9171 )(NA )(0 )(0.0666 )
Estimates ( 5 )-0.01610000-0.4605-0.3676
(p-val)(0 )(NA )(NA )(NA )(NA )(0 )(0.0013 )
Estimates ( 6 )NANANANANANANA
(p-val)(NA )(NA )(NA )(NA )(NA )(NA )(NA )
Estimates ( 7 )NANANANANANANA
(p-val)(NA )(NA )(NA )(NA )(NA )(NA )(NA )
Estimates ( 8 )NANANANANANANA
(p-val)(NA )(NA )(NA )(NA )(NA )(NA )(NA )
Estimates ( 9 )NANANANANANANA
(p-val)(NA )(NA )(NA )(NA )(NA )(NA )(NA )
Estimates ( 10 )NANANANANANANA
(p-val)(NA )(NA )(NA )(NA )(NA )(NA )(NA )
Estimates ( 11 )NANANANANANANA
(p-val)(NA )(NA )(NA )(NA )(NA )(NA )(NA )
Estimates ( 12 )NANANANANANANA
(p-val)(NA )(NA )(NA )(NA )(NA )(NA )(NA )
Estimates ( 13 )NANANANANANANA
(p-val)(NA )(NA )(NA )(NA )(NA )(NA )(NA )

\begin{tabular}{lllllllll}
\hline
ARIMA Parameter Estimation and Backward Selection \tabularnewline
Iteration & ar1 & ar2 & ar3 & ma1 & sar1 & sar2 & sma1 \tabularnewline
Estimates ( 1 ) & 0.6612 & 0.0816 & 0.1695 & -0.7325 & 0.198 & -0.2723 & -0.9996 \tabularnewline
(p-val) & (0.0187 ) & (0.643 ) & (0.3393 ) & (0.0022 ) & (0.3668 ) & (0.2474 ) & (0.0917 ) \tabularnewline
Estimates ( 2 ) & 0.7059 & 0 & 0.2084 & -0.7394 & 0.1895 & -0.2681 & -0.9989 \tabularnewline
(p-val) & (0.0085 ) & (NA ) & (0.1708 ) & (0.0015 ) & (0.3851 ) & (0.2566 ) & (0.1018 ) \tabularnewline
Estimates ( 3 ) & 0.7094 & 0 & 0.2094 & -0.7421 & 0 & -0.315 & -0.6249 \tabularnewline
(p-val) & (0.0027 ) & (NA ) & (0.1768 ) & (4e-04 ) & (NA ) & (0.1341 ) & (0.085 ) \tabularnewline
Estimates ( 4 ) & 0.0317 & 0 & 0 & -0.0205 & 0 & -0.0977 & -0.3927 \tabularnewline
(p-val) & (0.1006 ) & (NA ) & (NA ) & (0.9171 ) & (NA ) & (0 ) & (0.0666 ) \tabularnewline
Estimates ( 5 ) & -0.0161 & 0 & 0 & 0 & 0 & -0.4605 & -0.3676 \tabularnewline
(p-val) & (0 ) & (NA ) & (NA ) & (NA ) & (NA ) & (0 ) & (0.0013 ) \tabularnewline
Estimates ( 6 ) & NA & NA & NA & NA & NA & NA & NA \tabularnewline
(p-val) & (NA ) & (NA ) & (NA ) & (NA ) & (NA ) & (NA ) & (NA ) \tabularnewline
Estimates ( 7 ) & NA & NA & NA & NA & NA & NA & NA \tabularnewline
(p-val) & (NA ) & (NA ) & (NA ) & (NA ) & (NA ) & (NA ) & (NA ) \tabularnewline
Estimates ( 8 ) & NA & NA & NA & NA & NA & NA & NA \tabularnewline
(p-val) & (NA ) & (NA ) & (NA ) & (NA ) & (NA ) & (NA ) & (NA ) \tabularnewline
Estimates ( 9 ) & NA & NA & NA & NA & NA & NA & NA \tabularnewline
(p-val) & (NA ) & (NA ) & (NA ) & (NA ) & (NA ) & (NA ) & (NA ) \tabularnewline
Estimates ( 10 ) & NA & NA & NA & NA & NA & NA & NA \tabularnewline
(p-val) & (NA ) & (NA ) & (NA ) & (NA ) & (NA ) & (NA ) & (NA ) \tabularnewline
Estimates ( 11 ) & NA & NA & NA & NA & NA & NA & NA \tabularnewline
(p-val) & (NA ) & (NA ) & (NA ) & (NA ) & (NA ) & (NA ) & (NA ) \tabularnewline
Estimates ( 12 ) & NA & NA & NA & NA & NA & NA & NA \tabularnewline
(p-val) & (NA ) & (NA ) & (NA ) & (NA ) & (NA ) & (NA ) & (NA ) \tabularnewline
Estimates ( 13 ) & NA & NA & NA & NA & NA & NA & NA \tabularnewline
(p-val) & (NA ) & (NA ) & (NA ) & (NA ) & (NA ) & (NA ) & (NA ) \tabularnewline
\hline
\end{tabular}
%Source: https://freestatistics.org/blog/index.php?pk=31018&T=1

[TABLE]
[ROW][C]ARIMA Parameter Estimation and Backward Selection[/C][/ROW]
[ROW][C]Iteration[/C][C]ar1[/C][C]ar2[/C][C]ar3[/C][C]ma1[/C][C]sar1[/C][C]sar2[/C][C]sma1[/C][/ROW]
[ROW][C]Estimates ( 1 )[/C][C]0.6612[/C][C]0.0816[/C][C]0.1695[/C][C]-0.7325[/C][C]0.198[/C][C]-0.2723[/C][C]-0.9996[/C][/ROW]
[ROW][C](p-val)[/C][C](0.0187 )[/C][C](0.643 )[/C][C](0.3393 )[/C][C](0.0022 )[/C][C](0.3668 )[/C][C](0.2474 )[/C][C](0.0917 )[/C][/ROW]
[ROW][C]Estimates ( 2 )[/C][C]0.7059[/C][C]0[/C][C]0.2084[/C][C]-0.7394[/C][C]0.1895[/C][C]-0.2681[/C][C]-0.9989[/C][/ROW]
[ROW][C](p-val)[/C][C](0.0085 )[/C][C](NA )[/C][C](0.1708 )[/C][C](0.0015 )[/C][C](0.3851 )[/C][C](0.2566 )[/C][C](0.1018 )[/C][/ROW]
[ROW][C]Estimates ( 3 )[/C][C]0.7094[/C][C]0[/C][C]0.2094[/C][C]-0.7421[/C][C]0[/C][C]-0.315[/C][C]-0.6249[/C][/ROW]
[ROW][C](p-val)[/C][C](0.0027 )[/C][C](NA )[/C][C](0.1768 )[/C][C](4e-04 )[/C][C](NA )[/C][C](0.1341 )[/C][C](0.085 )[/C][/ROW]
[ROW][C]Estimates ( 4 )[/C][C]0.0317[/C][C]0[/C][C]0[/C][C]-0.0205[/C][C]0[/C][C]-0.0977[/C][C]-0.3927[/C][/ROW]
[ROW][C](p-val)[/C][C](0.1006 )[/C][C](NA )[/C][C](NA )[/C][C](0.9171 )[/C][C](NA )[/C][C](0 )[/C][C](0.0666 )[/C][/ROW]
[ROW][C]Estimates ( 5 )[/C][C]-0.0161[/C][C]0[/C][C]0[/C][C]0[/C][C]0[/C][C]-0.4605[/C][C]-0.3676[/C][/ROW]
[ROW][C](p-val)[/C][C](0 )[/C][C](NA )[/C][C](NA )[/C][C](NA )[/C][C](NA )[/C][C](0 )[/C][C](0.0013 )[/C][/ROW]
[ROW][C]Estimates ( 6 )[/C][C]NA[/C][C]NA[/C][C]NA[/C][C]NA[/C][C]NA[/C][C]NA[/C][C]NA[/C][/ROW]
[ROW][C](p-val)[/C][C](NA )[/C][C](NA )[/C][C](NA )[/C][C](NA )[/C][C](NA )[/C][C](NA )[/C][C](NA )[/C][/ROW]
[ROW][C]Estimates ( 7 )[/C][C]NA[/C][C]NA[/C][C]NA[/C][C]NA[/C][C]NA[/C][C]NA[/C][C]NA[/C][/ROW]
[ROW][C](p-val)[/C][C](NA )[/C][C](NA )[/C][C](NA )[/C][C](NA )[/C][C](NA )[/C][C](NA )[/C][C](NA )[/C][/ROW]
[ROW][C]Estimates ( 8 )[/C][C]NA[/C][C]NA[/C][C]NA[/C][C]NA[/C][C]NA[/C][C]NA[/C][C]NA[/C][/ROW]
[ROW][C](p-val)[/C][C](NA )[/C][C](NA )[/C][C](NA )[/C][C](NA )[/C][C](NA )[/C][C](NA )[/C][C](NA )[/C][/ROW]
[ROW][C]Estimates ( 9 )[/C][C]NA[/C][C]NA[/C][C]NA[/C][C]NA[/C][C]NA[/C][C]NA[/C][C]NA[/C][/ROW]
[ROW][C](p-val)[/C][C](NA )[/C][C](NA )[/C][C](NA )[/C][C](NA )[/C][C](NA )[/C][C](NA )[/C][C](NA )[/C][/ROW]
[ROW][C]Estimates ( 10 )[/C][C]NA[/C][C]NA[/C][C]NA[/C][C]NA[/C][C]NA[/C][C]NA[/C][C]NA[/C][/ROW]
[ROW][C](p-val)[/C][C](NA )[/C][C](NA )[/C][C](NA )[/C][C](NA )[/C][C](NA )[/C][C](NA )[/C][C](NA )[/C][/ROW]
[ROW][C]Estimates ( 11 )[/C][C]NA[/C][C]NA[/C][C]NA[/C][C]NA[/C][C]NA[/C][C]NA[/C][C]NA[/C][/ROW]
[ROW][C](p-val)[/C][C](NA )[/C][C](NA )[/C][C](NA )[/C][C](NA )[/C][C](NA )[/C][C](NA )[/C][C](NA )[/C][/ROW]
[ROW][C]Estimates ( 12 )[/C][C]NA[/C][C]NA[/C][C]NA[/C][C]NA[/C][C]NA[/C][C]NA[/C][C]NA[/C][/ROW]
[ROW][C](p-val)[/C][C](NA )[/C][C](NA )[/C][C](NA )[/C][C](NA )[/C][C](NA )[/C][C](NA )[/C][C](NA )[/C][/ROW]
[ROW][C]Estimates ( 13 )[/C][C]NA[/C][C]NA[/C][C]NA[/C][C]NA[/C][C]NA[/C][C]NA[/C][C]NA[/C][/ROW]
[ROW][C](p-val)[/C][C](NA )[/C][C](NA )[/C][C](NA )[/C][C](NA )[/C][C](NA )[/C][C](NA )[/C][C](NA )[/C][/ROW]
[/TABLE]
Source: https://freestatistics.org/blog/index.php?pk=31018&T=1

Globally Unique Identifier (entire table): ba.freestatistics.org/blog/index.php?pk=31018&T=1

As an alternative you can also use a QR Code:  

The GUIDs for individual cells are displayed in the table below:

ARIMA Parameter Estimation and Backward Selection
Iterationar1ar2ar3ma1sar1sar2sma1
Estimates ( 1 )0.66120.08160.1695-0.73250.198-0.2723-0.9996
(p-val)(0.0187 )(0.643 )(0.3393 )(0.0022 )(0.3668 )(0.2474 )(0.0917 )
Estimates ( 2 )0.705900.2084-0.73940.1895-0.2681-0.9989
(p-val)(0.0085 )(NA )(0.1708 )(0.0015 )(0.3851 )(0.2566 )(0.1018 )
Estimates ( 3 )0.709400.2094-0.74210-0.315-0.6249
(p-val)(0.0027 )(NA )(0.1768 )(4e-04 )(NA )(0.1341 )(0.085 )
Estimates ( 4 )0.031700-0.02050-0.0977-0.3927
(p-val)(0.1006 )(NA )(NA )(0.9171 )(NA )(0 )(0.0666 )
Estimates ( 5 )-0.01610000-0.4605-0.3676
(p-val)(0 )(NA )(NA )(NA )(NA )(0 )(0.0013 )
Estimates ( 6 )NANANANANANANA
(p-val)(NA )(NA )(NA )(NA )(NA )(NA )(NA )
Estimates ( 7 )NANANANANANANA
(p-val)(NA )(NA )(NA )(NA )(NA )(NA )(NA )
Estimates ( 8 )NANANANANANANA
(p-val)(NA )(NA )(NA )(NA )(NA )(NA )(NA )
Estimates ( 9 )NANANANANANANA
(p-val)(NA )(NA )(NA )(NA )(NA )(NA )(NA )
Estimates ( 10 )NANANANANANANA
(p-val)(NA )(NA )(NA )(NA )(NA )(NA )(NA )
Estimates ( 11 )NANANANANANANA
(p-val)(NA )(NA )(NA )(NA )(NA )(NA )(NA )
Estimates ( 12 )NANANANANANANA
(p-val)(NA )(NA )(NA )(NA )(NA )(NA )(NA )
Estimates ( 13 )NANANANANANANA
(p-val)(NA )(NA )(NA )(NA )(NA )(NA )(NA )


Estimated ARIMA Residuals
Value
-2.54559220444530
3.93612978041446
2.09931533304134
6.88535003705783
0.937028490982262
-3.88637688567597
-7.39014853852947
0.0944710418951738
0.429334568098386
0.426990876356488
0.902183176259358
-2.86809375305491
-0.130657532617223
-4.44235743927691
-0.7677241765272
-6.93775237401534
0.6907862815295
-0.949215429388749
-1.80786326996833
-1.14476574242982
-3.23879743152898
3.83067893393431
2.96191390458941
-1.85102020532775
-3.26833259217514
-2.45983844073095
-3.37226753511391
-12.3808050616273
-3.15947188270855
-7.47185184213447
3.22159948549944
-6.151427455063
-6.07416339861362
1.28427125014934
-8.12466980644917
-9.682138973848
7.67510684951314
0.570461357000769
-13.1753888576797
5.17122125975641
1.13348679923881
5.8065115825974
0.862403613162026
-1.19063361431743
-1.6027875707032
3.11824815675727
-7.67203785173345
10.8497492906862
-0.726109121395147

\begin{tabular}{lllllllll}
\hline
Estimated ARIMA Residuals \tabularnewline
Value \tabularnewline
-2.54559220444530 \tabularnewline
3.93612978041446 \tabularnewline
2.09931533304134 \tabularnewline
6.88535003705783 \tabularnewline
0.937028490982262 \tabularnewline
-3.88637688567597 \tabularnewline
-7.39014853852947 \tabularnewline
0.0944710418951738 \tabularnewline
0.429334568098386 \tabularnewline
0.426990876356488 \tabularnewline
0.902183176259358 \tabularnewline
-2.86809375305491 \tabularnewline
-0.130657532617223 \tabularnewline
-4.44235743927691 \tabularnewline
-0.7677241765272 \tabularnewline
-6.93775237401534 \tabularnewline
0.6907862815295 \tabularnewline
-0.949215429388749 \tabularnewline
-1.80786326996833 \tabularnewline
-1.14476574242982 \tabularnewline
-3.23879743152898 \tabularnewline
3.83067893393431 \tabularnewline
2.96191390458941 \tabularnewline
-1.85102020532775 \tabularnewline
-3.26833259217514 \tabularnewline
-2.45983844073095 \tabularnewline
-3.37226753511391 \tabularnewline
-12.3808050616273 \tabularnewline
-3.15947188270855 \tabularnewline
-7.47185184213447 \tabularnewline
3.22159948549944 \tabularnewline
-6.151427455063 \tabularnewline
-6.07416339861362 \tabularnewline
1.28427125014934 \tabularnewline
-8.12466980644917 \tabularnewline
-9.682138973848 \tabularnewline
7.67510684951314 \tabularnewline
0.570461357000769 \tabularnewline
-13.1753888576797 \tabularnewline
5.17122125975641 \tabularnewline
1.13348679923881 \tabularnewline
5.8065115825974 \tabularnewline
0.862403613162026 \tabularnewline
-1.19063361431743 \tabularnewline
-1.6027875707032 \tabularnewline
3.11824815675727 \tabularnewline
-7.67203785173345 \tabularnewline
10.8497492906862 \tabularnewline
-0.726109121395147 \tabularnewline
\hline
\end{tabular}
%Source: https://freestatistics.org/blog/index.php?pk=31018&T=2

[TABLE]
[ROW][C]Estimated ARIMA Residuals[/C][/ROW]
[ROW][C]Value[/C][/ROW]
[ROW][C]-2.54559220444530[/C][/ROW]
[ROW][C]3.93612978041446[/C][/ROW]
[ROW][C]2.09931533304134[/C][/ROW]
[ROW][C]6.88535003705783[/C][/ROW]
[ROW][C]0.937028490982262[/C][/ROW]
[ROW][C]-3.88637688567597[/C][/ROW]
[ROW][C]-7.39014853852947[/C][/ROW]
[ROW][C]0.0944710418951738[/C][/ROW]
[ROW][C]0.429334568098386[/C][/ROW]
[ROW][C]0.426990876356488[/C][/ROW]
[ROW][C]0.902183176259358[/C][/ROW]
[ROW][C]-2.86809375305491[/C][/ROW]
[ROW][C]-0.130657532617223[/C][/ROW]
[ROW][C]-4.44235743927691[/C][/ROW]
[ROW][C]-0.7677241765272[/C][/ROW]
[ROW][C]-6.93775237401534[/C][/ROW]
[ROW][C]0.6907862815295[/C][/ROW]
[ROW][C]-0.949215429388749[/C][/ROW]
[ROW][C]-1.80786326996833[/C][/ROW]
[ROW][C]-1.14476574242982[/C][/ROW]
[ROW][C]-3.23879743152898[/C][/ROW]
[ROW][C]3.83067893393431[/C][/ROW]
[ROW][C]2.96191390458941[/C][/ROW]
[ROW][C]-1.85102020532775[/C][/ROW]
[ROW][C]-3.26833259217514[/C][/ROW]
[ROW][C]-2.45983844073095[/C][/ROW]
[ROW][C]-3.37226753511391[/C][/ROW]
[ROW][C]-12.3808050616273[/C][/ROW]
[ROW][C]-3.15947188270855[/C][/ROW]
[ROW][C]-7.47185184213447[/C][/ROW]
[ROW][C]3.22159948549944[/C][/ROW]
[ROW][C]-6.151427455063[/C][/ROW]
[ROW][C]-6.07416339861362[/C][/ROW]
[ROW][C]1.28427125014934[/C][/ROW]
[ROW][C]-8.12466980644917[/C][/ROW]
[ROW][C]-9.682138973848[/C][/ROW]
[ROW][C]7.67510684951314[/C][/ROW]
[ROW][C]0.570461357000769[/C][/ROW]
[ROW][C]-13.1753888576797[/C][/ROW]
[ROW][C]5.17122125975641[/C][/ROW]
[ROW][C]1.13348679923881[/C][/ROW]
[ROW][C]5.8065115825974[/C][/ROW]
[ROW][C]0.862403613162026[/C][/ROW]
[ROW][C]-1.19063361431743[/C][/ROW]
[ROW][C]-1.6027875707032[/C][/ROW]
[ROW][C]3.11824815675727[/C][/ROW]
[ROW][C]-7.67203785173345[/C][/ROW]
[ROW][C]10.8497492906862[/C][/ROW]
[ROW][C]-0.726109121395147[/C][/ROW]
[/TABLE]
Source: https://freestatistics.org/blog/index.php?pk=31018&T=2

Globally Unique Identifier (entire table): ba.freestatistics.org/blog/index.php?pk=31018&T=2

As an alternative you can also use a QR Code:  

The GUIDs for individual cells are displayed in the table below:

Estimated ARIMA Residuals
Value
-2.54559220444530
3.93612978041446
2.09931533304134
6.88535003705783
0.937028490982262
-3.88637688567597
-7.39014853852947
0.0944710418951738
0.429334568098386
0.426990876356488
0.902183176259358
-2.86809375305491
-0.130657532617223
-4.44235743927691
-0.7677241765272
-6.93775237401534
0.6907862815295
-0.949215429388749
-1.80786326996833
-1.14476574242982
-3.23879743152898
3.83067893393431
2.96191390458941
-1.85102020532775
-3.26833259217514
-2.45983844073095
-3.37226753511391
-12.3808050616273
-3.15947188270855
-7.47185184213447
3.22159948549944
-6.151427455063
-6.07416339861362
1.28427125014934
-8.12466980644917
-9.682138973848
7.67510684951314
0.570461357000769
-13.1753888576797
5.17122125975641
1.13348679923881
5.8065115825974
0.862403613162026
-1.19063361431743
-1.6027875707032
3.11824815675727
-7.67203785173345
10.8497492906862
-0.726109121395147


Parameters (Session):
par1 = FALSE ; par2 = 0.5 ; par3 = 1 ; par4 = 1 ; par5 = 12 ; par6 = 3 ; par7 = 1 ; par8 = 2 ; par9 = 1 ;
Parameters (R input):
par1 = FALSE ; par2 = 0.5 ; par3 = 1 ; par4 = 1 ; par5 = 12 ; par6 = 3 ; par7 = 1 ; par8 = 2 ; par9 = 1 ;
R code (references can be found in the software module):
library(lattice)
if (par1 == 'TRUE') par1 <- TRUE
if (par1 == 'FALSE') par1 <- FALSE
par2 <- as.numeric(par2) #Box-Cox lambda transformation parameter
par3 <- as.numeric(par3) #degree of non-seasonal differencing
par4 <- as.numeric(par4) #degree of seasonal differencing
par5 <- as.numeric(par5) #seasonal period
par6 <- as.numeric(par6) #degree (p) of the non-seasonal AR(p) polynomial
par7 <- as.numeric(par7) #degree (q) of the non-seasonal MA(q) polynomial
par8 <- as.numeric(par8) #degree (P) of the seasonal AR(P) polynomial
par9 <- as.numeric(par9) #degree (Q) of the seasonal MA(Q) polynomial
armaGR <- function(arima.out, names, n){
try1 <- arima.out$coef
try2 <- sqrt(diag(arima.out$var.coef))
try.data.frame <- data.frame(matrix(NA,ncol=4,nrow=length(names)))
dimnames(try.data.frame) <- list(names,c('coef','std','tstat','pv'))
try.data.frame[,1] <- try1
for(i in 1:length(try2)) try.data.frame[which(rownames(try.data.frame)==names(try2)[i]),2] <- try2[i]
try.data.frame[,3] <- try.data.frame[,1] / try.data.frame[,2]
try.data.frame[,4] <- round((1-pt(abs(try.data.frame[,3]),df=n-(length(try2)+1)))*2,5)
vector <- rep(NA,length(names))
vector[is.na(try.data.frame[,4])] <- 0
maxi <- which.max(try.data.frame[,4])
continue <- max(try.data.frame[,4],na.rm=TRUE) > .05
vector[maxi] <- 0
list(summary=try.data.frame,next.vector=vector,continue=continue)
}
arimaSelect <- function(series, order=c(13,0,0), seasonal=list(order=c(2,0,0),period=12), include.mean=F){
nrc <- order[1]+order[3]+seasonal$order[1]+seasonal$order[3]
coeff <- matrix(NA, nrow=nrc*2, ncol=nrc)
pval <- matrix(NA, nrow=nrc*2, ncol=nrc)
mylist <- rep(list(NULL), nrc)
names <- NULL
if(order[1] > 0) names <- paste('ar',1:order[1],sep='')
if(order[3] > 0) names <- c( names , paste('ma',1:order[3],sep='') )
if(seasonal$order[1] > 0) names <- c(names, paste('sar',1:seasonal$order[1],sep=''))
if(seasonal$order[3] > 0) names <- c(names, paste('sma',1:seasonal$order[3],sep=''))
arima.out <- arima(series, order=order, seasonal=seasonal, include.mean=include.mean, method='ML')
mylist[[1]] <- arima.out
last.arma <- armaGR(arima.out, names, length(series))
mystop <- FALSE
i <- 1
coeff[i,] <- last.arma[[1]][,1]
pval [i,] <- last.arma[[1]][,4]
i <- 2
aic <- arima.out$aic
while(!mystop){
mylist[[i]] <- arima.out
arima.out <- arima(series, order=order, seasonal=seasonal, include.mean=include.mean, method='ML', fixed=last.arma$next.vector)
aic <- c(aic, arima.out$aic)
last.arma <- armaGR(arima.out, names, length(series))
mystop <- !last.arma$continue
coeff[i,] <- last.arma[[1]][,1]
pval [i,] <- last.arma[[1]][,4]
i <- i+1
}
list(coeff, pval, mylist, aic=aic)
}
arimaSelectplot <- function(arimaSelect.out,noms,choix){
noms <- names(arimaSelect.out[[3]][[1]]$coef)
coeff <- arimaSelect.out[[1]]
k <- min(which(is.na(coeff[,1])))-1
coeff <- coeff[1:k,]
pval <- arimaSelect.out[[2]][1:k,]
aic <- arimaSelect.out$aic[1:k]
coeff[coeff==0] <- NA
n <- ncol(coeff)
if(missing(choix)) choix <- k
layout(matrix(c(1,1,1,2,
3,3,3,2,
3,3,3,4,
5,6,7,7),nr=4),
widths=c(10,35,45,15),
heights=c(30,30,15,15))
couleurs <- rainbow(75)[1:50]#(50)
ticks <- pretty(coeff)
par(mar=c(1,1,3,1))
plot(aic,k:1-.5,type='o',pch=21,bg='blue',cex=2,axes=F,lty=2,xpd=NA)
points(aic[choix],k-choix+.5,pch=21,cex=4,bg=2,xpd=NA)
title('aic',line=2)
par(mar=c(3,0,0,0))
plot(0,axes=F,xlab='',ylab='',xlim=range(ticks),ylim=c(.1,1))
rect(xleft = min(ticks) + (0:49)/50*(max(ticks)-min(ticks)),
xright = min(ticks) + (1:50)/50*(max(ticks)-min(ticks)),
ytop = rep(1,50),
ybottom= rep(0,50),col=couleurs,border=NA)
axis(1,ticks)
rect(xleft=min(ticks),xright=max(ticks),ytop=1,ybottom=0)
text(mean(coeff,na.rm=T),.5,'coefficients',cex=2,font=2)
par(mar=c(1,1,3,1))
image(1:n,1:k,t(coeff[k:1,]),axes=F,col=couleurs,zlim=range(ticks))
for(i in 1:n) for(j in 1:k) if(!is.na(coeff[j,i])) {
if(pval[j,i]<.01) symb = 'green'
else if( (pval[j,i]<.05) & (pval[j,i]>=.01)) symb = 'orange'
else if( (pval[j,i]<.1) & (pval[j,i]>=.05)) symb = 'red'
else symb = 'black'
polygon(c(i+.5 ,i+.2 ,i+.5 ,i+.5),
c(k-j+0.5,k-j+0.5,k-j+0.8,k-j+0.5),
col=symb)
if(j==choix) {
rect(xleft=i-.5,
xright=i+.5,
ybottom=k-j+1.5,
ytop=k-j+.5,
lwd=4)
text(i,
k-j+1,
round(coeff[j,i],2),
cex=1.2,
font=2)
}
else{
rect(xleft=i-.5,xright=i+.5,ybottom=k-j+1.5,ytop=k-j+.5)
text(i,k-j+1,round(coeff[j,i],2),cex=1.2,font=1)
}
}
axis(3,1:n,noms)
par(mar=c(0.5,0,0,0.5))
plot(0,axes=F,xlab='',ylab='',type='n',xlim=c(0,8),ylim=c(-.2,.8))
cols <- c('green','orange','red','black')
niv <- c('0','0.01','0.05','0.1')
for(i in 0:3){
polygon(c(1+2*i ,1+2*i ,1+2*i-.5 ,1+2*i),
c(.4 ,.7 , .4 , .4),
col=cols[i+1])
text(2*i,0.5,niv[i+1],cex=1.5)
}
text(8,.5,1,cex=1.5)
text(4,0,'p-value',cex=2)
box()
residus <- arimaSelect.out[[3]][[choix]]$res
par(mar=c(1,2,4,1))
acf(residus,main='')
title('acf',line=.5)
par(mar=c(1,2,4,1))
pacf(residus,main='')
title('pacf',line=.5)
par(mar=c(2,2,4,1))
qqnorm(residus,main='')
title('qq-norm',line=.5)
qqline(residus)
residus
}
if (par2 == 0) x <- log(x)
if (par2 != 0) x <- x^par2
(selection <- arimaSelect(x, order=c(par6,par3,par7), seasonal=list(order=c(par8,par4,par9), period=par5)))
bitmap(file='test1.png')
resid <- arimaSelectplot(selection)
dev.off()
resid
bitmap(file='test2.png')
acf(resid,length(resid)/2, main='Residual Autocorrelation Function')
dev.off()
bitmap(file='test3.png')
pacf(resid,length(resid)/2, main='Residual Partial Autocorrelation Function')
dev.off()
bitmap(file='test4.png')
cpgram(resid, main='Residual Cumulative Periodogram')
dev.off()
bitmap(file='test5.png')
hist(resid, main='Residual Histogram', xlab='values of Residuals')
dev.off()
bitmap(file='test6.png')
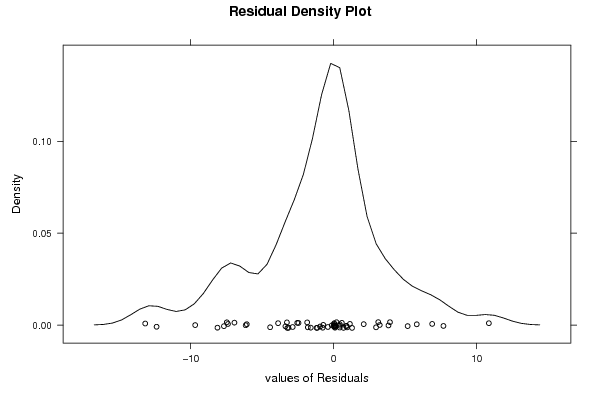
densityplot(~resid,col='black',main='Residual Density Plot', xlab='values of Residuals')
dev.off()
bitmap(file='test7.png')
qqnorm(resid, main='Residual Normal Q-Q Plot')
qqline(resid)
dev.off()
ncols <- length(selection[[1]][1,])
nrows <- length(selection[[2]][,1])-1
load(file='createtable')
a<-table.start()
a<-table.row.start(a)
a<-table.element(a,'ARIMA Parameter Estimation and Backward Selection', ncols+1,TRUE)
a<-table.row.end(a)
a<-table.row.start(a)
a<-table.element(a,'Iteration', header=TRUE)
for (i in 1:ncols) {
a<-table.element(a,names(selection[[3]][[1]]$coef)[i],header=TRUE)
}
a<-table.row.end(a)
for (j in 1:nrows) {
a<-table.row.start(a)
mydum <- 'Estimates ('
mydum <- paste(mydum,j)
mydum <- paste(mydum,')')
a<-table.element(a,mydum, header=TRUE)
for (i in 1:ncols) {
a<-table.element(a,round(selection[[1]][j,i],4))
}
a<-table.row.end(a)
a<-table.row.start(a)
a<-table.element(a,'(p-val)', header=TRUE)
for (i in 1:ncols) {
mydum <- '('
mydum <- paste(mydum,round(selection[[2]][j,i],4),sep='')
mydum <- paste(mydum,')')
a<-table.element(a,mydum)
}
a<-table.row.end(a)
}
a<-table.end(a)
table.save(a,file='mytable.tab')
a<-table.start()
a<-table.row.start(a)
a<-table.element(a,'Estimated ARIMA Residuals', 1,TRUE)
a<-table.row.end(a)
a<-table.row.start(a)
a<-table.element(a,'Value', 1,TRUE)
a<-table.row.end(a)
for (i in (par4*par5+par3):length(resid)) {
a<-table.row.start(a)
a<-table.element(a,resid[i])
a<-table.row.end(a)
}
a<-table.end(a)
table.save(a,file='mytable1.tab')