Free Statistics

of Irreproducible Research!

Author's title

Author*The author of this computation has been verified*
R Software Modulerwasp_autocorrelation.wasp
Title produced by software(Partial) Autocorrelation Function
Date of computationMon, 08 Dec 2008 14:02:10 -0700
Cite this page as followsStatistical Computations at FreeStatistics.org, Office for Research Development and Education, URL https://freestatistics.org/blog/index.php?v=date/2008/Dec/08/t1228770213ykpl3d8ccsbr20p.htm/, Retrieved Thu, 16 May 2024 22:52:49 +0000
Statistical Computations at FreeStatistics.org, Office for Research Development and Education, URL https://freestatistics.org/blog/index.php?pk=31015, Retrieved Thu, 16 May 2024 22:52:49 +0000
QR Codes:

Original text written by user:
IsPrivate?No (this computation is public)
User-defined keywords
Estimated Impact137
Family? (F = Feedback message, R = changed R code, M = changed R Module, P = changed Parameters, D = changed Data)
-       [(Partial) Autocorrelation Function] [ACF] [2008-12-08 21:02:10] [9c9e716fef59bf95ba5b3e37a9a90be4] [Current]
Feedback Forum

Post a new message
Dataseries X:
95.1
95.9
95.9
96.9
95.7
97.8
95.9
98.2
101.2
106.8
108.2
108.2
113.2
115.2
122
119.8
119.8
112.7
113.8
118.6
119.2
118.1
121.6
125.3
126.5
133.6
136.5
131.9
131.9
139.3
139.9
140.1
142.1
141.8
143.5
143.6
140.6
137.4
133.9
134.6
134.6
132.1
132.5
134.1
135.1
136.4
136.6
138.1
138.4
141
144.9
153.4
156.5
160.7
163.9
166.7
169.7
174.3
181.8
187.8
182.4


Summary of computational transaction
Raw Inputview raw input (R code)
Raw Outputview raw output of R engine
Computing time1 seconds
R Server'Gwilym Jenkins' @ 72.249.127.135

\begin{tabular}{lllllllll}
\hline
Summary of computational transaction \tabularnewline
Raw Input & view raw input (R code)  \tabularnewline
Raw Output & view raw output of R engine  \tabularnewline
Computing time & 1 seconds \tabularnewline
R Server & 'Gwilym Jenkins' @ 72.249.127.135 \tabularnewline
\hline
\end{tabular}
%Source: https://freestatistics.org/blog/index.php?pk=31015&T=0

[TABLE]
[ROW][C]Summary of computational transaction[/C][/ROW]
[ROW][C]Raw Input[/C][C]view raw input (R code) [/C][/ROW]
[ROW][C]Raw Output[/C][C]view raw output of R engine [/C][/ROW]
[ROW][C]Computing time[/C][C]1 seconds[/C][/ROW]
[ROW][C]R Server[/C][C]'Gwilym Jenkins' @ 72.249.127.135[/C][/ROW]
[/TABLE]
Source: https://freestatistics.org/blog/index.php?pk=31015&T=0

Globally Unique Identifier (entire table): ba.freestatistics.org/blog/index.php?pk=31015&T=0

As an alternative you can also use a QR Code:  

The GUIDs for individual cells are displayed in the table below:

Summary of computational transaction
Raw Inputview raw input (R code)
Raw Outputview raw output of R engine
Computing time1 seconds
R Server'Gwilym Jenkins' @ 72.249.127.135


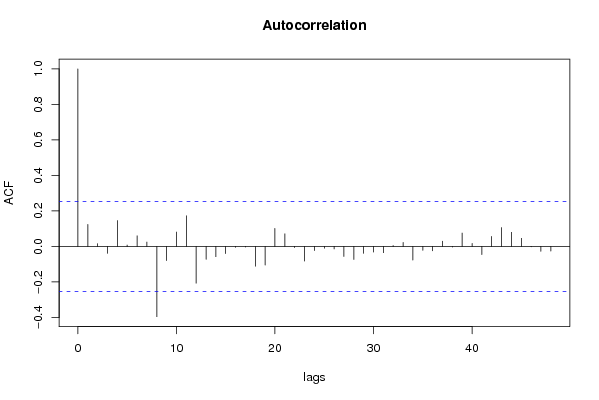
Autocorrelation Function
Time lag kACF(k)T-STATP-value
10.1241190.96140.170099
20.0155480.12040.45227
3-0.038488-0.29810.383319
40.1455661.12750.132
50.0081110.06280.475057
60.0599980.46470.321899
70.0246360.19080.424652
8-0.395423-3.06290.00164
9-0.07976-0.61780.269517
100.0807840.62570.266927
110.1727571.33820.092945
12-0.207198-1.60490.056878
13-0.072447-0.56120.288384
14-0.057288-0.44370.32941
15-0.03996-0.30950.378997
16-0.00508-0.03930.484371
17-0.00315-0.02440.490307
18-0.111052-0.86020.19655
19-0.104782-0.81160.210104
200.1013160.78480.217832
210.07090.54920.292457
22-0.006528-0.05060.479921
23-0.082441-0.63860.262761
24-0.023136-0.17920.429189
25-0.00955-0.0740.470639
26-0.014048-0.10880.456855
27-0.056483-0.43750.331654
28-0.073021-0.56560.28688
29-0.038611-0.29910.382955
30-0.031838-0.24660.403023
31-0.035107-0.27190.393303
320.0048780.03780.484993
330.0225190.17440.431058
34-0.076694-0.59410.277349
35-0.021486-0.16640.434189
36-0.024801-0.19210.424152
370.0295150.22860.40997
38-0.003189-0.02470.490187
390.0753420.58360.28084
400.0169040.13090.448132
41-0.045815-0.35490.361961
420.0566210.43860.331269
430.1064840.82480.20637
440.079580.61640.269972
450.0461810.35770.360906
46-0.001847-0.01430.494318
47-0.027346-0.21180.416484
48-0.026024-0.20160.420464

\begin{tabular}{lllllllll}
\hline
Autocorrelation Function \tabularnewline
Time lag k & ACF(k) & T-STAT & P-value \tabularnewline
1 & 0.124119 & 0.9614 & 0.170099 \tabularnewline
2 & 0.015548 & 0.1204 & 0.45227 \tabularnewline
3 & -0.038488 & -0.2981 & 0.383319 \tabularnewline
4 & 0.145566 & 1.1275 & 0.132 \tabularnewline
5 & 0.008111 & 0.0628 & 0.475057 \tabularnewline
6 & 0.059998 & 0.4647 & 0.321899 \tabularnewline
7 & 0.024636 & 0.1908 & 0.424652 \tabularnewline
8 & -0.395423 & -3.0629 & 0.00164 \tabularnewline
9 & -0.07976 & -0.6178 & 0.269517 \tabularnewline
10 & 0.080784 & 0.6257 & 0.266927 \tabularnewline
11 & 0.172757 & 1.3382 & 0.092945 \tabularnewline
12 & -0.207198 & -1.6049 & 0.056878 \tabularnewline
13 & -0.072447 & -0.5612 & 0.288384 \tabularnewline
14 & -0.057288 & -0.4437 & 0.32941 \tabularnewline
15 & -0.03996 & -0.3095 & 0.378997 \tabularnewline
16 & -0.00508 & -0.0393 & 0.484371 \tabularnewline
17 & -0.00315 & -0.0244 & 0.490307 \tabularnewline
18 & -0.111052 & -0.8602 & 0.19655 \tabularnewline
19 & -0.104782 & -0.8116 & 0.210104 \tabularnewline
20 & 0.101316 & 0.7848 & 0.217832 \tabularnewline
21 & 0.0709 & 0.5492 & 0.292457 \tabularnewline
22 & -0.006528 & -0.0506 & 0.479921 \tabularnewline
23 & -0.082441 & -0.6386 & 0.262761 \tabularnewline
24 & -0.023136 & -0.1792 & 0.429189 \tabularnewline
25 & -0.00955 & -0.074 & 0.470639 \tabularnewline
26 & -0.014048 & -0.1088 & 0.456855 \tabularnewline
27 & -0.056483 & -0.4375 & 0.331654 \tabularnewline
28 & -0.073021 & -0.5656 & 0.28688 \tabularnewline
29 & -0.038611 & -0.2991 & 0.382955 \tabularnewline
30 & -0.031838 & -0.2466 & 0.403023 \tabularnewline
31 & -0.035107 & -0.2719 & 0.393303 \tabularnewline
32 & 0.004878 & 0.0378 & 0.484993 \tabularnewline
33 & 0.022519 & 0.1744 & 0.431058 \tabularnewline
34 & -0.076694 & -0.5941 & 0.277349 \tabularnewline
35 & -0.021486 & -0.1664 & 0.434189 \tabularnewline
36 & -0.024801 & -0.1921 & 0.424152 \tabularnewline
37 & 0.029515 & 0.2286 & 0.40997 \tabularnewline
38 & -0.003189 & -0.0247 & 0.490187 \tabularnewline
39 & 0.075342 & 0.5836 & 0.28084 \tabularnewline
40 & 0.016904 & 0.1309 & 0.448132 \tabularnewline
41 & -0.045815 & -0.3549 & 0.361961 \tabularnewline
42 & 0.056621 & 0.4386 & 0.331269 \tabularnewline
43 & 0.106484 & 0.8248 & 0.20637 \tabularnewline
44 & 0.07958 & 0.6164 & 0.269972 \tabularnewline
45 & 0.046181 & 0.3577 & 0.360906 \tabularnewline
46 & -0.001847 & -0.0143 & 0.494318 \tabularnewline
47 & -0.027346 & -0.2118 & 0.416484 \tabularnewline
48 & -0.026024 & -0.2016 & 0.420464 \tabularnewline
\hline
\end{tabular}
%Source: https://freestatistics.org/blog/index.php?pk=31015&T=1

[TABLE]
[ROW][C]Autocorrelation Function[/C][/ROW]
[ROW][C]Time lag k[/C][C]ACF(k)[/C][C]T-STAT[/C][C]P-value[/C][/ROW]
[ROW][C]1[/C][C]0.124119[/C][C]0.9614[/C][C]0.170099[/C][/ROW]
[ROW][C]2[/C][C]0.015548[/C][C]0.1204[/C][C]0.45227[/C][/ROW]
[ROW][C]3[/C][C]-0.038488[/C][C]-0.2981[/C][C]0.383319[/C][/ROW]
[ROW][C]4[/C][C]0.145566[/C][C]1.1275[/C][C]0.132[/C][/ROW]
[ROW][C]5[/C][C]0.008111[/C][C]0.0628[/C][C]0.475057[/C][/ROW]
[ROW][C]6[/C][C]0.059998[/C][C]0.4647[/C][C]0.321899[/C][/ROW]
[ROW][C]7[/C][C]0.024636[/C][C]0.1908[/C][C]0.424652[/C][/ROW]
[ROW][C]8[/C][C]-0.395423[/C][C]-3.0629[/C][C]0.00164[/C][/ROW]
[ROW][C]9[/C][C]-0.07976[/C][C]-0.6178[/C][C]0.269517[/C][/ROW]
[ROW][C]10[/C][C]0.080784[/C][C]0.6257[/C][C]0.266927[/C][/ROW]
[ROW][C]11[/C][C]0.172757[/C][C]1.3382[/C][C]0.092945[/C][/ROW]
[ROW][C]12[/C][C]-0.207198[/C][C]-1.6049[/C][C]0.056878[/C][/ROW]
[ROW][C]13[/C][C]-0.072447[/C][C]-0.5612[/C][C]0.288384[/C][/ROW]
[ROW][C]14[/C][C]-0.057288[/C][C]-0.4437[/C][C]0.32941[/C][/ROW]
[ROW][C]15[/C][C]-0.03996[/C][C]-0.3095[/C][C]0.378997[/C][/ROW]
[ROW][C]16[/C][C]-0.00508[/C][C]-0.0393[/C][C]0.484371[/C][/ROW]
[ROW][C]17[/C][C]-0.00315[/C][C]-0.0244[/C][C]0.490307[/C][/ROW]
[ROW][C]18[/C][C]-0.111052[/C][C]-0.8602[/C][C]0.19655[/C][/ROW]
[ROW][C]19[/C][C]-0.104782[/C][C]-0.8116[/C][C]0.210104[/C][/ROW]
[ROW][C]20[/C][C]0.101316[/C][C]0.7848[/C][C]0.217832[/C][/ROW]
[ROW][C]21[/C][C]0.0709[/C][C]0.5492[/C][C]0.292457[/C][/ROW]
[ROW][C]22[/C][C]-0.006528[/C][C]-0.0506[/C][C]0.479921[/C][/ROW]
[ROW][C]23[/C][C]-0.082441[/C][C]-0.6386[/C][C]0.262761[/C][/ROW]
[ROW][C]24[/C][C]-0.023136[/C][C]-0.1792[/C][C]0.429189[/C][/ROW]
[ROW][C]25[/C][C]-0.00955[/C][C]-0.074[/C][C]0.470639[/C][/ROW]
[ROW][C]26[/C][C]-0.014048[/C][C]-0.1088[/C][C]0.456855[/C][/ROW]
[ROW][C]27[/C][C]-0.056483[/C][C]-0.4375[/C][C]0.331654[/C][/ROW]
[ROW][C]28[/C][C]-0.073021[/C][C]-0.5656[/C][C]0.28688[/C][/ROW]
[ROW][C]29[/C][C]-0.038611[/C][C]-0.2991[/C][C]0.382955[/C][/ROW]
[ROW][C]30[/C][C]-0.031838[/C][C]-0.2466[/C][C]0.403023[/C][/ROW]
[ROW][C]31[/C][C]-0.035107[/C][C]-0.2719[/C][C]0.393303[/C][/ROW]
[ROW][C]32[/C][C]0.004878[/C][C]0.0378[/C][C]0.484993[/C][/ROW]
[ROW][C]33[/C][C]0.022519[/C][C]0.1744[/C][C]0.431058[/C][/ROW]
[ROW][C]34[/C][C]-0.076694[/C][C]-0.5941[/C][C]0.277349[/C][/ROW]
[ROW][C]35[/C][C]-0.021486[/C][C]-0.1664[/C][C]0.434189[/C][/ROW]
[ROW][C]36[/C][C]-0.024801[/C][C]-0.1921[/C][C]0.424152[/C][/ROW]
[ROW][C]37[/C][C]0.029515[/C][C]0.2286[/C][C]0.40997[/C][/ROW]
[ROW][C]38[/C][C]-0.003189[/C][C]-0.0247[/C][C]0.490187[/C][/ROW]
[ROW][C]39[/C][C]0.075342[/C][C]0.5836[/C][C]0.28084[/C][/ROW]
[ROW][C]40[/C][C]0.016904[/C][C]0.1309[/C][C]0.448132[/C][/ROW]
[ROW][C]41[/C][C]-0.045815[/C][C]-0.3549[/C][C]0.361961[/C][/ROW]
[ROW][C]42[/C][C]0.056621[/C][C]0.4386[/C][C]0.331269[/C][/ROW]
[ROW][C]43[/C][C]0.106484[/C][C]0.8248[/C][C]0.20637[/C][/ROW]
[ROW][C]44[/C][C]0.07958[/C][C]0.6164[/C][C]0.269972[/C][/ROW]
[ROW][C]45[/C][C]0.046181[/C][C]0.3577[/C][C]0.360906[/C][/ROW]
[ROW][C]46[/C][C]-0.001847[/C][C]-0.0143[/C][C]0.494318[/C][/ROW]
[ROW][C]47[/C][C]-0.027346[/C][C]-0.2118[/C][C]0.416484[/C][/ROW]
[ROW][C]48[/C][C]-0.026024[/C][C]-0.2016[/C][C]0.420464[/C][/ROW]
[/TABLE]
Source: https://freestatistics.org/blog/index.php?pk=31015&T=1

Globally Unique Identifier (entire table): ba.freestatistics.org/blog/index.php?pk=31015&T=1

As an alternative you can also use a QR Code:  

The GUIDs for individual cells are displayed in the table below:

Autocorrelation Function
Time lag kACF(k)T-STATP-value
10.1241190.96140.170099
20.0155480.12040.45227
3-0.038488-0.29810.383319
40.1455661.12750.132
50.0081110.06280.475057
60.0599980.46470.321899
70.0246360.19080.424652
8-0.395423-3.06290.00164
9-0.07976-0.61780.269517
100.0807840.62570.266927
110.1727571.33820.092945
12-0.207198-1.60490.056878
13-0.072447-0.56120.288384
14-0.057288-0.44370.32941
15-0.03996-0.30950.378997
16-0.00508-0.03930.484371
17-0.00315-0.02440.490307
18-0.111052-0.86020.19655
19-0.104782-0.81160.210104
200.1013160.78480.217832
210.07090.54920.292457
22-0.006528-0.05060.479921
23-0.082441-0.63860.262761
24-0.023136-0.17920.429189
25-0.00955-0.0740.470639
26-0.014048-0.10880.456855
27-0.056483-0.43750.331654
28-0.073021-0.56560.28688
29-0.038611-0.29910.382955
30-0.031838-0.24660.403023
31-0.035107-0.27190.393303
320.0048780.03780.484993
330.0225190.17440.431058
34-0.076694-0.59410.277349
35-0.021486-0.16640.434189
36-0.024801-0.19210.424152
370.0295150.22860.40997
38-0.003189-0.02470.490187
390.0753420.58360.28084
400.0169040.13090.448132
41-0.045815-0.35490.361961
420.0566210.43860.331269
430.1064840.82480.20637
440.079580.61640.269972
450.0461810.35770.360906
46-0.001847-0.01430.494318
47-0.027346-0.21180.416484
48-0.026024-0.20160.420464


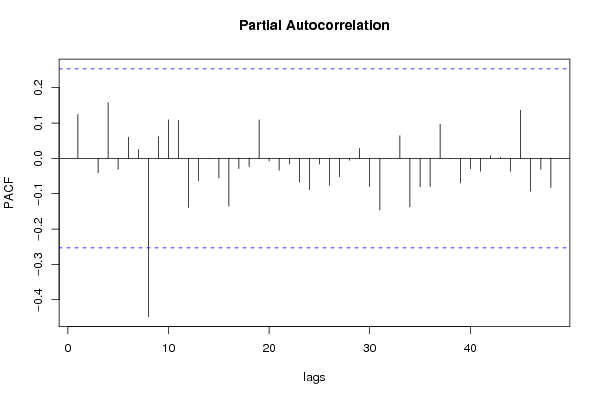
Partial Autocorrelation Function
Time lag kPACF(k)T-STATP-value
10.1241190.96140.170099
20.0001450.00110.499555
3-0.041068-0.31810.375753
40.1580561.22430.112814
5-0.030681-0.23770.406478
60.0600390.46510.321786
70.0252870.19590.422685
8-0.448056-3.47060.000484
90.0612360.47430.318493
100.1088940.84350.201153
110.1081540.83780.202746
12-0.138793-1.07510.143321
13-0.063305-0.49040.312834
14-0.000524-0.00410.498386
15-0.055388-0.4290.334717
16-0.13495-1.04530.150034
17-0.028823-0.22330.412046
18-0.023137-0.17920.429186
190.1085560.84090.20188
20-0.007375-0.05710.477317
21-0.033604-0.26030.397763
22-0.015749-0.1220.451656
23-0.067077-0.51960.302634
24-0.088797-0.68780.247108
25-0.016166-0.12520.450383
26-0.076983-0.59630.276606
27-0.05189-0.40190.34458
28-0.005312-0.04110.483658
290.028030.21710.414425
30-0.079936-0.61920.269069
31-0.145748-1.1290.131704
32-0.000647-0.0050.498009
330.0637320.49370.311672
34-0.1374-1.06430.145729
35-0.080145-0.62080.26854
36-0.079829-0.61840.269341
370.0968340.75010.228071
38-0.001299-0.01010.496001
39-0.069502-0.53840.29616
40-0.0292-0.22620.410913
41-0.036328-0.28140.389687
420.0074460.05770.477099
430.0033380.02590.48973
44-0.036185-0.28030.390111
450.1362211.05520.14779
46-0.092967-0.72010.237124
47-0.031096-0.24090.405238
48-0.082446-0.63860.262748

\begin{tabular}{lllllllll}
\hline
Partial Autocorrelation Function \tabularnewline
Time lag k & PACF(k) & T-STAT & P-value \tabularnewline
1 & 0.124119 & 0.9614 & 0.170099 \tabularnewline
2 & 0.000145 & 0.0011 & 0.499555 \tabularnewline
3 & -0.041068 & -0.3181 & 0.375753 \tabularnewline
4 & 0.158056 & 1.2243 & 0.112814 \tabularnewline
5 & -0.030681 & -0.2377 & 0.406478 \tabularnewline
6 & 0.060039 & 0.4651 & 0.321786 \tabularnewline
7 & 0.025287 & 0.1959 & 0.422685 \tabularnewline
8 & -0.448056 & -3.4706 & 0.000484 \tabularnewline
9 & 0.061236 & 0.4743 & 0.318493 \tabularnewline
10 & 0.108894 & 0.8435 & 0.201153 \tabularnewline
11 & 0.108154 & 0.8378 & 0.202746 \tabularnewline
12 & -0.138793 & -1.0751 & 0.143321 \tabularnewline
13 & -0.063305 & -0.4904 & 0.312834 \tabularnewline
14 & -0.000524 & -0.0041 & 0.498386 \tabularnewline
15 & -0.055388 & -0.429 & 0.334717 \tabularnewline
16 & -0.13495 & -1.0453 & 0.150034 \tabularnewline
17 & -0.028823 & -0.2233 & 0.412046 \tabularnewline
18 & -0.023137 & -0.1792 & 0.429186 \tabularnewline
19 & 0.108556 & 0.8409 & 0.20188 \tabularnewline
20 & -0.007375 & -0.0571 & 0.477317 \tabularnewline
21 & -0.033604 & -0.2603 & 0.397763 \tabularnewline
22 & -0.015749 & -0.122 & 0.451656 \tabularnewline
23 & -0.067077 & -0.5196 & 0.302634 \tabularnewline
24 & -0.088797 & -0.6878 & 0.247108 \tabularnewline
25 & -0.016166 & -0.1252 & 0.450383 \tabularnewline
26 & -0.076983 & -0.5963 & 0.276606 \tabularnewline
27 & -0.05189 & -0.4019 & 0.34458 \tabularnewline
28 & -0.005312 & -0.0411 & 0.483658 \tabularnewline
29 & 0.02803 & 0.2171 & 0.414425 \tabularnewline
30 & -0.079936 & -0.6192 & 0.269069 \tabularnewline
31 & -0.145748 & -1.129 & 0.131704 \tabularnewline
32 & -0.000647 & -0.005 & 0.498009 \tabularnewline
33 & 0.063732 & 0.4937 & 0.311672 \tabularnewline
34 & -0.1374 & -1.0643 & 0.145729 \tabularnewline
35 & -0.080145 & -0.6208 & 0.26854 \tabularnewline
36 & -0.079829 & -0.6184 & 0.269341 \tabularnewline
37 & 0.096834 & 0.7501 & 0.228071 \tabularnewline
38 & -0.001299 & -0.0101 & 0.496001 \tabularnewline
39 & -0.069502 & -0.5384 & 0.29616 \tabularnewline
40 & -0.0292 & -0.2262 & 0.410913 \tabularnewline
41 & -0.036328 & -0.2814 & 0.389687 \tabularnewline
42 & 0.007446 & 0.0577 & 0.477099 \tabularnewline
43 & 0.003338 & 0.0259 & 0.48973 \tabularnewline
44 & -0.036185 & -0.2803 & 0.390111 \tabularnewline
45 & 0.136221 & 1.0552 & 0.14779 \tabularnewline
46 & -0.092967 & -0.7201 & 0.237124 \tabularnewline
47 & -0.031096 & -0.2409 & 0.405238 \tabularnewline
48 & -0.082446 & -0.6386 & 0.262748 \tabularnewline
\hline
\end{tabular}
%Source: https://freestatistics.org/blog/index.php?pk=31015&T=2

[TABLE]
[ROW][C]Partial Autocorrelation Function[/C][/ROW]
[ROW][C]Time lag k[/C][C]PACF(k)[/C][C]T-STAT[/C][C]P-value[/C][/ROW]
[ROW][C]1[/C][C]0.124119[/C][C]0.9614[/C][C]0.170099[/C][/ROW]
[ROW][C]2[/C][C]0.000145[/C][C]0.0011[/C][C]0.499555[/C][/ROW]
[ROW][C]3[/C][C]-0.041068[/C][C]-0.3181[/C][C]0.375753[/C][/ROW]
[ROW][C]4[/C][C]0.158056[/C][C]1.2243[/C][C]0.112814[/C][/ROW]
[ROW][C]5[/C][C]-0.030681[/C][C]-0.2377[/C][C]0.406478[/C][/ROW]
[ROW][C]6[/C][C]0.060039[/C][C]0.4651[/C][C]0.321786[/C][/ROW]
[ROW][C]7[/C][C]0.025287[/C][C]0.1959[/C][C]0.422685[/C][/ROW]
[ROW][C]8[/C][C]-0.448056[/C][C]-3.4706[/C][C]0.000484[/C][/ROW]
[ROW][C]9[/C][C]0.061236[/C][C]0.4743[/C][C]0.318493[/C][/ROW]
[ROW][C]10[/C][C]0.108894[/C][C]0.8435[/C][C]0.201153[/C][/ROW]
[ROW][C]11[/C][C]0.108154[/C][C]0.8378[/C][C]0.202746[/C][/ROW]
[ROW][C]12[/C][C]-0.138793[/C][C]-1.0751[/C][C]0.143321[/C][/ROW]
[ROW][C]13[/C][C]-0.063305[/C][C]-0.4904[/C][C]0.312834[/C][/ROW]
[ROW][C]14[/C][C]-0.000524[/C][C]-0.0041[/C][C]0.498386[/C][/ROW]
[ROW][C]15[/C][C]-0.055388[/C][C]-0.429[/C][C]0.334717[/C][/ROW]
[ROW][C]16[/C][C]-0.13495[/C][C]-1.0453[/C][C]0.150034[/C][/ROW]
[ROW][C]17[/C][C]-0.028823[/C][C]-0.2233[/C][C]0.412046[/C][/ROW]
[ROW][C]18[/C][C]-0.023137[/C][C]-0.1792[/C][C]0.429186[/C][/ROW]
[ROW][C]19[/C][C]0.108556[/C][C]0.8409[/C][C]0.20188[/C][/ROW]
[ROW][C]20[/C][C]-0.007375[/C][C]-0.0571[/C][C]0.477317[/C][/ROW]
[ROW][C]21[/C][C]-0.033604[/C][C]-0.2603[/C][C]0.397763[/C][/ROW]
[ROW][C]22[/C][C]-0.015749[/C][C]-0.122[/C][C]0.451656[/C][/ROW]
[ROW][C]23[/C][C]-0.067077[/C][C]-0.5196[/C][C]0.302634[/C][/ROW]
[ROW][C]24[/C][C]-0.088797[/C][C]-0.6878[/C][C]0.247108[/C][/ROW]
[ROW][C]25[/C][C]-0.016166[/C][C]-0.1252[/C][C]0.450383[/C][/ROW]
[ROW][C]26[/C][C]-0.076983[/C][C]-0.5963[/C][C]0.276606[/C][/ROW]
[ROW][C]27[/C][C]-0.05189[/C][C]-0.4019[/C][C]0.34458[/C][/ROW]
[ROW][C]28[/C][C]-0.005312[/C][C]-0.0411[/C][C]0.483658[/C][/ROW]
[ROW][C]29[/C][C]0.02803[/C][C]0.2171[/C][C]0.414425[/C][/ROW]
[ROW][C]30[/C][C]-0.079936[/C][C]-0.6192[/C][C]0.269069[/C][/ROW]
[ROW][C]31[/C][C]-0.145748[/C][C]-1.129[/C][C]0.131704[/C][/ROW]
[ROW][C]32[/C][C]-0.000647[/C][C]-0.005[/C][C]0.498009[/C][/ROW]
[ROW][C]33[/C][C]0.063732[/C][C]0.4937[/C][C]0.311672[/C][/ROW]
[ROW][C]34[/C][C]-0.1374[/C][C]-1.0643[/C][C]0.145729[/C][/ROW]
[ROW][C]35[/C][C]-0.080145[/C][C]-0.6208[/C][C]0.26854[/C][/ROW]
[ROW][C]36[/C][C]-0.079829[/C][C]-0.6184[/C][C]0.269341[/C][/ROW]
[ROW][C]37[/C][C]0.096834[/C][C]0.7501[/C][C]0.228071[/C][/ROW]
[ROW][C]38[/C][C]-0.001299[/C][C]-0.0101[/C][C]0.496001[/C][/ROW]
[ROW][C]39[/C][C]-0.069502[/C][C]-0.5384[/C][C]0.29616[/C][/ROW]
[ROW][C]40[/C][C]-0.0292[/C][C]-0.2262[/C][C]0.410913[/C][/ROW]
[ROW][C]41[/C][C]-0.036328[/C][C]-0.2814[/C][C]0.389687[/C][/ROW]
[ROW][C]42[/C][C]0.007446[/C][C]0.0577[/C][C]0.477099[/C][/ROW]
[ROW][C]43[/C][C]0.003338[/C][C]0.0259[/C][C]0.48973[/C][/ROW]
[ROW][C]44[/C][C]-0.036185[/C][C]-0.2803[/C][C]0.390111[/C][/ROW]
[ROW][C]45[/C][C]0.136221[/C][C]1.0552[/C][C]0.14779[/C][/ROW]
[ROW][C]46[/C][C]-0.092967[/C][C]-0.7201[/C][C]0.237124[/C][/ROW]
[ROW][C]47[/C][C]-0.031096[/C][C]-0.2409[/C][C]0.405238[/C][/ROW]
[ROW][C]48[/C][C]-0.082446[/C][C]-0.6386[/C][C]0.262748[/C][/ROW]
[/TABLE]
Source: https://freestatistics.org/blog/index.php?pk=31015&T=2

Globally Unique Identifier (entire table): ba.freestatistics.org/blog/index.php?pk=31015&T=2

As an alternative you can also use a QR Code:  

The GUIDs for individual cells are displayed in the table below:

Partial Autocorrelation Function
Time lag kPACF(k)T-STATP-value
10.1241190.96140.170099
20.0001450.00110.499555
3-0.041068-0.31810.375753
40.1580561.22430.112814
5-0.030681-0.23770.406478
60.0600390.46510.321786
70.0252870.19590.422685
8-0.448056-3.47060.000484
90.0612360.47430.318493
100.1088940.84350.201153
110.1081540.83780.202746
12-0.138793-1.07510.143321
13-0.063305-0.49040.312834
14-0.000524-0.00410.498386
15-0.055388-0.4290.334717
16-0.13495-1.04530.150034
17-0.028823-0.22330.412046
18-0.023137-0.17920.429186
190.1085560.84090.20188
20-0.007375-0.05710.477317
21-0.033604-0.26030.397763
22-0.015749-0.1220.451656
23-0.067077-0.51960.302634
24-0.088797-0.68780.247108
25-0.016166-0.12520.450383
26-0.076983-0.59630.276606
27-0.05189-0.40190.34458
28-0.005312-0.04110.483658
290.028030.21710.414425
30-0.079936-0.61920.269069
31-0.145748-1.1290.131704
32-0.000647-0.0050.498009
330.0637320.49370.311672
34-0.1374-1.06430.145729
35-0.080145-0.62080.26854
36-0.079829-0.61840.269341
370.0968340.75010.228071
38-0.001299-0.01010.496001
39-0.069502-0.53840.29616
40-0.0292-0.22620.410913
41-0.036328-0.28140.389687
420.0074460.05770.477099
430.0033380.02590.48973
44-0.036185-0.28030.390111
450.1362211.05520.14779
46-0.092967-0.72010.237124
47-0.031096-0.24090.405238
48-0.082446-0.63860.262748


Parameters (Session):
par1 = 48 ; par2 = -0.8 ; par3 = 1 ; par4 = 0 ; par5 = 12 ;
Parameters (R input):
par1 = 48 ; par2 = -0.8 ; par3 = 1 ; par4 = 0 ; par5 = 12 ;
R code (references can be found in the software module):
if (par1 == 'Default') {
par1 = 10*log10(length(x))
} else {
par1 <- as.numeric(par1)
}
par2 <- as.numeric(par2)
par3 <- as.numeric(par3)
par4 <- as.numeric(par4)
par5 <- as.numeric(par5)
if (par2 == 0) {
x <- log(x)
} else {
x <- (x ^ par2 - 1) / par2
}
if (par3 > 0) x <- diff(x,lag=1,difference=par3)
if (par4 > 0) x <- diff(x,lag=par5,difference=par4)
bitmap(file='pic1.png')
racf <- acf(x,par1,main='Autocorrelation',xlab='lags',ylab='ACF')
dev.off()
bitmap(file='pic2.png')
rpacf <- pacf(x,par1,main='Partial Autocorrelation',xlab='lags',ylab='PACF')
dev.off()
(myacf <- c(racf$acf))
(mypacf <- c(rpacf$acf))
lengthx <- length(x)
sqrtn <- sqrt(lengthx)
load(file='createtable')
a<-table.start()
a<-table.row.start(a)
a<-table.element(a,'Autocorrelation Function',4,TRUE)
a<-table.row.end(a)
a<-table.row.start(a)
a<-table.element(a,'Time lag k',header=TRUE)
a<-table.element(a,hyperlink('basics.htm','ACF(k)','click here for more information about the Autocorrelation Function'),header=TRUE)
a<-table.element(a,'T-STAT',header=TRUE)
a<-table.element(a,'P-value',header=TRUE)
a<-table.row.end(a)
for (i in 2:(par1+1)) {
a<-table.row.start(a)
a<-table.element(a,i-1,header=TRUE)
a<-table.element(a,round(myacf[i],6))
mytstat <- myacf[i]*sqrtn
a<-table.element(a,round(mytstat,4))
a<-table.element(a,round(1-pt(abs(mytstat),lengthx),6))
a<-table.row.end(a)
}
a<-table.end(a)
table.save(a,file='mytable.tab')
a<-table.start()
a<-table.row.start(a)
a<-table.element(a,'Partial Autocorrelation Function',4,TRUE)
a<-table.row.end(a)
a<-table.row.start(a)
a<-table.element(a,'Time lag k',header=TRUE)
a<-table.element(a,hyperlink('basics.htm','PACF(k)','click here for more information about the Partial Autocorrelation Function'),header=TRUE)
a<-table.element(a,'T-STAT',header=TRUE)
a<-table.element(a,'P-value',header=TRUE)
a<-table.row.end(a)
for (i in 1:par1) {
a<-table.row.start(a)
a<-table.element(a,i,header=TRUE)
a<-table.element(a,round(mypacf[i],6))
mytstat <- mypacf[i]*sqrtn
a<-table.element(a,round(mytstat,4))
a<-table.element(a,round(1-pt(abs(mytstat),lengthx),6))
a<-table.row.end(a)
}
a<-table.end(a)
table.save(a,file='mytable1.tab')