Free Statistics

of Irreproducible Research!

Author's title

Author*The author of this computation has been verified*
R Software Modulerwasp_smp.wasp
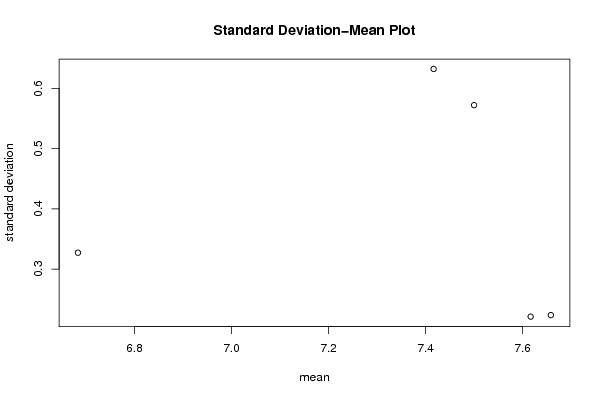
Title produced by softwareStandard Deviation-Mean Plot
Date of computationMon, 08 Dec 2008 13:37:19 -0700
Cite this page as followsStatistical Computations at FreeStatistics.org, Office for Research Development and Education, URL https://freestatistics.org/blog/index.php?v=date/2008/Dec/08/t122876875421xfy78ezji73qj.htm/, Retrieved Thu, 16 May 2024 12:21:47 +0000
Statistical Computations at FreeStatistics.org, Office for Research Development and Education, URL https://freestatistics.org/blog/index.php?pk=30988, Retrieved Thu, 16 May 2024 12:21:47 +0000
QR Codes:

Original text written by user:
IsPrivate?No (this computation is public)
User-defined keywords
Estimated Impact182
Family? (F = Feedback message, R = changed R code, M = changed R Module, P = changed Parameters, D = changed Data)
-     [Univariate Data Series] [data set] [2008-12-01 19:54:57] [b98453cac15ba1066b407e146608df68]
F RMP   [(Partial) Autocorrelation Function] [Q1 Identification...] [2008-12-07 12:45:11] [c993f605b206b366f754f7f8c1fcc291]
-   P     [(Partial) Autocorrelation Function] [Q1 Identification...] [2008-12-07 12:48:43] [c993f605b206b366f754f7f8c1fcc291]
F   P       [(Partial) Autocorrelation Function] [Q1 Identification...] [2008-12-07 12:54:02] [c993f605b206b366f754f7f8c1fcc291]
- RMP         [Spectral Analysis] [Q1 Identification...] [2008-12-07 13:13:33] [c993f605b206b366f754f7f8c1fcc291]
-   P           [Spectral Analysis] [Q1 Identification...] [2008-12-07 16:39:04] [c993f605b206b366f754f7f8c1fcc291]
F RMP             [Standard Deviation-Mean Plot] [Q1 Identification...] [2008-12-07 16:50:56] [c993f605b206b366f754f7f8c1fcc291]
F    D                [Standard Deviation-Mean Plot] [Sdm eigen tijdreeks] [2008-12-08 20:37:19] [70ba55c7ff8e068610dc28fc16e6d1e2] [Current]
Feedback Forum
2008-12-10 16:12:06 [Ken Van den Heuvel] [reply
Regression: S.E.(k) = alpha + beta * Mean(k)
alpha 0.530900926354879
beta -0.0184089984596247
S.D. 0.282390248882080
T-STAT -0.0651899225716959
p-value 0.952123747937673

Je p-waarde is 95%. Bijgevolg hoef je zelfs al niet meer verder te kijken naar een mogelijke lambda transformatie. Er is immers te veel kans dat je resultaat op toeval berust.

Voor de volgende berekeningen dien je dus lambda op 1 te laten staan.

Post a new message
Dataseries X:
7.8
7.6
7.5
7.6
7.5
7.3
7.6
7.5
7.6
7.9
7.9
8.1
8.2
8.0
7.5
6.8
6.5
6.6
7.6
8.0
8.0
7.7
7.5
7.6
7.7
7.9
7.8
7.5
7.5
7.1
7.5
7.5
7.6
7.7
7.7
7.9
8.1
8.2
8.2
8.1
7.9
7.3
6.9
6.6
6.7
6.9
7.0
7.1
7.2
7.1
6.9
7.0
6.8
6.4
6.7
6.7
6.4
6.3
6.2
6.5
6.8
6.8
6.5
6.3
5.9
5.9
6.4
6.4


Summary of computational transaction
Raw Inputview raw input (R code)
Raw Outputview raw output of R engine
Computing time2 seconds
R Server'Sir Ronald Aylmer Fisher' @ 193.190.124.24

\begin{tabular}{lllllllll}
\hline
Summary of computational transaction \tabularnewline
Raw Input & view raw input (R code)  \tabularnewline
Raw Output & view raw output of R engine  \tabularnewline
Computing time & 2 seconds \tabularnewline
R Server & 'Sir Ronald Aylmer Fisher' @ 193.190.124.24 \tabularnewline
\hline
\end{tabular}
%Source: https://freestatistics.org/blog/index.php?pk=30988&T=0

[TABLE]
[ROW][C]Summary of computational transaction[/C][/ROW]
[ROW][C]Raw Input[/C][C]view raw input (R code) [/C][/ROW]
[ROW][C]Raw Output[/C][C]view raw output of R engine [/C][/ROW]
[ROW][C]Computing time[/C][C]2 seconds[/C][/ROW]
[ROW][C]R Server[/C][C]'Sir Ronald Aylmer Fisher' @ 193.190.124.24[/C][/ROW]
[/TABLE]
Source: https://freestatistics.org/blog/index.php?pk=30988&T=0

Globally Unique Identifier (entire table): ba.freestatistics.org/blog/index.php?pk=30988&T=0

As an alternative you can also use a QR Code:  

The GUIDs for individual cells are displayed in the table below:

Summary of computational transaction
Raw Inputview raw input (R code)
Raw Outputview raw output of R engine
Computing time2 seconds
R Server'Sir Ronald Aylmer Fisher' @ 193.190.124.24


Standard Deviation-Mean Plot
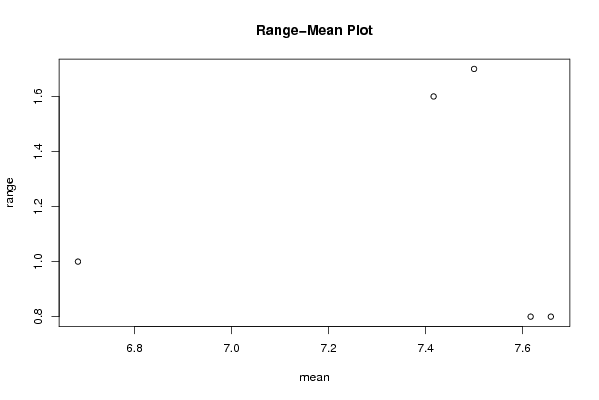
SectionMeanStandard DeviationRange
17.658333333333330.2234373344457960.8
27.50.5720775535473551.7
37.616666666666670.2208797835653570.8
47.416666666666670.6322159201546331.6
56.683333333333330.3270622218625941

\begin{tabular}{lllllllll}
\hline
Standard Deviation-Mean Plot \tabularnewline
Section & Mean & Standard Deviation & Range \tabularnewline
1 & 7.65833333333333 & 0.223437334445796 & 0.8 \tabularnewline
2 & 7.5 & 0.572077553547355 & 1.7 \tabularnewline
3 & 7.61666666666667 & 0.220879783565357 & 0.8 \tabularnewline
4 & 7.41666666666667 & 0.632215920154633 & 1.6 \tabularnewline
5 & 6.68333333333333 & 0.327062221862594 & 1 \tabularnewline
\hline
\end{tabular}
%Source: https://freestatistics.org/blog/index.php?pk=30988&T=1

[TABLE]
[ROW][C]Standard Deviation-Mean Plot[/C][/ROW]
[ROW][C]Section[/C][C]Mean[/C][C]Standard Deviation[/C][C]Range[/C][/ROW]
[ROW][C]1[/C][C]7.65833333333333[/C][C]0.223437334445796[/C][C]0.8[/C][/ROW]
[ROW][C]2[/C][C]7.5[/C][C]0.572077553547355[/C][C]1.7[/C][/ROW]
[ROW][C]3[/C][C]7.61666666666667[/C][C]0.220879783565357[/C][C]0.8[/C][/ROW]
[ROW][C]4[/C][C]7.41666666666667[/C][C]0.632215920154633[/C][C]1.6[/C][/ROW]
[ROW][C]5[/C][C]6.68333333333333[/C][C]0.327062221862594[/C][C]1[/C][/ROW]
[/TABLE]
Source: https://freestatistics.org/blog/index.php?pk=30988&T=1

Globally Unique Identifier (entire table): ba.freestatistics.org/blog/index.php?pk=30988&T=1

As an alternative you can also use a QR Code:  

The GUIDs for individual cells are displayed in the table below:

Standard Deviation-Mean Plot
SectionMeanStandard DeviationRange
17.658333333333330.2234373344457960.8
27.50.5720775535473551.7
37.616666666666670.2208797835653570.8
47.416666666666670.6322159201546331.6
56.683333333333330.3270622218625941


Regression: S.E.(k) = alpha + beta * Mean(k)
alpha0.530900926354879
beta-0.0184089984596247
S.D.0.282390248882080
T-STAT-0.0651899225716959
p-value0.952123747937673

\begin{tabular}{lllllllll}
\hline
Regression: S.E.(k) = alpha + beta * Mean(k) \tabularnewline
alpha & 0.530900926354879 \tabularnewline
beta & -0.0184089984596247 \tabularnewline
S.D. & 0.282390248882080 \tabularnewline
T-STAT & -0.0651899225716959 \tabularnewline
p-value & 0.952123747937673 \tabularnewline
\hline
\end{tabular}
%Source: https://freestatistics.org/blog/index.php?pk=30988&T=2

[TABLE]
[ROW][C]Regression: S.E.(k) = alpha + beta * Mean(k)[/C][/ROW]
[ROW][C]alpha[/C][C]0.530900926354879[/C][/ROW]
[ROW][C]beta[/C][C]-0.0184089984596247[/C][/ROW]
[ROW][C]S.D.[/C][C]0.282390248882080[/C][/ROW]
[ROW][C]T-STAT[/C][C]-0.0651899225716959[/C][/ROW]
[ROW][C]p-value[/C][C]0.952123747937673[/C][/ROW]
[/TABLE]
Source: https://freestatistics.org/blog/index.php?pk=30988&T=2

Globally Unique Identifier (entire table): ba.freestatistics.org/blog/index.php?pk=30988&T=2

As an alternative you can also use a QR Code:  

The GUIDs for individual cells are displayed in the table below:

Regression: S.E.(k) = alpha + beta * Mean(k)
alpha0.530900926354879
beta-0.0184089984596247
S.D.0.282390248882080
T-STAT-0.0651899225716959
p-value0.952123747937673


Regression: ln S.E.(k) = alpha + beta * ln Mean(k)
alpha1.11268599061127
beta-1.07235479521163
S.D.5.15135567932006
T-STAT-0.208169433828178
p-value0.848428298185355
Lambda2.07235479521163

\begin{tabular}{lllllllll}
\hline
Regression: ln S.E.(k) = alpha + beta * ln Mean(k) \tabularnewline
alpha & 1.11268599061127 \tabularnewline
beta & -1.07235479521163 \tabularnewline
S.D. & 5.15135567932006 \tabularnewline
T-STAT & -0.208169433828178 \tabularnewline
p-value & 0.848428298185355 \tabularnewline
Lambda & 2.07235479521163 \tabularnewline
\hline
\end{tabular}
%Source: https://freestatistics.org/blog/index.php?pk=30988&T=3

[TABLE]
[ROW][C]Regression: ln S.E.(k) = alpha + beta * ln Mean(k)[/C][/ROW]
[ROW][C]alpha[/C][C]1.11268599061127[/C][/ROW]
[ROW][C]beta[/C][C]-1.07235479521163[/C][/ROW]
[ROW][C]S.D.[/C][C]5.15135567932006[/C][/ROW]
[ROW][C]T-STAT[/C][C]-0.208169433828178[/C][/ROW]
[ROW][C]p-value[/C][C]0.848428298185355[/C][/ROW]
[ROW][C]Lambda[/C][C]2.07235479521163[/C][/ROW]
[/TABLE]
Source: https://freestatistics.org/blog/index.php?pk=30988&T=3

Globally Unique Identifier (entire table): ba.freestatistics.org/blog/index.php?pk=30988&T=3

As an alternative you can also use a QR Code:  

The GUIDs for individual cells are displayed in the table below:

Regression: ln S.E.(k) = alpha + beta * ln Mean(k)
alpha1.11268599061127
beta-1.07235479521163
S.D.5.15135567932006
T-STAT-0.208169433828178
p-value0.848428298185355
Lambda2.07235479521163


Parameters (Session):
par1 = 12 ;
Parameters (R input):
par1 = 12 ;
R code (references can be found in the software module):
par1 <- as.numeric(par1)
(n <- length(x))
(np <- floor(n / par1))
arr <- array(NA,dim=c(par1,np))
j <- 0
k <- 1
for (i in 1:(np*par1))
{
j = j + 1
arr[j,k] <- x[i]
if (j == par1) {
j = 0
k=k+1
}
}
arr
arr.mean <- array(NA,dim=np)
arr.sd <- array(NA,dim=np)
arr.range <- array(NA,dim=np)
for (j in 1:np)
{
arr.mean[j] <- mean(arr[,j],na.rm=TRUE)
arr.sd[j] <- sd(arr[,j],na.rm=TRUE)
arr.range[j] <- max(arr[,j],na.rm=TRUE) - min(arr[,j],na.rm=TRUE)
}
arr.mean
arr.sd
arr.range
(lm1 <- lm(arr.sd~arr.mean))
(lnlm1 <- lm(log(arr.sd)~log(arr.mean)))
(lm2 <- lm(arr.range~arr.mean))
bitmap(file='test1.png')
plot(arr.mean,arr.sd,main='Standard Deviation-Mean Plot',xlab='mean',ylab='standard deviation')
dev.off()
bitmap(file='test2.png')
plot(arr.mean,arr.range,main='Range-Mean Plot',xlab='mean',ylab='range')
dev.off()
load(file='createtable')
a<-table.start()
a<-table.row.start(a)
a<-table.element(a,'Standard Deviation-Mean Plot',4,TRUE)
a<-table.row.end(a)
a<-table.row.start(a)
a<-table.element(a,'Section',header=TRUE)
a<-table.element(a,'Mean',header=TRUE)
a<-table.element(a,'Standard Deviation',header=TRUE)
a<-table.element(a,'Range',header=TRUE)
a<-table.row.end(a)
for (j in 1:np) {
a<-table.row.start(a)
a<-table.element(a,j,header=TRUE)
a<-table.element(a,arr.mean[j])
a<-table.element(a,arr.sd[j] )
a<-table.element(a,arr.range[j] )
a<-table.row.end(a)
}
a<-table.end(a)
table.save(a,file='mytable.tab')
a<-table.start()
a<-table.row.start(a)
a<-table.element(a,'Regression: S.E.(k) = alpha + beta * Mean(k)',2,TRUE)
a<-table.row.end(a)
a<-table.row.start(a)
a<-table.element(a,'alpha',header=TRUE)
a<-table.element(a,lm1$coefficients[[1]])
a<-table.row.end(a)
a<-table.row.start(a)
a<-table.element(a,'beta',header=TRUE)
a<-table.element(a,lm1$coefficients[[2]])
a<-table.row.end(a)
a<-table.row.start(a)
a<-table.element(a,'S.D.',header=TRUE)
a<-table.element(a,summary(lm1)$coefficients[2,2])
a<-table.row.end(a)
a<-table.row.start(a)
a<-table.element(a,'T-STAT',header=TRUE)
a<-table.element(a,summary(lm1)$coefficients[2,3])
a<-table.row.end(a)
a<-table.row.start(a)
a<-table.element(a,'p-value',header=TRUE)
a<-table.element(a,summary(lm1)$coefficients[2,4])
a<-table.row.end(a)
a<-table.end(a)
table.save(a,file='mytable1.tab')
a<-table.start()
a<-table.row.start(a)
a<-table.element(a,'Regression: ln S.E.(k) = alpha + beta * ln Mean(k)',2,TRUE)
a<-table.row.end(a)
a<-table.row.start(a)
a<-table.element(a,'alpha',header=TRUE)
a<-table.element(a,lnlm1$coefficients[[1]])
a<-table.row.end(a)
a<-table.row.start(a)
a<-table.element(a,'beta',header=TRUE)
a<-table.element(a,lnlm1$coefficients[[2]])
a<-table.row.end(a)
a<-table.row.start(a)
a<-table.element(a,'S.D.',header=TRUE)
a<-table.element(a,summary(lnlm1)$coefficients[2,2])
a<-table.row.end(a)
a<-table.row.start(a)
a<-table.element(a,'T-STAT',header=TRUE)
a<-table.element(a,summary(lnlm1)$coefficients[2,3])
a<-table.row.end(a)
a<-table.row.start(a)
a<-table.element(a,'p-value',header=TRUE)
a<-table.element(a,summary(lnlm1)$coefficients[2,4])
a<-table.row.end(a)
a<-table.row.start(a)
a<-table.element(a,'Lambda',header=TRUE)
a<-table.element(a,1-lnlm1$coefficients[[2]])
a<-table.row.end(a)
a<-table.end(a)
table.save(a,file='mytable2.tab')