Free Statistics

of Irreproducible Research!

Author's title

Author*Unverified author*
R Software Modulerwasp_arimabackwardselection.wasp
Title produced by softwareARIMA Backward Selection
Date of computationMon, 08 Dec 2008 13:21:03 -0700
Cite this page as followsStatistical Computations at FreeStatistics.org, Office for Research Development and Education, URL https://freestatistics.org/blog/index.php?v=date/2008/Dec/08/t12287677392e7nspqwmco7upz.htm/, Retrieved Thu, 16 May 2024 09:44:55 +0000
Statistical Computations at FreeStatistics.org, Office for Research Development and Education, URL https://freestatistics.org/blog/index.php?pk=30943, Retrieved Thu, 16 May 2024 09:44:55 +0000
QR Codes:

Original text written by user:
IsPrivate?No (this computation is public)
User-defined keywords
Estimated Impact174
Family? (F = Feedback message, R = changed R code, M = changed R Module, P = changed Parameters, D = changed Data)
F     [Spectral Analysis] [Diff Spectral] [2008-12-06 12:07:42] [74be16979710d4c4e7c6647856088456]
F RMP   [ARIMA Backward Selection] [Arima backward] [2008-12-06 14:19:09] [74be16979710d4c4e7c6647856088456]
- RMPD    [Spectral Analysis] [cumulative inter ...] [2008-12-08 19:57:17] [11edab5c4db3615abbf782b1c6e7cacf]
- RM          [ARIMA Backward Selection] [arima backward in...] [2008-12-08 20:21:03] [e1dd70d3b1099218056e8ae5041dcc2f] [Current]
Feedback Forum

Post a new message
Dataseries X:
90.7
94.3
104.6
111.1
110.8
107.2
99
99
91
96.2
96.9
96.2
100.1
99
115.4
106.9
107.1
99.3
99.2
108.3
105.6
99.5
107.4
93.1
88.1
110.7
113.1
99.6
93.6
98.6
99.6
114.3
107.8
101.2
112.5
100.5
93.9
116.2
112
106.4
95.7
96
95.8
103
102.2
98.4
111.4
86.6
91.3
107.9
101.8
104.4
93.4
100.1
98.5
112.9
101.4
107.1
110.8
90.3
95.5
111.4
113
107.5
95.9
106.3
105.2
117.2
106.9
108.2
113
97.2
99.9
108.1
118.1
109.1
93.3
112.1
111.8
112.5
116.3
110.3
117.1
103.4
96.2


Summary of computational transaction
Raw Inputview raw input (R code)
Raw Outputview raw output of R engine
Computing time17 seconds
R Server'Sir Ronald Aylmer Fisher' @ 193.190.124.24

\begin{tabular}{lllllllll}
\hline
Summary of computational transaction \tabularnewline
Raw Input & view raw input (R code)  \tabularnewline
Raw Output & view raw output of R engine  \tabularnewline
Computing time & 17 seconds \tabularnewline
R Server & 'Sir Ronald Aylmer Fisher' @ 193.190.124.24 \tabularnewline
\hline
\end{tabular}
%Source: https://freestatistics.org/blog/index.php?pk=30943&T=0

[TABLE]
[ROW][C]Summary of computational transaction[/C][/ROW]
[ROW][C]Raw Input[/C][C]view raw input (R code) [/C][/ROW]
[ROW][C]Raw Output[/C][C]view raw output of R engine [/C][/ROW]
[ROW][C]Computing time[/C][C]17 seconds[/C][/ROW]
[ROW][C]R Server[/C][C]'Sir Ronald Aylmer Fisher' @ 193.190.124.24[/C][/ROW]
[/TABLE]
Source: https://freestatistics.org/blog/index.php?pk=30943&T=0

Globally Unique Identifier (entire table): ba.freestatistics.org/blog/index.php?pk=30943&T=0

As an alternative you can also use a QR Code:  

The GUIDs for individual cells are displayed in the table below:

Summary of computational transaction
Raw Inputview raw input (R code)
Raw Outputview raw output of R engine
Computing time17 seconds
R Server'Sir Ronald Aylmer Fisher' @ 193.190.124.24


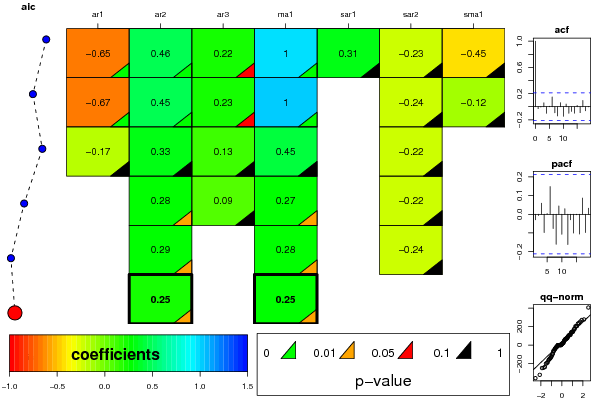
ARIMA Parameter Estimation and Backward Selection
Iterationar1ar2ar3ma1sar1sar2sma1
Estimates ( 1 )-0.65040.45770.21880.99990.3134-0.2348-0.4456
(p-val)(0 )(7e-04 )(0.069 )(0 )(0.4023 )(0.1461 )(0.2563 )
Estimates ( 2 )-0.66780.4550.230510-0.2435-0.1218
(p-val)(0 )(9e-04 )(0.0553 )(0 )(NA )(0.1164 )(0.4331 )
Estimates ( 3 )-0.17190.33230.12550.44550-0.22150
(p-val)(0.9319 )(0.5688 )(0.7677 )(0.8252 )(NA )(0.1544 )(NA )
Estimates ( 4 )00.28490.08750.27450-0.22250
(p-val)(NA )(0.0202 )(0.4593 )(0.022 )(NA )(0.152 )(NA )
Estimates ( 5 )00.290600.27940-0.24220
(p-val)(NA )(0.0163 )(NA )(0.0238 )(NA )(0.1113 )(NA )
Estimates ( 6 )00.249600.2539000
(p-val)(NA )(0.0323 )(NA )(0.0396 )(NA )(NA )(NA )
Estimates ( 7 )NANANANANANANA
(p-val)(NA )(NA )(NA )(NA )(NA )(NA )(NA )
Estimates ( 8 )NANANANANANANA
(p-val)(NA )(NA )(NA )(NA )(NA )(NA )(NA )
Estimates ( 9 )NANANANANANANA
(p-val)(NA )(NA )(NA )(NA )(NA )(NA )(NA )
Estimates ( 10 )NANANANANANANA
(p-val)(NA )(NA )(NA )(NA )(NA )(NA )(NA )
Estimates ( 11 )NANANANANANANA
(p-val)(NA )(NA )(NA )(NA )(NA )(NA )(NA )
Estimates ( 12 )NANANANANANANA
(p-val)(NA )(NA )(NA )(NA )(NA )(NA )(NA )
Estimates ( 13 )NANANANANANANA
(p-val)(NA )(NA )(NA )(NA )(NA )(NA )(NA )

\begin{tabular}{lllllllll}
\hline
ARIMA Parameter Estimation and Backward Selection \tabularnewline
Iteration & ar1 & ar2 & ar3 & ma1 & sar1 & sar2 & sma1 \tabularnewline
Estimates ( 1 ) & -0.6504 & 0.4577 & 0.2188 & 0.9999 & 0.3134 & -0.2348 & -0.4456 \tabularnewline
(p-val) & (0 ) & (7e-04 ) & (0.069 ) & (0 ) & (0.4023 ) & (0.1461 ) & (0.2563 ) \tabularnewline
Estimates ( 2 ) & -0.6678 & 0.455 & 0.2305 & 1 & 0 & -0.2435 & -0.1218 \tabularnewline
(p-val) & (0 ) & (9e-04 ) & (0.0553 ) & (0 ) & (NA ) & (0.1164 ) & (0.4331 ) \tabularnewline
Estimates ( 3 ) & -0.1719 & 0.3323 & 0.1255 & 0.4455 & 0 & -0.2215 & 0 \tabularnewline
(p-val) & (0.9319 ) & (0.5688 ) & (0.7677 ) & (0.8252 ) & (NA ) & (0.1544 ) & (NA ) \tabularnewline
Estimates ( 4 ) & 0 & 0.2849 & 0.0875 & 0.2745 & 0 & -0.2225 & 0 \tabularnewline
(p-val) & (NA ) & (0.0202 ) & (0.4593 ) & (0.022 ) & (NA ) & (0.152 ) & (NA ) \tabularnewline
Estimates ( 5 ) & 0 & 0.2906 & 0 & 0.2794 & 0 & -0.2422 & 0 \tabularnewline
(p-val) & (NA ) & (0.0163 ) & (NA ) & (0.0238 ) & (NA ) & (0.1113 ) & (NA ) \tabularnewline
Estimates ( 6 ) & 0 & 0.2496 & 0 & 0.2539 & 0 & 0 & 0 \tabularnewline
(p-val) & (NA ) & (0.0323 ) & (NA ) & (0.0396 ) & (NA ) & (NA ) & (NA ) \tabularnewline
Estimates ( 7 ) & NA & NA & NA & NA & NA & NA & NA \tabularnewline
(p-val) & (NA ) & (NA ) & (NA ) & (NA ) & (NA ) & (NA ) & (NA ) \tabularnewline
Estimates ( 8 ) & NA & NA & NA & NA & NA & NA & NA \tabularnewline
(p-val) & (NA ) & (NA ) & (NA ) & (NA ) & (NA ) & (NA ) & (NA ) \tabularnewline
Estimates ( 9 ) & NA & NA & NA & NA & NA & NA & NA \tabularnewline
(p-val) & (NA ) & (NA ) & (NA ) & (NA ) & (NA ) & (NA ) & (NA ) \tabularnewline
Estimates ( 10 ) & NA & NA & NA & NA & NA & NA & NA \tabularnewline
(p-val) & (NA ) & (NA ) & (NA ) & (NA ) & (NA ) & (NA ) & (NA ) \tabularnewline
Estimates ( 11 ) & NA & NA & NA & NA & NA & NA & NA \tabularnewline
(p-val) & (NA ) & (NA ) & (NA ) & (NA ) & (NA ) & (NA ) & (NA ) \tabularnewline
Estimates ( 12 ) & NA & NA & NA & NA & NA & NA & NA \tabularnewline
(p-val) & (NA ) & (NA ) & (NA ) & (NA ) & (NA ) & (NA ) & (NA ) \tabularnewline
Estimates ( 13 ) & NA & NA & NA & NA & NA & NA & NA \tabularnewline
(p-val) & (NA ) & (NA ) & (NA ) & (NA ) & (NA ) & (NA ) & (NA ) \tabularnewline
\hline
\end{tabular}
%Source: https://freestatistics.org/blog/index.php?pk=30943&T=1

[TABLE]
[ROW][C]ARIMA Parameter Estimation and Backward Selection[/C][/ROW]
[ROW][C]Iteration[/C][C]ar1[/C][C]ar2[/C][C]ar3[/C][C]ma1[/C][C]sar1[/C][C]sar2[/C][C]sma1[/C][/ROW]
[ROW][C]Estimates ( 1 )[/C][C]-0.6504[/C][C]0.4577[/C][C]0.2188[/C][C]0.9999[/C][C]0.3134[/C][C]-0.2348[/C][C]-0.4456[/C][/ROW]
[ROW][C](p-val)[/C][C](0 )[/C][C](7e-04 )[/C][C](0.069 )[/C][C](0 )[/C][C](0.4023 )[/C][C](0.1461 )[/C][C](0.2563 )[/C][/ROW]
[ROW][C]Estimates ( 2 )[/C][C]-0.6678[/C][C]0.455[/C][C]0.2305[/C][C]1[/C][C]0[/C][C]-0.2435[/C][C]-0.1218[/C][/ROW]
[ROW][C](p-val)[/C][C](0 )[/C][C](9e-04 )[/C][C](0.0553 )[/C][C](0 )[/C][C](NA )[/C][C](0.1164 )[/C][C](0.4331 )[/C][/ROW]
[ROW][C]Estimates ( 3 )[/C][C]-0.1719[/C][C]0.3323[/C][C]0.1255[/C][C]0.4455[/C][C]0[/C][C]-0.2215[/C][C]0[/C][/ROW]
[ROW][C](p-val)[/C][C](0.9319 )[/C][C](0.5688 )[/C][C](0.7677 )[/C][C](0.8252 )[/C][C](NA )[/C][C](0.1544 )[/C][C](NA )[/C][/ROW]
[ROW][C]Estimates ( 4 )[/C][C]0[/C][C]0.2849[/C][C]0.0875[/C][C]0.2745[/C][C]0[/C][C]-0.2225[/C][C]0[/C][/ROW]
[ROW][C](p-val)[/C][C](NA )[/C][C](0.0202 )[/C][C](0.4593 )[/C][C](0.022 )[/C][C](NA )[/C][C](0.152 )[/C][C](NA )[/C][/ROW]
[ROW][C]Estimates ( 5 )[/C][C]0[/C][C]0.2906[/C][C]0[/C][C]0.2794[/C][C]0[/C][C]-0.2422[/C][C]0[/C][/ROW]
[ROW][C](p-val)[/C][C](NA )[/C][C](0.0163 )[/C][C](NA )[/C][C](0.0238 )[/C][C](NA )[/C][C](0.1113 )[/C][C](NA )[/C][/ROW]
[ROW][C]Estimates ( 6 )[/C][C]0[/C][C]0.2496[/C][C]0[/C][C]0.2539[/C][C]0[/C][C]0[/C][C]0[/C][/ROW]
[ROW][C](p-val)[/C][C](NA )[/C][C](0.0323 )[/C][C](NA )[/C][C](0.0396 )[/C][C](NA )[/C][C](NA )[/C][C](NA )[/C][/ROW]
[ROW][C]Estimates ( 7 )[/C][C]NA[/C][C]NA[/C][C]NA[/C][C]NA[/C][C]NA[/C][C]NA[/C][C]NA[/C][/ROW]
[ROW][C](p-val)[/C][C](NA )[/C][C](NA )[/C][C](NA )[/C][C](NA )[/C][C](NA )[/C][C](NA )[/C][C](NA )[/C][/ROW]
[ROW][C]Estimates ( 8 )[/C][C]NA[/C][C]NA[/C][C]NA[/C][C]NA[/C][C]NA[/C][C]NA[/C][C]NA[/C][/ROW]
[ROW][C](p-val)[/C][C](NA )[/C][C](NA )[/C][C](NA )[/C][C](NA )[/C][C](NA )[/C][C](NA )[/C][C](NA )[/C][/ROW]
[ROW][C]Estimates ( 9 )[/C][C]NA[/C][C]NA[/C][C]NA[/C][C]NA[/C][C]NA[/C][C]NA[/C][C]NA[/C][/ROW]
[ROW][C](p-val)[/C][C](NA )[/C][C](NA )[/C][C](NA )[/C][C](NA )[/C][C](NA )[/C][C](NA )[/C][C](NA )[/C][/ROW]
[ROW][C]Estimates ( 10 )[/C][C]NA[/C][C]NA[/C][C]NA[/C][C]NA[/C][C]NA[/C][C]NA[/C][C]NA[/C][/ROW]
[ROW][C](p-val)[/C][C](NA )[/C][C](NA )[/C][C](NA )[/C][C](NA )[/C][C](NA )[/C][C](NA )[/C][C](NA )[/C][/ROW]
[ROW][C]Estimates ( 11 )[/C][C]NA[/C][C]NA[/C][C]NA[/C][C]NA[/C][C]NA[/C][C]NA[/C][C]NA[/C][/ROW]
[ROW][C](p-val)[/C][C](NA )[/C][C](NA )[/C][C](NA )[/C][C](NA )[/C][C](NA )[/C][C](NA )[/C][C](NA )[/C][/ROW]
[ROW][C]Estimates ( 12 )[/C][C]NA[/C][C]NA[/C][C]NA[/C][C]NA[/C][C]NA[/C][C]NA[/C][C]NA[/C][/ROW]
[ROW][C](p-val)[/C][C](NA )[/C][C](NA )[/C][C](NA )[/C][C](NA )[/C][C](NA )[/C][C](NA )[/C][C](NA )[/C][/ROW]
[ROW][C]Estimates ( 13 )[/C][C]NA[/C][C]NA[/C][C]NA[/C][C]NA[/C][C]NA[/C][C]NA[/C][C]NA[/C][/ROW]
[ROW][C](p-val)[/C][C](NA )[/C][C](NA )[/C][C](NA )[/C][C](NA )[/C][C](NA )[/C][C](NA )[/C][C](NA )[/C][/ROW]
[/TABLE]
Source: https://freestatistics.org/blog/index.php?pk=30943&T=1

Globally Unique Identifier (entire table): ba.freestatistics.org/blog/index.php?pk=30943&T=1

As an alternative you can also use a QR Code:  

The GUIDs for individual cells are displayed in the table below:

ARIMA Parameter Estimation and Backward Selection
Iterationar1ar2ar3ma1sar1sar2sma1
Estimates ( 1 )-0.65040.45770.21880.99990.3134-0.2348-0.4456
(p-val)(0 )(7e-04 )(0.069 )(0 )(0.4023 )(0.1461 )(0.2563 )
Estimates ( 2 )-0.66780.4550.230510-0.2435-0.1218
(p-val)(0 )(9e-04 )(0.0553 )(0 )(NA )(0.1164 )(0.4331 )
Estimates ( 3 )-0.17190.33230.12550.44550-0.22150
(p-val)(0.9319 )(0.5688 )(0.7677 )(0.8252 )(NA )(0.1544 )(NA )
Estimates ( 4 )00.28490.08750.27450-0.22250
(p-val)(NA )(0.0202 )(0.4593 )(0.022 )(NA )(0.152 )(NA )
Estimates ( 5 )00.290600.27940-0.24220
(p-val)(NA )(0.0163 )(NA )(0.0238 )(NA )(0.1113 )(NA )
Estimates ( 6 )00.249600.2539000
(p-val)(NA )(0.0323 )(NA )(0.0396 )(NA )(NA )(NA )
Estimates ( 7 )NANANANANANANA
(p-val)(NA )(NA )(NA )(NA )(NA )(NA )(NA )
Estimates ( 8 )NANANANANANANA
(p-val)(NA )(NA )(NA )(NA )(NA )(NA )(NA )
Estimates ( 9 )NANANANANANANA
(p-val)(NA )(NA )(NA )(NA )(NA )(NA )(NA )
Estimates ( 10 )NANANANANANANA
(p-val)(NA )(NA )(NA )(NA )(NA )(NA )(NA )
Estimates ( 11 )NANANANANANANA
(p-val)(NA )(NA )(NA )(NA )(NA )(NA )(NA )
Estimates ( 12 )NANANANANANANA
(p-val)(NA )(NA )(NA )(NA )(NA )(NA )(NA )
Estimates ( 13 )NANANANANANANA
(p-val)(NA )(NA )(NA )(NA )(NA )(NA )(NA )


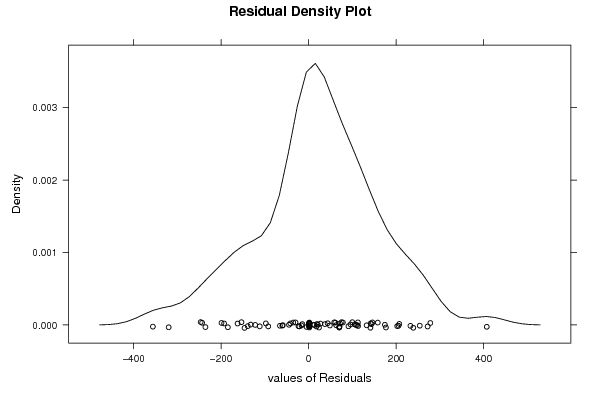
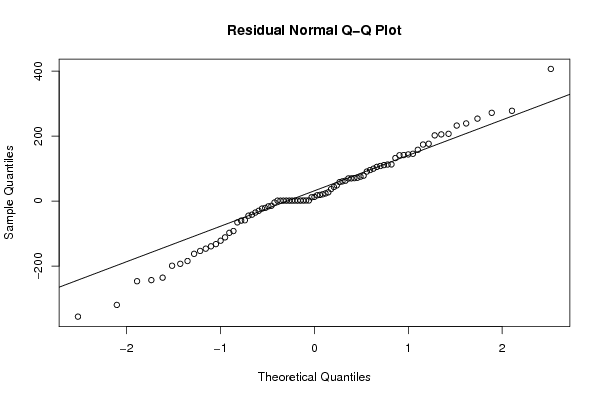
Estimated ARIMA Residuals
Value
1.48963325905238
207.165720512488
37.2431264908747
205.463437585656
-199.036329825086
-121.987694991902
-132.406810619195
69.7493357208478
271.860941273313
278.066311007672
-65.5056468524442
176.632592443543
-146.436470255707
-319.705221197478
406.942788935114
-92.1902319083046
-243.269566417465
-246.632418997599
105.389665955035
78.2988442357352
141.792828169287
18.0312315935472
-4.42104847609346
132.544833516963
145.683497294327
112.65235578242
91.0292479551028
-41.8307197130136
108.101283629296
-14.3081487561561
-153.425118605413
-58.9513915103967
-193.099575914879
23.7199599569083
13.0214219089577
48.5239245903928
-355.762847872146
-44.881658576334
-35.1227859403323
-235.734673433758
11.8492797109304
-60.0796729668139
143.756708677495
70.0950336916953
253.895232359247
-97.677916580303
174.175138808632
-29.8513055806457
71.8574448203922
110.878012566709
60.957880045987
232.631580792684
21.0288681894899
-16.1025336813791
113.003273570372
95.7293861906514
-23.0667578704333
70.7127607373
-21.0558962425882
27.0928011933997
75.2732309377614
58.5015303363928
-184.489260966090
99.8606222338137
43.5569039717584
-111.645396823553
202.442636044985
157.980355029895
-162.304685684308
239.148080661077
62.7652935289443
19.0810950587088
141.171522880526
-139.145241147086

\begin{tabular}{lllllllll}
\hline
Estimated ARIMA Residuals \tabularnewline
Value \tabularnewline
1.48963325905238 \tabularnewline
207.165720512488 \tabularnewline
37.2431264908747 \tabularnewline
205.463437585656 \tabularnewline
-199.036329825086 \tabularnewline
-121.987694991902 \tabularnewline
-132.406810619195 \tabularnewline
69.7493357208478 \tabularnewline
271.860941273313 \tabularnewline
278.066311007672 \tabularnewline
-65.5056468524442 \tabularnewline
176.632592443543 \tabularnewline
-146.436470255707 \tabularnewline
-319.705221197478 \tabularnewline
406.942788935114 \tabularnewline
-92.1902319083046 \tabularnewline
-243.269566417465 \tabularnewline
-246.632418997599 \tabularnewline
105.389665955035 \tabularnewline
78.2988442357352 \tabularnewline
141.792828169287 \tabularnewline
18.0312315935472 \tabularnewline
-4.42104847609346 \tabularnewline
132.544833516963 \tabularnewline
145.683497294327 \tabularnewline
112.65235578242 \tabularnewline
91.0292479551028 \tabularnewline
-41.8307197130136 \tabularnewline
108.101283629296 \tabularnewline
-14.3081487561561 \tabularnewline
-153.425118605413 \tabularnewline
-58.9513915103967 \tabularnewline
-193.099575914879 \tabularnewline
23.7199599569083 \tabularnewline
13.0214219089577 \tabularnewline
48.5239245903928 \tabularnewline
-355.762847872146 \tabularnewline
-44.881658576334 \tabularnewline
-35.1227859403323 \tabularnewline
-235.734673433758 \tabularnewline
11.8492797109304 \tabularnewline
-60.0796729668139 \tabularnewline
143.756708677495 \tabularnewline
70.0950336916953 \tabularnewline
253.895232359247 \tabularnewline
-97.677916580303 \tabularnewline
174.175138808632 \tabularnewline
-29.8513055806457 \tabularnewline
71.8574448203922 \tabularnewline
110.878012566709 \tabularnewline
60.957880045987 \tabularnewline
232.631580792684 \tabularnewline
21.0288681894899 \tabularnewline
-16.1025336813791 \tabularnewline
113.003273570372 \tabularnewline
95.7293861906514 \tabularnewline
-23.0667578704333 \tabularnewline
70.7127607373 \tabularnewline
-21.0558962425882 \tabularnewline
27.0928011933997 \tabularnewline
75.2732309377614 \tabularnewline
58.5015303363928 \tabularnewline
-184.489260966090 \tabularnewline
99.8606222338137 \tabularnewline
43.5569039717584 \tabularnewline
-111.645396823553 \tabularnewline
202.442636044985 \tabularnewline
157.980355029895 \tabularnewline
-162.304685684308 \tabularnewline
239.148080661077 \tabularnewline
62.7652935289443 \tabularnewline
19.0810950587088 \tabularnewline
141.171522880526 \tabularnewline
-139.145241147086 \tabularnewline
\hline
\end{tabular}
%Source: https://freestatistics.org/blog/index.php?pk=30943&T=2

[TABLE]
[ROW][C]Estimated ARIMA Residuals[/C][/ROW]
[ROW][C]Value[/C][/ROW]
[ROW][C]1.48963325905238[/C][/ROW]
[ROW][C]207.165720512488[/C][/ROW]
[ROW][C]37.2431264908747[/C][/ROW]
[ROW][C]205.463437585656[/C][/ROW]
[ROW][C]-199.036329825086[/C][/ROW]
[ROW][C]-121.987694991902[/C][/ROW]
[ROW][C]-132.406810619195[/C][/ROW]
[ROW][C]69.7493357208478[/C][/ROW]
[ROW][C]271.860941273313[/C][/ROW]
[ROW][C]278.066311007672[/C][/ROW]
[ROW][C]-65.5056468524442[/C][/ROW]
[ROW][C]176.632592443543[/C][/ROW]
[ROW][C]-146.436470255707[/C][/ROW]
[ROW][C]-319.705221197478[/C][/ROW]
[ROW][C]406.942788935114[/C][/ROW]
[ROW][C]-92.1902319083046[/C][/ROW]
[ROW][C]-243.269566417465[/C][/ROW]
[ROW][C]-246.632418997599[/C][/ROW]
[ROW][C]105.389665955035[/C][/ROW]
[ROW][C]78.2988442357352[/C][/ROW]
[ROW][C]141.792828169287[/C][/ROW]
[ROW][C]18.0312315935472[/C][/ROW]
[ROW][C]-4.42104847609346[/C][/ROW]
[ROW][C]132.544833516963[/C][/ROW]
[ROW][C]145.683497294327[/C][/ROW]
[ROW][C]112.65235578242[/C][/ROW]
[ROW][C]91.0292479551028[/C][/ROW]
[ROW][C]-41.8307197130136[/C][/ROW]
[ROW][C]108.101283629296[/C][/ROW]
[ROW][C]-14.3081487561561[/C][/ROW]
[ROW][C]-153.425118605413[/C][/ROW]
[ROW][C]-58.9513915103967[/C][/ROW]
[ROW][C]-193.099575914879[/C][/ROW]
[ROW][C]23.7199599569083[/C][/ROW]
[ROW][C]13.0214219089577[/C][/ROW]
[ROW][C]48.5239245903928[/C][/ROW]
[ROW][C]-355.762847872146[/C][/ROW]
[ROW][C]-44.881658576334[/C][/ROW]
[ROW][C]-35.1227859403323[/C][/ROW]
[ROW][C]-235.734673433758[/C][/ROW]
[ROW][C]11.8492797109304[/C][/ROW]
[ROW][C]-60.0796729668139[/C][/ROW]
[ROW][C]143.756708677495[/C][/ROW]
[ROW][C]70.0950336916953[/C][/ROW]
[ROW][C]253.895232359247[/C][/ROW]
[ROW][C]-97.677916580303[/C][/ROW]
[ROW][C]174.175138808632[/C][/ROW]
[ROW][C]-29.8513055806457[/C][/ROW]
[ROW][C]71.8574448203922[/C][/ROW]
[ROW][C]110.878012566709[/C][/ROW]
[ROW][C]60.957880045987[/C][/ROW]
[ROW][C]232.631580792684[/C][/ROW]
[ROW][C]21.0288681894899[/C][/ROW]
[ROW][C]-16.1025336813791[/C][/ROW]
[ROW][C]113.003273570372[/C][/ROW]
[ROW][C]95.7293861906514[/C][/ROW]
[ROW][C]-23.0667578704333[/C][/ROW]
[ROW][C]70.7127607373[/C][/ROW]
[ROW][C]-21.0558962425882[/C][/ROW]
[ROW][C]27.0928011933997[/C][/ROW]
[ROW][C]75.2732309377614[/C][/ROW]
[ROW][C]58.5015303363928[/C][/ROW]
[ROW][C]-184.489260966090[/C][/ROW]
[ROW][C]99.8606222338137[/C][/ROW]
[ROW][C]43.5569039717584[/C][/ROW]
[ROW][C]-111.645396823553[/C][/ROW]
[ROW][C]202.442636044985[/C][/ROW]
[ROW][C]157.980355029895[/C][/ROW]
[ROW][C]-162.304685684308[/C][/ROW]
[ROW][C]239.148080661077[/C][/ROW]
[ROW][C]62.7652935289443[/C][/ROW]
[ROW][C]19.0810950587088[/C][/ROW]
[ROW][C]141.171522880526[/C][/ROW]
[ROW][C]-139.145241147086[/C][/ROW]
[/TABLE]
Source: https://freestatistics.org/blog/index.php?pk=30943&T=2

Globally Unique Identifier (entire table): ba.freestatistics.org/blog/index.php?pk=30943&T=2

As an alternative you can also use a QR Code:  

The GUIDs for individual cells are displayed in the table below:

Estimated ARIMA Residuals
Value
1.48963325905238
207.165720512488
37.2431264908747
205.463437585656
-199.036329825086
-121.987694991902
-132.406810619195
69.7493357208478
271.860941273313
278.066311007672
-65.5056468524442
176.632592443543
-146.436470255707
-319.705221197478
406.942788935114
-92.1902319083046
-243.269566417465
-246.632418997599
105.389665955035
78.2988442357352
141.792828169287
18.0312315935472
-4.42104847609346
132.544833516963
145.683497294327
112.65235578242
91.0292479551028
-41.8307197130136
108.101283629296
-14.3081487561561
-153.425118605413
-58.9513915103967
-193.099575914879
23.7199599569083
13.0214219089577
48.5239245903928
-355.762847872146
-44.881658576334
-35.1227859403323
-235.734673433758
11.8492797109304
-60.0796729668139
143.756708677495
70.0950336916953
253.895232359247
-97.677916580303
174.175138808632
-29.8513055806457
71.8574448203922
110.878012566709
60.957880045987
232.631580792684
21.0288681894899
-16.1025336813791
113.003273570372
95.7293861906514
-23.0667578704333
70.7127607373
-21.0558962425882
27.0928011933997
75.2732309377614
58.5015303363928
-184.489260966090
99.8606222338137
43.5569039717584
-111.645396823553
202.442636044985
157.980355029895
-162.304685684308
239.148080661077
62.7652935289443
19.0810950587088
141.171522880526
-139.145241147086


Parameters (Session):
par1 = 1 ; par2 = 0 ; par3 = 1 ; par4 = 12 ;
Parameters (R input):
par1 = FALSE ; par2 = 1.6 ; par3 = 0 ; par4 = 1 ; par5 = 12 ; par6 = 3 ; par7 = 1 ; par8 = 2 ; par9 = 1 ;
R code (references can be found in the software module):
library(lattice)
if (par1 == 'TRUE') par1 <- TRUE
if (par1 == 'FALSE') par1 <- FALSE
par2 <- as.numeric(par2) #Box-Cox lambda transformation parameter
par3 <- as.numeric(par3) #degree of non-seasonal differencing
par4 <- as.numeric(par4) #degree of seasonal differencing
par5 <- as.numeric(par5) #seasonal period
par6 <- as.numeric(par6) #degree (p) of the non-seasonal AR(p) polynomial
par7 <- as.numeric(par7) #degree (q) of the non-seasonal MA(q) polynomial
par8 <- as.numeric(par8) #degree (P) of the seasonal AR(P) polynomial
par9 <- as.numeric(par9) #degree (Q) of the seasonal MA(Q) polynomial
armaGR <- function(arima.out, names, n){
try1 <- arima.out$coef
try2 <- sqrt(diag(arima.out$var.coef))
try.data.frame <- data.frame(matrix(NA,ncol=4,nrow=length(names)))
dimnames(try.data.frame) <- list(names,c('coef','std','tstat','pv'))
try.data.frame[,1] <- try1
for(i in 1:length(try2)) try.data.frame[which(rownames(try.data.frame)==names(try2)[i]),2] <- try2[i]
try.data.frame[,3] <- try.data.frame[,1] / try.data.frame[,2]
try.data.frame[,4] <- round((1-pt(abs(try.data.frame[,3]),df=n-(length(try2)+1)))*2,5)
vector <- rep(NA,length(names))
vector[is.na(try.data.frame[,4])] <- 0
maxi <- which.max(try.data.frame[,4])
continue <- max(try.data.frame[,4],na.rm=TRUE) > .05
vector[maxi] <- 0
list(summary=try.data.frame,next.vector=vector,continue=continue)
}
arimaSelect <- function(series, order=c(13,0,0), seasonal=list(order=c(2,0,0),period=12), include.mean=F){
nrc <- order[1]+order[3]+seasonal$order[1]+seasonal$order[3]
coeff <- matrix(NA, nrow=nrc*2, ncol=nrc)
pval <- matrix(NA, nrow=nrc*2, ncol=nrc)
mylist <- rep(list(NULL), nrc)
names <- NULL
if(order[1] > 0) names <- paste('ar',1:order[1],sep='')
if(order[3] > 0) names <- c( names , paste('ma',1:order[3],sep='') )
if(seasonal$order[1] > 0) names <- c(names, paste('sar',1:seasonal$order[1],sep=''))
if(seasonal$order[3] > 0) names <- c(names, paste('sma',1:seasonal$order[3],sep=''))
arima.out <- arima(series, order=order, seasonal=seasonal, include.mean=include.mean, method='ML')
mylist[[1]] <- arima.out
last.arma <- armaGR(arima.out, names, length(series))
mystop <- FALSE
i <- 1
coeff[i,] <- last.arma[[1]][,1]
pval [i,] <- last.arma[[1]][,4]
i <- 2
aic <- arima.out$aic
while(!mystop){
mylist[[i]] <- arima.out
arima.out <- arima(series, order=order, seasonal=seasonal, include.mean=include.mean, method='ML', fixed=last.arma$next.vector)
aic <- c(aic, arima.out$aic)
last.arma <- armaGR(arima.out, names, length(series))
mystop <- !last.arma$continue
coeff[i,] <- last.arma[[1]][,1]
pval [i,] <- last.arma[[1]][,4]
i <- i+1
}
list(coeff, pval, mylist, aic=aic)
}
arimaSelectplot <- function(arimaSelect.out,noms,choix){
noms <- names(arimaSelect.out[[3]][[1]]$coef)
coeff <- arimaSelect.out[[1]]
k <- min(which(is.na(coeff[,1])))-1
coeff <- coeff[1:k,]
pval <- arimaSelect.out[[2]][1:k,]
aic <- arimaSelect.out$aic[1:k]
coeff[coeff==0] <- NA
n <- ncol(coeff)
if(missing(choix)) choix <- k
layout(matrix(c(1,1,1,2,
3,3,3,2,
3,3,3,4,
5,6,7,7),nr=4),
widths=c(10,35,45,15),
heights=c(30,30,15,15))
couleurs <- rainbow(75)[1:50]#(50)
ticks <- pretty(coeff)
par(mar=c(1,1,3,1))
plot(aic,k:1-.5,type='o',pch=21,bg='blue',cex=2,axes=F,lty=2,xpd=NA)
points(aic[choix],k-choix+.5,pch=21,cex=4,bg=2,xpd=NA)
title('aic',line=2)
par(mar=c(3,0,0,0))
plot(0,axes=F,xlab='',ylab='',xlim=range(ticks),ylim=c(.1,1))
rect(xleft = min(ticks) + (0:49)/50*(max(ticks)-min(ticks)),
xright = min(ticks) + (1:50)/50*(max(ticks)-min(ticks)),
ytop = rep(1,50),
ybottom= rep(0,50),col=couleurs,border=NA)
axis(1,ticks)
rect(xleft=min(ticks),xright=max(ticks),ytop=1,ybottom=0)
text(mean(coeff,na.rm=T),.5,'coefficients',cex=2,font=2)
par(mar=c(1,1,3,1))
image(1:n,1:k,t(coeff[k:1,]),axes=F,col=couleurs,zlim=range(ticks))
for(i in 1:n) for(j in 1:k) if(!is.na(coeff[j,i])) {
if(pval[j,i]<.01) symb = 'green'
else if( (pval[j,i]<.05) & (pval[j,i]>=.01)) symb = 'orange'
else if( (pval[j,i]<.1) & (pval[j,i]>=.05)) symb = 'red'
else symb = 'black'
polygon(c(i+.5 ,i+.2 ,i+.5 ,i+.5),
c(k-j+0.5,k-j+0.5,k-j+0.8,k-j+0.5),
col=symb)
if(j==choix) {
rect(xleft=i-.5,
xright=i+.5,
ybottom=k-j+1.5,
ytop=k-j+.5,
lwd=4)
text(i,
k-j+1,
round(coeff[j,i],2),
cex=1.2,
font=2)
}
else{
rect(xleft=i-.5,xright=i+.5,ybottom=k-j+1.5,ytop=k-j+.5)
text(i,k-j+1,round(coeff[j,i],2),cex=1.2,font=1)
}
}
axis(3,1:n,noms)
par(mar=c(0.5,0,0,0.5))
plot(0,axes=F,xlab='',ylab='',type='n',xlim=c(0,8),ylim=c(-.2,.8))
cols <- c('green','orange','red','black')
niv <- c('0','0.01','0.05','0.1')
for(i in 0:3){
polygon(c(1+2*i ,1+2*i ,1+2*i-.5 ,1+2*i),
c(.4 ,.7 , .4 , .4),
col=cols[i+1])
text(2*i,0.5,niv[i+1],cex=1.5)
}
text(8,.5,1,cex=1.5)
text(4,0,'p-value',cex=2)
box()
residus <- arimaSelect.out[[3]][[choix]]$res
par(mar=c(1,2,4,1))
acf(residus,main='')
title('acf',line=.5)
par(mar=c(1,2,4,1))
pacf(residus,main='')
title('pacf',line=.5)
par(mar=c(2,2,4,1))
qqnorm(residus,main='')
title('qq-norm',line=.5)
qqline(residus)
residus
}
if (par2 == 0) x <- log(x)
if (par2 != 0) x <- x^par2
(selection <- arimaSelect(x, order=c(par6,par3,par7), seasonal=list(order=c(par8,par4,par9), period=par5)))
bitmap(file='test1.png')
resid <- arimaSelectplot(selection)
dev.off()
resid
bitmap(file='test2.png')
acf(resid,length(resid)/2, main='Residual Autocorrelation Function')
dev.off()
bitmap(file='test3.png')
pacf(resid,length(resid)/2, main='Residual Partial Autocorrelation Function')
dev.off()
bitmap(file='test4.png')
cpgram(resid, main='Residual Cumulative Periodogram')
dev.off()
bitmap(file='test5.png')
hist(resid, main='Residual Histogram', xlab='values of Residuals')
dev.off()
bitmap(file='test6.png')
densityplot(~resid,col='black',main='Residual Density Plot', xlab='values of Residuals')
dev.off()
bitmap(file='test7.png')
qqnorm(resid, main='Residual Normal Q-Q Plot')
qqline(resid)
dev.off()
ncols <- length(selection[[1]][1,])
nrows <- length(selection[[2]][,1])-1
load(file='createtable')
a<-table.start()
a<-table.row.start(a)
a<-table.element(a,'ARIMA Parameter Estimation and Backward Selection', ncols+1,TRUE)
a<-table.row.end(a)
a<-table.row.start(a)
a<-table.element(a,'Iteration', header=TRUE)
for (i in 1:ncols) {
a<-table.element(a,names(selection[[3]][[1]]$coef)[i],header=TRUE)
}
a<-table.row.end(a)
for (j in 1:nrows) {
a<-table.row.start(a)
mydum <- 'Estimates ('
mydum <- paste(mydum,j)
mydum <- paste(mydum,')')
a<-table.element(a,mydum, header=TRUE)
for (i in 1:ncols) {
a<-table.element(a,round(selection[[1]][j,i],4))
}
a<-table.row.end(a)
a<-table.row.start(a)
a<-table.element(a,'(p-val)', header=TRUE)
for (i in 1:ncols) {
mydum <- '('
mydum <- paste(mydum,round(selection[[2]][j,i],4),sep='')
mydum <- paste(mydum,')')
a<-table.element(a,mydum)
}
a<-table.row.end(a)
}
a<-table.end(a)
table.save(a,file='mytable.tab')
a<-table.start()
a<-table.row.start(a)
a<-table.element(a,'Estimated ARIMA Residuals', 1,TRUE)
a<-table.row.end(a)
a<-table.row.start(a)
a<-table.element(a,'Value', 1,TRUE)
a<-table.row.end(a)
for (i in (par4*par5+par3):length(resid)) {
a<-table.row.start(a)
a<-table.element(a,resid[i])
a<-table.row.end(a)
}
a<-table.end(a)
table.save(a,file='mytable1.tab')