Free Statistics

of Irreproducible Research!

Author's title

Author*Unverified author*
R Software Modulerwasp_autocorrelation.wasp
Title produced by software(Partial) Autocorrelation Function
Date of computationMon, 08 Dec 2008 13:06:19 -0700
Cite this page as followsStatistical Computations at FreeStatistics.org, Office for Research Development and Education, URL https://freestatistics.org/blog/index.php?v=date/2008/Dec/08/t1228766873v1ztg1tl6s049q2.htm/, Retrieved Thu, 16 May 2024 18:11:52 +0000
Statistical Computations at FreeStatistics.org, Office for Research Development and Education, URL https://freestatistics.org/blog/index.php?pk=30905, Retrieved Thu, 16 May 2024 18:11:52 +0000
QR Codes:

Original text written by user:
IsPrivate?No (this computation is public)
User-defined keywords
Estimated Impact173
Family? (F = Feedback message, R = changed R code, M = changed R Module, P = changed Parameters, D = changed Data)
F     [Spectral Analysis] [Diff Spectral] [2008-12-06 12:07:42] [74be16979710d4c4e7c6647856088456]
F RMP   [ARIMA Backward Selection] [Arima backward] [2008-12-06 14:19:09] [74be16979710d4c4e7c6647856088456]
- RMPD    [(Partial) Autocorrelation Function] [ACF int prod] [2008-12-08 19:55:18] [11edab5c4db3615abbf782b1c6e7cacf]
-   P         [(Partial) Autocorrelation Function] [ACF en PACF inter...] [2008-12-08 20:06:19] [e1dd70d3b1099218056e8ae5041dcc2f] [Current]
Feedback Forum

Post a new message
Dataseries X:
90.7
94.3
104.6
111.1
110.8
107.2
99
99
91
96.2
96.9
96.2
100.1
99
115.4
106.9
107.1
99.3
99.2
108.3
105.6
99.5
107.4
93.1
88.1
110.7
113.1
99.6
93.6
98.6
99.6
114.3
107.8
101.2
112.5
100.5
93.9
116.2
112
106.4
95.7
96
95.8
103
102.2
98.4
111.4
86.6
91.3
107.9
101.8
104.4
93.4
100.1
98.5
112.9
101.4
107.1
110.8
90.3
95.5
111.4
113
107.5
95.9
106.3
105.2
117.2
106.9
108.2
113
97.2
99.9
108.1
118.1
109.1
93.3
112.1
111.8
112.5
116.3
110.3
117.1
103.4
96.2


Summary of computational transaction
Raw Inputview raw input (R code)
Raw Outputview raw output of R engine
Computing time2 seconds
R Server'Herman Ole Andreas Wold' @ 193.190.124.10:1001

\begin{tabular}{lllllllll}
\hline
Summary of computational transaction \tabularnewline
Raw Input & view raw input (R code)  \tabularnewline
Raw Output & view raw output of R engine  \tabularnewline
Computing time & 2 seconds \tabularnewline
R Server & 'Herman Ole Andreas Wold' @ 193.190.124.10:1001 \tabularnewline
\hline
\end{tabular}
%Source: https://freestatistics.org/blog/index.php?pk=30905&T=0

[TABLE]
[ROW][C]Summary of computational transaction[/C][/ROW]
[ROW][C]Raw Input[/C][C]view raw input (R code) [/C][/ROW]
[ROW][C]Raw Output[/C][C]view raw output of R engine [/C][/ROW]
[ROW][C]Computing time[/C][C]2 seconds[/C][/ROW]
[ROW][C]R Server[/C][C]'Herman Ole Andreas Wold' @ 193.190.124.10:1001[/C][/ROW]
[/TABLE]
Source: https://freestatistics.org/blog/index.php?pk=30905&T=0

Globally Unique Identifier (entire table): ba.freestatistics.org/blog/index.php?pk=30905&T=0

As an alternative you can also use a QR Code:  

The GUIDs for individual cells are displayed in the table below:

Summary of computational transaction
Raw Inputview raw input (R code)
Raw Outputview raw output of R engine
Computing time2 seconds
R Server'Herman Ole Andreas Wold' @ 193.190.124.10:1001


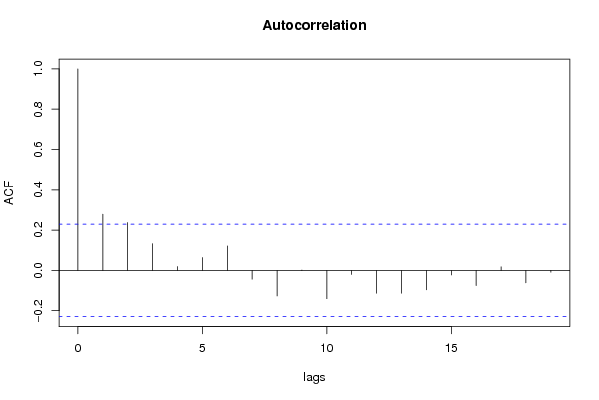
Autocorrelation Function
Time lag kACF(k)T-STATP-value
10.2789832.38360.009872
20.2377392.03120.022936
30.1330121.13650.129741
40.0190340.16260.435632
50.0637990.54510.293673
60.121771.04040.150792
7-0.043151-0.36870.356715
8-0.126781-1.08320.141139
90.0017830.01520.493943
10-0.140295-1.19870.117264
11-0.019779-0.1690.433136
12-0.11318-0.9670.168366
13-0.11323-0.96740.16826
14-0.096494-0.82440.206187
15-0.02244-0.19170.424244
16-0.075199-0.64250.261281
170.0180010.15380.439094
18-0.06132-0.52390.300963
19-0.008466-0.07230.471268

\begin{tabular}{lllllllll}
\hline
Autocorrelation Function \tabularnewline
Time lag k & ACF(k) & T-STAT & P-value \tabularnewline
1 & 0.278983 & 2.3836 & 0.009872 \tabularnewline
2 & 0.237739 & 2.0312 & 0.022936 \tabularnewline
3 & 0.133012 & 1.1365 & 0.129741 \tabularnewline
4 & 0.019034 & 0.1626 & 0.435632 \tabularnewline
5 & 0.063799 & 0.5451 & 0.293673 \tabularnewline
6 & 0.12177 & 1.0404 & 0.150792 \tabularnewline
7 & -0.043151 & -0.3687 & 0.356715 \tabularnewline
8 & -0.126781 & -1.0832 & 0.141139 \tabularnewline
9 & 0.001783 & 0.0152 & 0.493943 \tabularnewline
10 & -0.140295 & -1.1987 & 0.117264 \tabularnewline
11 & -0.019779 & -0.169 & 0.433136 \tabularnewline
12 & -0.11318 & -0.967 & 0.168366 \tabularnewline
13 & -0.11323 & -0.9674 & 0.16826 \tabularnewline
14 & -0.096494 & -0.8244 & 0.206187 \tabularnewline
15 & -0.02244 & -0.1917 & 0.424244 \tabularnewline
16 & -0.075199 & -0.6425 & 0.261281 \tabularnewline
17 & 0.018001 & 0.1538 & 0.439094 \tabularnewline
18 & -0.06132 & -0.5239 & 0.300963 \tabularnewline
19 & -0.008466 & -0.0723 & 0.471268 \tabularnewline
\hline
\end{tabular}
%Source: https://freestatistics.org/blog/index.php?pk=30905&T=1

[TABLE]
[ROW][C]Autocorrelation Function[/C][/ROW]
[ROW][C]Time lag k[/C][C]ACF(k)[/C][C]T-STAT[/C][C]P-value[/C][/ROW]
[ROW][C]1[/C][C]0.278983[/C][C]2.3836[/C][C]0.009872[/C][/ROW]
[ROW][C]2[/C][C]0.237739[/C][C]2.0312[/C][C]0.022936[/C][/ROW]
[ROW][C]3[/C][C]0.133012[/C][C]1.1365[/C][C]0.129741[/C][/ROW]
[ROW][C]4[/C][C]0.019034[/C][C]0.1626[/C][C]0.435632[/C][/ROW]
[ROW][C]5[/C][C]0.063799[/C][C]0.5451[/C][C]0.293673[/C][/ROW]
[ROW][C]6[/C][C]0.12177[/C][C]1.0404[/C][C]0.150792[/C][/ROW]
[ROW][C]7[/C][C]-0.043151[/C][C]-0.3687[/C][C]0.356715[/C][/ROW]
[ROW][C]8[/C][C]-0.126781[/C][C]-1.0832[/C][C]0.141139[/C][/ROW]
[ROW][C]9[/C][C]0.001783[/C][C]0.0152[/C][C]0.493943[/C][/ROW]
[ROW][C]10[/C][C]-0.140295[/C][C]-1.1987[/C][C]0.117264[/C][/ROW]
[ROW][C]11[/C][C]-0.019779[/C][C]-0.169[/C][C]0.433136[/C][/ROW]
[ROW][C]12[/C][C]-0.11318[/C][C]-0.967[/C][C]0.168366[/C][/ROW]
[ROW][C]13[/C][C]-0.11323[/C][C]-0.9674[/C][C]0.16826[/C][/ROW]
[ROW][C]14[/C][C]-0.096494[/C][C]-0.8244[/C][C]0.206187[/C][/ROW]
[ROW][C]15[/C][C]-0.02244[/C][C]-0.1917[/C][C]0.424244[/C][/ROW]
[ROW][C]16[/C][C]-0.075199[/C][C]-0.6425[/C][C]0.261281[/C][/ROW]
[ROW][C]17[/C][C]0.018001[/C][C]0.1538[/C][C]0.439094[/C][/ROW]
[ROW][C]18[/C][C]-0.06132[/C][C]-0.5239[/C][C]0.300963[/C][/ROW]
[ROW][C]19[/C][C]-0.008466[/C][C]-0.0723[/C][C]0.471268[/C][/ROW]
[/TABLE]
Source: https://freestatistics.org/blog/index.php?pk=30905&T=1

Globally Unique Identifier (entire table): ba.freestatistics.org/blog/index.php?pk=30905&T=1

As an alternative you can also use a QR Code:  

The GUIDs for individual cells are displayed in the table below:

Autocorrelation Function
Time lag kACF(k)T-STATP-value
10.2789832.38360.009872
20.2377392.03120.022936
30.1330121.13650.129741
40.0190340.16260.435632
50.0637990.54510.293673
60.121771.04040.150792
7-0.043151-0.36870.356715
8-0.126781-1.08320.141139
90.0017830.01520.493943
10-0.140295-1.19870.117264
11-0.019779-0.1690.433136
12-0.11318-0.9670.168366
13-0.11323-0.96740.16826
14-0.096494-0.82440.206187
15-0.02244-0.19170.424244
16-0.075199-0.64250.261281
170.0180010.15380.439094
18-0.06132-0.52390.300963
19-0.008466-0.07230.471268


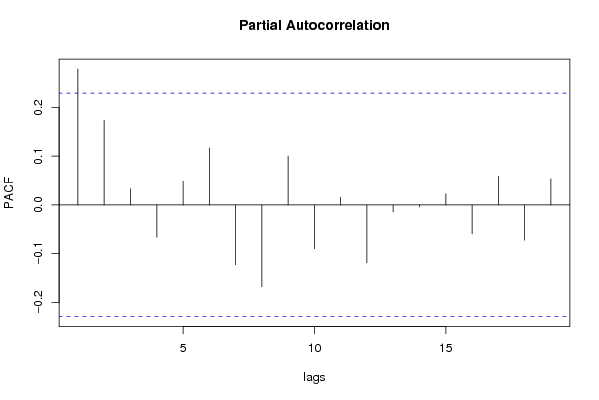
Partial Autocorrelation Function
Time lag kPACF(k)T-STATP-value
10.2789832.38360.009872
20.1734041.48160.07138
30.033330.28480.388314
4-0.066671-0.56960.285337
50.0484310.41380.340119
60.1165480.99580.161321
7-0.122802-1.04920.148769
8-0.16784-1.4340.077917
90.1003170.85710.197095
10-0.089998-0.76890.222203
110.0157410.13450.446693
12-0.118799-1.0150.156724
13-0.014585-0.12460.450586
14-0.004261-0.03640.485529
150.0227060.1940.423359
16-0.059362-0.50720.306775
170.0586240.50090.30898
18-0.072515-0.61960.268735
190.0535340.45740.324374

\begin{tabular}{lllllllll}
\hline
Partial Autocorrelation Function \tabularnewline
Time lag k & PACF(k) & T-STAT & P-value \tabularnewline
1 & 0.278983 & 2.3836 & 0.009872 \tabularnewline
2 & 0.173404 & 1.4816 & 0.07138 \tabularnewline
3 & 0.03333 & 0.2848 & 0.388314 \tabularnewline
4 & -0.066671 & -0.5696 & 0.285337 \tabularnewline
5 & 0.048431 & 0.4138 & 0.340119 \tabularnewline
6 & 0.116548 & 0.9958 & 0.161321 \tabularnewline
7 & -0.122802 & -1.0492 & 0.148769 \tabularnewline
8 & -0.16784 & -1.434 & 0.077917 \tabularnewline
9 & 0.100317 & 0.8571 & 0.197095 \tabularnewline
10 & -0.089998 & -0.7689 & 0.222203 \tabularnewline
11 & 0.015741 & 0.1345 & 0.446693 \tabularnewline
12 & -0.118799 & -1.015 & 0.156724 \tabularnewline
13 & -0.014585 & -0.1246 & 0.450586 \tabularnewline
14 & -0.004261 & -0.0364 & 0.485529 \tabularnewline
15 & 0.022706 & 0.194 & 0.423359 \tabularnewline
16 & -0.059362 & -0.5072 & 0.306775 \tabularnewline
17 & 0.058624 & 0.5009 & 0.30898 \tabularnewline
18 & -0.072515 & -0.6196 & 0.268735 \tabularnewline
19 & 0.053534 & 0.4574 & 0.324374 \tabularnewline
\hline
\end{tabular}
%Source: https://freestatistics.org/blog/index.php?pk=30905&T=2

[TABLE]
[ROW][C]Partial Autocorrelation Function[/C][/ROW]
[ROW][C]Time lag k[/C][C]PACF(k)[/C][C]T-STAT[/C][C]P-value[/C][/ROW]
[ROW][C]1[/C][C]0.278983[/C][C]2.3836[/C][C]0.009872[/C][/ROW]
[ROW][C]2[/C][C]0.173404[/C][C]1.4816[/C][C]0.07138[/C][/ROW]
[ROW][C]3[/C][C]0.03333[/C][C]0.2848[/C][C]0.388314[/C][/ROW]
[ROW][C]4[/C][C]-0.066671[/C][C]-0.5696[/C][C]0.285337[/C][/ROW]
[ROW][C]5[/C][C]0.048431[/C][C]0.4138[/C][C]0.340119[/C][/ROW]
[ROW][C]6[/C][C]0.116548[/C][C]0.9958[/C][C]0.161321[/C][/ROW]
[ROW][C]7[/C][C]-0.122802[/C][C]-1.0492[/C][C]0.148769[/C][/ROW]
[ROW][C]8[/C][C]-0.16784[/C][C]-1.434[/C][C]0.077917[/C][/ROW]
[ROW][C]9[/C][C]0.100317[/C][C]0.8571[/C][C]0.197095[/C][/ROW]
[ROW][C]10[/C][C]-0.089998[/C][C]-0.7689[/C][C]0.222203[/C][/ROW]
[ROW][C]11[/C][C]0.015741[/C][C]0.1345[/C][C]0.446693[/C][/ROW]
[ROW][C]12[/C][C]-0.118799[/C][C]-1.015[/C][C]0.156724[/C][/ROW]
[ROW][C]13[/C][C]-0.014585[/C][C]-0.1246[/C][C]0.450586[/C][/ROW]
[ROW][C]14[/C][C]-0.004261[/C][C]-0.0364[/C][C]0.485529[/C][/ROW]
[ROW][C]15[/C][C]0.022706[/C][C]0.194[/C][C]0.423359[/C][/ROW]
[ROW][C]16[/C][C]-0.059362[/C][C]-0.5072[/C][C]0.306775[/C][/ROW]
[ROW][C]17[/C][C]0.058624[/C][C]0.5009[/C][C]0.30898[/C][/ROW]
[ROW][C]18[/C][C]-0.072515[/C][C]-0.6196[/C][C]0.268735[/C][/ROW]
[ROW][C]19[/C][C]0.053534[/C][C]0.4574[/C][C]0.324374[/C][/ROW]
[/TABLE]
Source: https://freestatistics.org/blog/index.php?pk=30905&T=2

Globally Unique Identifier (entire table): ba.freestatistics.org/blog/index.php?pk=30905&T=2

As an alternative you can also use a QR Code:  

The GUIDs for individual cells are displayed in the table below:

Partial Autocorrelation Function
Time lag kPACF(k)T-STATP-value
10.2789832.38360.009872
20.1734041.48160.07138
30.033330.28480.388314
4-0.066671-0.56960.285337
50.0484310.41380.340119
60.1165480.99580.161321
7-0.122802-1.04920.148769
8-0.16784-1.4340.077917
90.1003170.85710.197095
10-0.089998-0.76890.222203
110.0157410.13450.446693
12-0.118799-1.0150.156724
13-0.014585-0.12460.450586
14-0.004261-0.03640.485529
150.0227060.1940.423359
16-0.059362-0.50720.306775
170.0586240.50090.30898
18-0.072515-0.61960.268735
190.0535340.45740.324374


Parameters (Session):
par1 = Default ; par2 = 1.6 ; par3 = 0 ; par4 = 1 ; par5 = 12 ;
Parameters (R input):
par1 = Default ; par2 = 1.6 ; par3 = 0 ; par4 = 1 ; par5 = 12 ;
R code (references can be found in the software module):
if (par1 == 'Default') {
par1 = 10*log10(length(x))
} else {
par1 <- as.numeric(par1)
}
par2 <- as.numeric(par2)
par3 <- as.numeric(par3)
par4 <- as.numeric(par4)
par5 <- as.numeric(par5)
if (par2 == 0) {
x <- log(x)
} else {
x <- (x ^ par2 - 1) / par2
}
if (par3 > 0) x <- diff(x,lag=1,difference=par3)
if (par4 > 0) x <- diff(x,lag=par5,difference=par4)
bitmap(file='pic1.png')
racf <- acf(x,par1,main='Autocorrelation',xlab='lags',ylab='ACF')
dev.off()
bitmap(file='pic2.png')
rpacf <- pacf(x,par1,main='Partial Autocorrelation',xlab='lags',ylab='PACF')
dev.off()
(myacf <- c(racf$acf))
(mypacf <- c(rpacf$acf))
lengthx <- length(x)
sqrtn <- sqrt(lengthx)
load(file='createtable')
a<-table.start()
a<-table.row.start(a)
a<-table.element(a,'Autocorrelation Function',4,TRUE)
a<-table.row.end(a)
a<-table.row.start(a)
a<-table.element(a,'Time lag k',header=TRUE)
a<-table.element(a,hyperlink('basics.htm','ACF(k)','click here for more information about the Autocorrelation Function'),header=TRUE)
a<-table.element(a,'T-STAT',header=TRUE)
a<-table.element(a,'P-value',header=TRUE)
a<-table.row.end(a)
for (i in 2:(par1+1)) {
a<-table.row.start(a)
a<-table.element(a,i-1,header=TRUE)
a<-table.element(a,round(myacf[i],6))
mytstat <- myacf[i]*sqrtn
a<-table.element(a,round(mytstat,4))
a<-table.element(a,round(1-pt(abs(mytstat),lengthx),6))
a<-table.row.end(a)
}
a<-table.end(a)
table.save(a,file='mytable.tab')
a<-table.start()
a<-table.row.start(a)
a<-table.element(a,'Partial Autocorrelation Function',4,TRUE)
a<-table.row.end(a)
a<-table.row.start(a)
a<-table.element(a,'Time lag k',header=TRUE)
a<-table.element(a,hyperlink('basics.htm','PACF(k)','click here for more information about the Partial Autocorrelation Function'),header=TRUE)
a<-table.element(a,'T-STAT',header=TRUE)
a<-table.element(a,'P-value',header=TRUE)
a<-table.row.end(a)
for (i in 1:par1) {
a<-table.row.start(a)
a<-table.element(a,i,header=TRUE)
a<-table.element(a,round(mypacf[i],6))
mytstat <- mypacf[i]*sqrtn
a<-table.element(a,round(mytstat,4))
a<-table.element(a,round(1-pt(abs(mytstat),lengthx),6))
a<-table.row.end(a)
}
a<-table.end(a)
table.save(a,file='mytable1.tab')