Free Statistics

of Irreproducible Research!

Author's title

Author*The author of this computation has been verified*
R Software Modulerwasp_autocorrelation.wasp
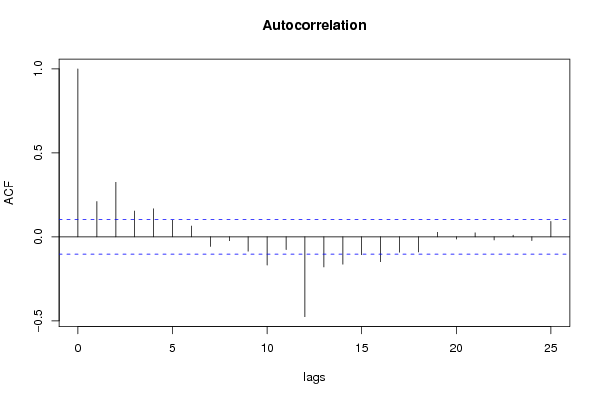
Title produced by software(Partial) Autocorrelation Function
Date of computationMon, 08 Dec 2008 13:00:12 -0700
Cite this page as followsStatistical Computations at FreeStatistics.org, Office for Research Development and Education, URL https://freestatistics.org/blog/index.php?v=date/2008/Dec/08/t12287664591bhwjr70n49u9mj.htm/, Retrieved Thu, 16 May 2024 07:48:09 +0000
Statistical Computations at FreeStatistics.org, Office for Research Development and Education, URL https://freestatistics.org/blog/index.php?pk=30887, Retrieved Thu, 16 May 2024 07:48:09 +0000
QR Codes:

Original text written by user:
IsPrivate?No (this computation is public)
User-defined keywords
Estimated Impact156
Family? (F = Feedback message, R = changed R code, M = changed R Module, P = changed Parameters, D = changed Data)
F       [(Partial) Autocorrelation Function] [step 3] [2008-12-08 20:00:12] [6912578025c824de531bc660dd61b996] [Current]
F         [(Partial) Autocorrelation Function] [part 3] [2008-12-09 07:30:09] [b47fceb71c9525e79a89b5fc6d023d0e]
-   P     [(Partial) Autocorrelation Function] [Hercomputatie fee...] [2008-12-12 21:39:27] [deb3c14ac9e4607a6d84fc9d0e0e6cc2]
Feedback Forum
2008-12-12 21:40:46 [Kim Wester] [reply
Vergeet de lambda-waarde niet in te vullen!

Herberekening met lambda-waarde 0,5:
http://www.freestatistics.org/blog/index.php?v=date/2008/Dec/12/t12291180065ajrz9jcqf2spuz.htm
2008-12-13 11:57:47 [Kevin Engels] [reply
Wanneer we d en D gaan instellen op 1, mogen we weer niet vergeten de time lags op 60 in te stellen!

http://www.freestatistics.org/blog/index.php?v=date/2008/Dec/07/t1228654489ncfa0492hqc02zw.htm
2008-12-13 13:01:54 [Ellen Smolders] [reply
De student heeft de juiste parameters ingevuld. Toevoeging:
We zien dat er nog steeds een patroon aanwezig is. Dit patroon gaan we later wegwerken door een seizoenaal ARMA proces. We hebben de tijdreeks hier echter stationair gemaakt. Het lange termijn patroon en de meeste seizoenaliteit hebben we weggewerkt.
2008-12-13 14:37:41 [An De Koninck] [reply
De lange termijntrend is in dit model volledig weggewerkt. Er is nog wel sprake van seizonaliteit.
Deze zouden we kunnen wegwerken door paramter D te laten variëren. Deze staat echter al ingesteld op 1. Tijdens het hoorcollege en bij de VRM kwamen we echter al te weten dat het model waarbij d = 1 en D = 1 het beste is. Daarom wordt er niet verder gedifferentieerd.

Om de resterende autocorrelatie weg te werken, kunnen de ARMA-modellen gebruikt worden.
2008-12-15 13:20:03 [Kristof Augustyns] [reply
We kunnen hier stellen dat het om een AR proces gaat.
Onze spectrum analyse uit voorgaande vragen bevestigt dit.

De orde aflezen doen we via de partial autocorrelation.
De eerste twee staafjes zijn significant verschillend van 0. Het derde is echter een twijfelgeval.
We bekomen een p die gelijk is aan 3

Om P te bepalen moeten we kijken naar seizoenaliteit. Lag 12 is significant, dus seizoenaliteit.
P=0

Voor de q kijken we naar de partial correlation. De eerste 5 staafjes zijn niet negatief en convergeren niet naar 0.
q=0

Voor de Q kijken we naar de partial correlation. We stellen duidelijke seizoenaliteit vast om de 12 lags.
Voor de orde kijken we naar de autocorrelatie. Enkel lag 12 significant verschillend van 0, de rest niet.
Q=1

Samengevat bekomen we volgende waarden:
Lambda = 0,5
d = 1
D = 1
p = 3
P = 0
q = 0
Q = 1

Post a new message
Dataseries X:
235.1
280.7
264.6
240.7
201.4
240.8
241.1
223.8
206.1
174.7
203.3
220.5
299.5
347.4
338.3
327.7
351.6
396.6
438.8
395.6
363.5
378.8
357
369
464.8
479.1
431.3
366.5
326.3
355.1
331.6
261.3
249
205.5
235.6
240.9
264.9
253.8
232.3
193.8
177
213.2
207.2
180.6
188.6
175.4
199
179.6
225.8
234
200.2
183.6
178.2
203.2
208.5
191.8
172.8
148
159.4
154.5
213.2
196.4
182.8
176.4
153.6
173.2
171
151.2
161.9
157.2
201.7
236.4
356.1
398.3
403.7
384.6
365.8
368.1
367.9
347
343.3
292.9
311.5
300.9
366.9
356.9
329.7
316.2
269
289.3
266.2
253.6
233.8
228.4
253.6
260.1
306.6
309.2
309.5
271
279.9
317.9
298.4
246.7
227.3
209.1
259.9
266
320.6
308.5
282.2
262.7
263.5
313.1
284.3
252.6
250.3
246.5
312.7
333.2
446.4
511.6
515.5
506.4
483.2
522.3
509.8
460.7
405.8
375
378.5
406.8
467.8
469.8
429.8
355.8
332.7
378
360.5
334.7
319.5
323.1
363.6
352.1
411.9
388.6
416.4
360.7
338
417.2
388.4
371.1
331.5
353.7
396.7
447
533.5
565.4
542.3
488.7
467.1
531.3
496.1
444
403.4
386.3
394.1
404.1
462.1
448.1
432.3
386.3
395.2
421.9
382.9
384.2
345.5
323.4
372.6
376
462.7
487
444.2
399.3
394.9
455.4
414
375.5
347
339.4
385.8
378.8
451.8
446.1
422.5
383.1
352.8
445.3
367.5
355.1
326.2
319.8
331.8
340.9
394.1
417.2
369.9
349.2
321.4
405.7
342.9
316.5
284.2
270.9
288.8
278.8
324.4
310.9
299
273
279.3
359.2
305
282.1
250.3
246.5
257.9
266.5
315.9
318.4
295.4
266.4
245.8
362.8
324.9
294.2
289.5
295.2
290.3
272
307.4
328.7
292.9
249.1
230.4
361.5
321.7
277.2
260.7
251
257.6
241.8
287.5
292.3
274.7
254.2
230
339
318.2
287
295.8
284
271
262.7
340.6
379.4
373.3
355.2
338.4
466.9
451
422
429.2
425.9
460.7
463.6
541.4
544.2
517.5
469.4
439.4
549
533
506.1
484
457
481.5
469.5
544.7
541.2
521.5
469.7
434.4
542.6
517.3
485.7
465.8
447
426.6
411.6
467.5
484.5
451.2
417.4
379.9
484.7
455
420.8
416.5
376.3
405.6
405.8
500.8
514
475.5
430.1
414.4
538
526
488.5
520.2
504.4
568.5
610.6
818
830.9
835.9
782
762.3
856.9
820.9
769.6
752.2
724.4
723.1
719.5
817.4
803.3
752.5
689
630.4
765.5
757.7
732.2
702.6
683.3
709.5
702.2
784.8
810.9
755.6
656.8
615.1
745.3
694.1
675.7
643.7
622.1
634.6
588
689.7
673.9
647.9
568.8
545.7
632.6
643.8
593.1
579.7
546
562.9
572.5


Summary of computational transaction
Raw Inputview raw input (R code)
Raw Outputview raw output of R engine
Computing time3 seconds
R Server'Herman Ole Andreas Wold' @ 193.190.124.10:1001

\begin{tabular}{lllllllll}
\hline
Summary of computational transaction \tabularnewline
Raw Input & view raw input (R code)  \tabularnewline
Raw Output & view raw output of R engine  \tabularnewline
Computing time & 3 seconds \tabularnewline
R Server & 'Herman Ole Andreas Wold' @ 193.190.124.10:1001 \tabularnewline
\hline
\end{tabular}
%Source: https://freestatistics.org/blog/index.php?pk=30887&T=0

[TABLE]
[ROW][C]Summary of computational transaction[/C][/ROW]
[ROW][C]Raw Input[/C][C]view raw input (R code) [/C][/ROW]
[ROW][C]Raw Output[/C][C]view raw output of R engine [/C][/ROW]
[ROW][C]Computing time[/C][C]3 seconds[/C][/ROW]
[ROW][C]R Server[/C][C]'Herman Ole Andreas Wold' @ 193.190.124.10:1001[/C][/ROW]
[/TABLE]
Source: https://freestatistics.org/blog/index.php?pk=30887&T=0

Globally Unique Identifier (entire table): ba.freestatistics.org/blog/index.php?pk=30887&T=0

As an alternative you can also use a QR Code:  

The GUIDs for individual cells are displayed in the table below:

Summary of computational transaction
Raw Inputview raw input (R code)
Raw Outputview raw output of R engine
Computing time3 seconds
R Server'Herman Ole Andreas Wold' @ 193.190.124.10:1001


Autocorrelation Function
Time lag kACF(k)T-STATP-value
10.2101413.98164.1e-05
20.3251316.16030
30.1532752.90410.001955
40.1672523.1690.000831
50.0991561.87870.030545
60.0645131.22230.111191
7-0.057203-1.08380.13958
8-0.023244-0.44040.329956
9-0.085115-1.61270.053845
10-0.168424-3.19120.000771
11-0.075939-1.43880.075533
12-0.475334-9.00630
13-0.179215-3.39560.000381
14-0.162819-3.0850.001097
15-0.106644-2.02060.02203
16-0.147945-2.80320.002668
17-0.091478-1.73330.041954
18-0.089745-1.70040.044958
190.0273280.51780.302458
20-0.012913-0.24470.403425
210.0241990.45850.323437
22-0.018741-0.35510.361367
230.0095670.18130.42813
24-0.022226-0.42110.336957
250.0919741.74270.041125

\begin{tabular}{lllllllll}
\hline
Autocorrelation Function \tabularnewline
Time lag k & ACF(k) & T-STAT & P-value \tabularnewline
1 & 0.210141 & 3.9816 & 4.1e-05 \tabularnewline
2 & 0.325131 & 6.1603 & 0 \tabularnewline
3 & 0.153275 & 2.9041 & 0.001955 \tabularnewline
4 & 0.167252 & 3.169 & 0.000831 \tabularnewline
5 & 0.099156 & 1.8787 & 0.030545 \tabularnewline
6 & 0.064513 & 1.2223 & 0.111191 \tabularnewline
7 & -0.057203 & -1.0838 & 0.13958 \tabularnewline
8 & -0.023244 & -0.4404 & 0.329956 \tabularnewline
9 & -0.085115 & -1.6127 & 0.053845 \tabularnewline
10 & -0.168424 & -3.1912 & 0.000771 \tabularnewline
11 & -0.075939 & -1.4388 & 0.075533 \tabularnewline
12 & -0.475334 & -9.0063 & 0 \tabularnewline
13 & -0.179215 & -3.3956 & 0.000381 \tabularnewline
14 & -0.162819 & -3.085 & 0.001097 \tabularnewline
15 & -0.106644 & -2.0206 & 0.02203 \tabularnewline
16 & -0.147945 & -2.8032 & 0.002668 \tabularnewline
17 & -0.091478 & -1.7333 & 0.041954 \tabularnewline
18 & -0.089745 & -1.7004 & 0.044958 \tabularnewline
19 & 0.027328 & 0.5178 & 0.302458 \tabularnewline
20 & -0.012913 & -0.2447 & 0.403425 \tabularnewline
21 & 0.024199 & 0.4585 & 0.323437 \tabularnewline
22 & -0.018741 & -0.3551 & 0.361367 \tabularnewline
23 & 0.009567 & 0.1813 & 0.42813 \tabularnewline
24 & -0.022226 & -0.4211 & 0.336957 \tabularnewline
25 & 0.091974 & 1.7427 & 0.041125 \tabularnewline
\hline
\end{tabular}
%Source: https://freestatistics.org/blog/index.php?pk=30887&T=1

[TABLE]
[ROW][C]Autocorrelation Function[/C][/ROW]
[ROW][C]Time lag k[/C][C]ACF(k)[/C][C]T-STAT[/C][C]P-value[/C][/ROW]
[ROW][C]1[/C][C]0.210141[/C][C]3.9816[/C][C]4.1e-05[/C][/ROW]
[ROW][C]2[/C][C]0.325131[/C][C]6.1603[/C][C]0[/C][/ROW]
[ROW][C]3[/C][C]0.153275[/C][C]2.9041[/C][C]0.001955[/C][/ROW]
[ROW][C]4[/C][C]0.167252[/C][C]3.169[/C][C]0.000831[/C][/ROW]
[ROW][C]5[/C][C]0.099156[/C][C]1.8787[/C][C]0.030545[/C][/ROW]
[ROW][C]6[/C][C]0.064513[/C][C]1.2223[/C][C]0.111191[/C][/ROW]
[ROW][C]7[/C][C]-0.057203[/C][C]-1.0838[/C][C]0.13958[/C][/ROW]
[ROW][C]8[/C][C]-0.023244[/C][C]-0.4404[/C][C]0.329956[/C][/ROW]
[ROW][C]9[/C][C]-0.085115[/C][C]-1.6127[/C][C]0.053845[/C][/ROW]
[ROW][C]10[/C][C]-0.168424[/C][C]-3.1912[/C][C]0.000771[/C][/ROW]
[ROW][C]11[/C][C]-0.075939[/C][C]-1.4388[/C][C]0.075533[/C][/ROW]
[ROW][C]12[/C][C]-0.475334[/C][C]-9.0063[/C][C]0[/C][/ROW]
[ROW][C]13[/C][C]-0.179215[/C][C]-3.3956[/C][C]0.000381[/C][/ROW]
[ROW][C]14[/C][C]-0.162819[/C][C]-3.085[/C][C]0.001097[/C][/ROW]
[ROW][C]15[/C][C]-0.106644[/C][C]-2.0206[/C][C]0.02203[/C][/ROW]
[ROW][C]16[/C][C]-0.147945[/C][C]-2.8032[/C][C]0.002668[/C][/ROW]
[ROW][C]17[/C][C]-0.091478[/C][C]-1.7333[/C][C]0.041954[/C][/ROW]
[ROW][C]18[/C][C]-0.089745[/C][C]-1.7004[/C][C]0.044958[/C][/ROW]
[ROW][C]19[/C][C]0.027328[/C][C]0.5178[/C][C]0.302458[/C][/ROW]
[ROW][C]20[/C][C]-0.012913[/C][C]-0.2447[/C][C]0.403425[/C][/ROW]
[ROW][C]21[/C][C]0.024199[/C][C]0.4585[/C][C]0.323437[/C][/ROW]
[ROW][C]22[/C][C]-0.018741[/C][C]-0.3551[/C][C]0.361367[/C][/ROW]
[ROW][C]23[/C][C]0.009567[/C][C]0.1813[/C][C]0.42813[/C][/ROW]
[ROW][C]24[/C][C]-0.022226[/C][C]-0.4211[/C][C]0.336957[/C][/ROW]
[ROW][C]25[/C][C]0.091974[/C][C]1.7427[/C][C]0.041125[/C][/ROW]
[/TABLE]
Source: https://freestatistics.org/blog/index.php?pk=30887&T=1

Globally Unique Identifier (entire table): ba.freestatistics.org/blog/index.php?pk=30887&T=1

As an alternative you can also use a QR Code:  

The GUIDs for individual cells are displayed in the table below:

Autocorrelation Function
Time lag kACF(k)T-STATP-value
10.2101413.98164.1e-05
20.3251316.16030
30.1532752.90410.001955
40.1672523.1690.000831
50.0991561.87870.030545
60.0645131.22230.111191
7-0.057203-1.08380.13958
8-0.023244-0.44040.329956
9-0.085115-1.61270.053845
10-0.168424-3.19120.000771
11-0.075939-1.43880.075533
12-0.475334-9.00630
13-0.179215-3.39560.000381
14-0.162819-3.0850.001097
15-0.106644-2.02060.02203
16-0.147945-2.80320.002668
17-0.091478-1.73330.041954
18-0.089745-1.70040.044958
190.0273280.51780.302458
20-0.012913-0.24470.403425
210.0241990.45850.323437
22-0.018741-0.35510.361367
230.0095670.18130.42813
24-0.022226-0.42110.336957
250.0919741.74270.041125


Partial Autocorrelation Function
Time lag kPACF(k)T-STATP-value
10.2101413.98164.1e-05
20.2939525.56960
30.0495440.93870.174253
40.0495340.93850.174302
50.0127410.24140.404686
6-0.02095-0.39690.34582
7-0.124687-2.36250.009343
8-0.032709-0.61970.267912
9-0.045438-0.86090.194928
10-0.146092-2.7680.002966
110.0236310.44770.327306
12-0.42914-8.1310
13-0.0237-0.4490.326836
140.1508892.85890.002249
150.0297910.56450.286395
16-0.044612-0.84530.199257
17-0.012037-0.22810.40986
180.0046480.08810.464938
190.0113030.21420.415271
200.0098230.18610.426229
21-0.009818-0.1860.426268
22-0.15669-2.96890.001595
230.0121730.23060.408859
24-0.273087-5.17430
250.0532161.00830.156993

\begin{tabular}{lllllllll}
\hline
Partial Autocorrelation Function \tabularnewline
Time lag k & PACF(k) & T-STAT & P-value \tabularnewline
1 & 0.210141 & 3.9816 & 4.1e-05 \tabularnewline
2 & 0.293952 & 5.5696 & 0 \tabularnewline
3 & 0.049544 & 0.9387 & 0.174253 \tabularnewline
4 & 0.049534 & 0.9385 & 0.174302 \tabularnewline
5 & 0.012741 & 0.2414 & 0.404686 \tabularnewline
6 & -0.02095 & -0.3969 & 0.34582 \tabularnewline
7 & -0.124687 & -2.3625 & 0.009343 \tabularnewline
8 & -0.032709 & -0.6197 & 0.267912 \tabularnewline
9 & -0.045438 & -0.8609 & 0.194928 \tabularnewline
10 & -0.146092 & -2.768 & 0.002966 \tabularnewline
11 & 0.023631 & 0.4477 & 0.327306 \tabularnewline
12 & -0.42914 & -8.131 & 0 \tabularnewline
13 & -0.0237 & -0.449 & 0.326836 \tabularnewline
14 & 0.150889 & 2.8589 & 0.002249 \tabularnewline
15 & 0.029791 & 0.5645 & 0.286395 \tabularnewline
16 & -0.044612 & -0.8453 & 0.199257 \tabularnewline
17 & -0.012037 & -0.2281 & 0.40986 \tabularnewline
18 & 0.004648 & 0.0881 & 0.464938 \tabularnewline
19 & 0.011303 & 0.2142 & 0.415271 \tabularnewline
20 & 0.009823 & 0.1861 & 0.426229 \tabularnewline
21 & -0.009818 & -0.186 & 0.426268 \tabularnewline
22 & -0.15669 & -2.9689 & 0.001595 \tabularnewline
23 & 0.012173 & 0.2306 & 0.408859 \tabularnewline
24 & -0.273087 & -5.1743 & 0 \tabularnewline
25 & 0.053216 & 1.0083 & 0.156993 \tabularnewline
\hline
\end{tabular}
%Source: https://freestatistics.org/blog/index.php?pk=30887&T=2

[TABLE]
[ROW][C]Partial Autocorrelation Function[/C][/ROW]
[ROW][C]Time lag k[/C][C]PACF(k)[/C][C]T-STAT[/C][C]P-value[/C][/ROW]
[ROW][C]1[/C][C]0.210141[/C][C]3.9816[/C][C]4.1e-05[/C][/ROW]
[ROW][C]2[/C][C]0.293952[/C][C]5.5696[/C][C]0[/C][/ROW]
[ROW][C]3[/C][C]0.049544[/C][C]0.9387[/C][C]0.174253[/C][/ROW]
[ROW][C]4[/C][C]0.049534[/C][C]0.9385[/C][C]0.174302[/C][/ROW]
[ROW][C]5[/C][C]0.012741[/C][C]0.2414[/C][C]0.404686[/C][/ROW]
[ROW][C]6[/C][C]-0.02095[/C][C]-0.3969[/C][C]0.34582[/C][/ROW]
[ROW][C]7[/C][C]-0.124687[/C][C]-2.3625[/C][C]0.009343[/C][/ROW]
[ROW][C]8[/C][C]-0.032709[/C][C]-0.6197[/C][C]0.267912[/C][/ROW]
[ROW][C]9[/C][C]-0.045438[/C][C]-0.8609[/C][C]0.194928[/C][/ROW]
[ROW][C]10[/C][C]-0.146092[/C][C]-2.768[/C][C]0.002966[/C][/ROW]
[ROW][C]11[/C][C]0.023631[/C][C]0.4477[/C][C]0.327306[/C][/ROW]
[ROW][C]12[/C][C]-0.42914[/C][C]-8.131[/C][C]0[/C][/ROW]
[ROW][C]13[/C][C]-0.0237[/C][C]-0.449[/C][C]0.326836[/C][/ROW]
[ROW][C]14[/C][C]0.150889[/C][C]2.8589[/C][C]0.002249[/C][/ROW]
[ROW][C]15[/C][C]0.029791[/C][C]0.5645[/C][C]0.286395[/C][/ROW]
[ROW][C]16[/C][C]-0.044612[/C][C]-0.8453[/C][C]0.199257[/C][/ROW]
[ROW][C]17[/C][C]-0.012037[/C][C]-0.2281[/C][C]0.40986[/C][/ROW]
[ROW][C]18[/C][C]0.004648[/C][C]0.0881[/C][C]0.464938[/C][/ROW]
[ROW][C]19[/C][C]0.011303[/C][C]0.2142[/C][C]0.415271[/C][/ROW]
[ROW][C]20[/C][C]0.009823[/C][C]0.1861[/C][C]0.426229[/C][/ROW]
[ROW][C]21[/C][C]-0.009818[/C][C]-0.186[/C][C]0.426268[/C][/ROW]
[ROW][C]22[/C][C]-0.15669[/C][C]-2.9689[/C][C]0.001595[/C][/ROW]
[ROW][C]23[/C][C]0.012173[/C][C]0.2306[/C][C]0.408859[/C][/ROW]
[ROW][C]24[/C][C]-0.273087[/C][C]-5.1743[/C][C]0[/C][/ROW]
[ROW][C]25[/C][C]0.053216[/C][C]1.0083[/C][C]0.156993[/C][/ROW]
[/TABLE]
Source: https://freestatistics.org/blog/index.php?pk=30887&T=2

Globally Unique Identifier (entire table): ba.freestatistics.org/blog/index.php?pk=30887&T=2

As an alternative you can also use a QR Code:  

The GUIDs for individual cells are displayed in the table below:

Partial Autocorrelation Function
Time lag kPACF(k)T-STATP-value
10.2101413.98164.1e-05
20.2939525.56960
30.0495440.93870.174253
40.0495340.93850.174302
50.0127410.24140.404686
6-0.02095-0.39690.34582
7-0.124687-2.36250.009343
8-0.032709-0.61970.267912
9-0.045438-0.86090.194928
10-0.146092-2.7680.002966
110.0236310.44770.327306
12-0.42914-8.1310
13-0.0237-0.4490.326836
140.1508892.85890.002249
150.0297910.56450.286395
16-0.044612-0.84530.199257
17-0.012037-0.22810.40986
180.0046480.08810.464938
190.0113030.21420.415271
200.0098230.18610.426229
21-0.009818-0.1860.426268
22-0.15669-2.96890.001595
230.0121730.23060.408859
24-0.273087-5.17430
250.0532161.00830.156993


Parameters (Session):
par1 = Default ; par2 = 1 ; par3 = 1 ; par4 = 1 ; par5 = 12 ;
Parameters (R input):
par1 = Default ; par2 = 1 ; par3 = 1 ; par4 = 1 ; par5 = 12 ;
R code (references can be found in the software module):
if (par1 == 'Default') {
par1 = 10*log10(length(x))
} else {
par1 <- as.numeric(par1)
}
par2 <- as.numeric(par2)
par3 <- as.numeric(par3)
par4 <- as.numeric(par4)
par5 <- as.numeric(par5)
if (par2 == 0) {
x <- log(x)
} else {
x <- (x ^ par2 - 1) / par2
}
if (par3 > 0) x <- diff(x,lag=1,difference=par3)
if (par4 > 0) x <- diff(x,lag=par5,difference=par4)
bitmap(file='pic1.png')
racf <- acf(x,par1,main='Autocorrelation',xlab='lags',ylab='ACF')
dev.off()
bitmap(file='pic2.png')
rpacf <- pacf(x,par1,main='Partial Autocorrelation',xlab='lags',ylab='PACF')
dev.off()
(myacf <- c(racf$acf))
(mypacf <- c(rpacf$acf))
lengthx <- length(x)
sqrtn <- sqrt(lengthx)
load(file='createtable')
a<-table.start()
a<-table.row.start(a)
a<-table.element(a,'Autocorrelation Function',4,TRUE)
a<-table.row.end(a)
a<-table.row.start(a)
a<-table.element(a,'Time lag k',header=TRUE)
a<-table.element(a,hyperlink('basics.htm','ACF(k)','click here for more information about the Autocorrelation Function'),header=TRUE)
a<-table.element(a,'T-STAT',header=TRUE)
a<-table.element(a,'P-value',header=TRUE)
a<-table.row.end(a)
for (i in 2:(par1+1)) {
a<-table.row.start(a)
a<-table.element(a,i-1,header=TRUE)
a<-table.element(a,round(myacf[i],6))
mytstat <- myacf[i]*sqrtn
a<-table.element(a,round(mytstat,4))
a<-table.element(a,round(1-pt(abs(mytstat),lengthx),6))
a<-table.row.end(a)
}
a<-table.end(a)
table.save(a,file='mytable.tab')
a<-table.start()
a<-table.row.start(a)
a<-table.element(a,'Partial Autocorrelation Function',4,TRUE)
a<-table.row.end(a)
a<-table.row.start(a)
a<-table.element(a,'Time lag k',header=TRUE)
a<-table.element(a,hyperlink('basics.htm','PACF(k)','click here for more information about the Partial Autocorrelation Function'),header=TRUE)
a<-table.element(a,'T-STAT',header=TRUE)
a<-table.element(a,'P-value',header=TRUE)
a<-table.row.end(a)
for (i in 1:par1) {
a<-table.row.start(a)
a<-table.element(a,i,header=TRUE)
a<-table.element(a,round(mypacf[i],6))
mytstat <- mypacf[i]*sqrtn
a<-table.element(a,round(mytstat,4))
a<-table.element(a,round(1-pt(abs(mytstat),lengthx),6))
a<-table.row.end(a)
}
a<-table.end(a)
table.save(a,file='mytable1.tab')