Free Statistics

of Irreproducible Research!

Author's title

Author*The author of this computation has been verified*
R Software Modulerwasp_autocorrelation.wasp
Title produced by software(Partial) Autocorrelation Function
Date of computationMon, 08 Dec 2008 12:44:59 -0700
Cite this page as followsStatistical Computations at FreeStatistics.org, Office for Research Development and Education, URL https://freestatistics.org/blog/index.php?v=date/2008/Dec/08/t1228765518j8rwthlq784cvco.htm/, Retrieved Thu, 16 May 2024 14:44:16 +0000
Statistical Computations at FreeStatistics.org, Office for Research Development and Education, URL https://freestatistics.org/blog/index.php?pk=30855, Retrieved Thu, 16 May 2024 14:44:16 +0000
QR Codes:

Original text written by user:
IsPrivate?No (this computation is public)
User-defined keywords
Estimated Impact176
Family? (F = Feedback message, R = changed R code, M = changed R Module, P = changed Parameters, D = changed Data)
F     [ARIMA Backward Selection] [] [2008-12-07 14:04:55] [74be16979710d4c4e7c6647856088456]
F RMPD    [(Partial) Autocorrelation Function] [] [2008-12-08 19:44:59] [19ef54504342c1b076371d395a2ab19f] [Current]
Feedback Forum
2008-12-15 16:25:06 [Hidde Van Kerckhoven] [reply
Ik maak hier juiste conclusies

Post a new message
Dataseries X:
22780
17351
21382
24561
17409
11514
31514
27071
29462
26105
22397
23843
21705
18089
20764
25316
17704
15548
28029
29383
36438
32034
22679
24319
18004
17537
20366
22782
19169
13807
29743
25591
29096
26482
22405
27044
17970
18730
19684
19785
18479
10698
31956
29506
34506
27165
26736
23691
18157
17328
18205
20995
17382
9367
31124
26551
30651
25859
25100
25778
20418
18688
20424
24776
19814
12738
31566
30111
30019
31934
25826
26835


Summary of computational transaction
Raw Inputview raw input (R code)
Raw Outputview raw output of R engine
Computing time1 seconds
R Server'George Udny Yule' @ 72.249.76.132

\begin{tabular}{lllllllll}
\hline
Summary of computational transaction \tabularnewline
Raw Input & view raw input (R code)  \tabularnewline
Raw Output & view raw output of R engine  \tabularnewline
Computing time & 1 seconds \tabularnewline
R Server & 'George Udny Yule' @ 72.249.76.132 \tabularnewline
\hline
\end{tabular}
%Source: https://freestatistics.org/blog/index.php?pk=30855&T=0

[TABLE]
[ROW][C]Summary of computational transaction[/C][/ROW]
[ROW][C]Raw Input[/C][C]view raw input (R code) [/C][/ROW]
[ROW][C]Raw Output[/C][C]view raw output of R engine [/C][/ROW]
[ROW][C]Computing time[/C][C]1 seconds[/C][/ROW]
[ROW][C]R Server[/C][C]'George Udny Yule' @ 72.249.76.132[/C][/ROW]
[/TABLE]
Source: https://freestatistics.org/blog/index.php?pk=30855&T=0

Globally Unique Identifier (entire table): ba.freestatistics.org/blog/index.php?pk=30855&T=0

As an alternative you can also use a QR Code:  

The GUIDs for individual cells are displayed in the table below:

Summary of computational transaction
Raw Inputview raw input (R code)
Raw Outputview raw output of R engine
Computing time1 seconds
R Server'George Udny Yule' @ 72.249.76.132


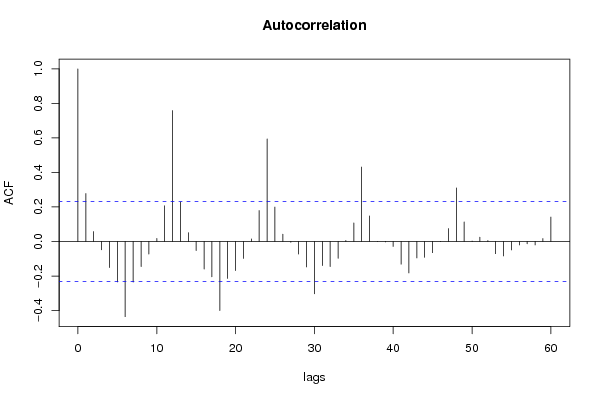
Autocorrelation Function
Time lag kACF(k)T-STATP-value
10.2780462.35930.010512
20.0574930.48780.31357
3-0.048273-0.40960.341655
4-0.151204-1.2830.101802
5-0.234595-1.99060.025161
6-0.4355-3.69530.000213
7-0.234993-1.9940.024971
8-0.145526-1.23480.110455
9-0.072724-0.61710.269562
100.0174510.14810.441347
110.2071111.75740.041551
120.7589646.440
130.2285561.93940.028188
140.0507430.43060.334034
15-0.052394-0.44460.328979
16-0.159681-1.35490.089837
17-0.204458-1.73490.043521
18-0.400433-3.39780.000555
19-0.214402-1.81930.036515
20-0.168097-1.42640.079044
21-0.098265-0.83380.203574
220.0149090.12650.449843
230.1793551.52190.06621
240.594165.04162e-06
250.1994841.69270.04742
260.0420470.35680.36115
27-0.004601-0.0390.484484
28-0.072698-0.61690.269637
29-0.147041-1.24770.108095
30-0.302952-2.57060.006109
31-0.139106-1.18040.120873
32-0.145574-1.23520.110379
33-0.097232-0.8250.206038
340.0059790.05070.479838
350.1073780.91110.182632
360.4314313.66080.000238
370.1480741.25640.106508
380.0013210.01120.495544
39-0.002421-0.02050.491835
40-0.028772-0.24410.403909
41-0.131283-1.1140.134498
42-0.182209-1.54610.063233
43-0.095496-0.81030.210217
44-0.09188-0.77960.219083
45-0.064512-0.54740.292898
46-0.000109-9e-040.499631
470.0749130.63570.263507
480.3101282.63150.005196
490.1130610.95940.170295
500.0023090.01960.49221
510.0248120.21050.416921
520.005670.04810.480879
53-0.07062-0.59920.27545
54-0.083718-0.71040.239885
55-0.048719-0.41340.340272
56-0.020098-0.17050.432532
57-0.013718-0.11640.45383
58-0.019983-0.16960.432915
590.0167190.14190.44379
600.141431.20010.117023

\begin{tabular}{lllllllll}
\hline
Autocorrelation Function \tabularnewline
Time lag k & ACF(k) & T-STAT & P-value \tabularnewline
1 & 0.278046 & 2.3593 & 0.010512 \tabularnewline
2 & 0.057493 & 0.4878 & 0.31357 \tabularnewline
3 & -0.048273 & -0.4096 & 0.341655 \tabularnewline
4 & -0.151204 & -1.283 & 0.101802 \tabularnewline
5 & -0.234595 & -1.9906 & 0.025161 \tabularnewline
6 & -0.4355 & -3.6953 & 0.000213 \tabularnewline
7 & -0.234993 & -1.994 & 0.024971 \tabularnewline
8 & -0.145526 & -1.2348 & 0.110455 \tabularnewline
9 & -0.072724 & -0.6171 & 0.269562 \tabularnewline
10 & 0.017451 & 0.1481 & 0.441347 \tabularnewline
11 & 0.207111 & 1.7574 & 0.041551 \tabularnewline
12 & 0.758964 & 6.44 & 0 \tabularnewline
13 & 0.228556 & 1.9394 & 0.028188 \tabularnewline
14 & 0.050743 & 0.4306 & 0.334034 \tabularnewline
15 & -0.052394 & -0.4446 & 0.328979 \tabularnewline
16 & -0.159681 & -1.3549 & 0.089837 \tabularnewline
17 & -0.204458 & -1.7349 & 0.043521 \tabularnewline
18 & -0.400433 & -3.3978 & 0.000555 \tabularnewline
19 & -0.214402 & -1.8193 & 0.036515 \tabularnewline
20 & -0.168097 & -1.4264 & 0.079044 \tabularnewline
21 & -0.098265 & -0.8338 & 0.203574 \tabularnewline
22 & 0.014909 & 0.1265 & 0.449843 \tabularnewline
23 & 0.179355 & 1.5219 & 0.06621 \tabularnewline
24 & 0.59416 & 5.0416 & 2e-06 \tabularnewline
25 & 0.199484 & 1.6927 & 0.04742 \tabularnewline
26 & 0.042047 & 0.3568 & 0.36115 \tabularnewline
27 & -0.004601 & -0.039 & 0.484484 \tabularnewline
28 & -0.072698 & -0.6169 & 0.269637 \tabularnewline
29 & -0.147041 & -1.2477 & 0.108095 \tabularnewline
30 & -0.302952 & -2.5706 & 0.006109 \tabularnewline
31 & -0.139106 & -1.1804 & 0.120873 \tabularnewline
32 & -0.145574 & -1.2352 & 0.110379 \tabularnewline
33 & -0.097232 & -0.825 & 0.206038 \tabularnewline
34 & 0.005979 & 0.0507 & 0.479838 \tabularnewline
35 & 0.107378 & 0.9111 & 0.182632 \tabularnewline
36 & 0.431431 & 3.6608 & 0.000238 \tabularnewline
37 & 0.148074 & 1.2564 & 0.106508 \tabularnewline
38 & 0.001321 & 0.0112 & 0.495544 \tabularnewline
39 & -0.002421 & -0.0205 & 0.491835 \tabularnewline
40 & -0.028772 & -0.2441 & 0.403909 \tabularnewline
41 & -0.131283 & -1.114 & 0.134498 \tabularnewline
42 & -0.182209 & -1.5461 & 0.063233 \tabularnewline
43 & -0.095496 & -0.8103 & 0.210217 \tabularnewline
44 & -0.09188 & -0.7796 & 0.219083 \tabularnewline
45 & -0.064512 & -0.5474 & 0.292898 \tabularnewline
46 & -0.000109 & -9e-04 & 0.499631 \tabularnewline
47 & 0.074913 & 0.6357 & 0.263507 \tabularnewline
48 & 0.310128 & 2.6315 & 0.005196 \tabularnewline
49 & 0.113061 & 0.9594 & 0.170295 \tabularnewline
50 & 0.002309 & 0.0196 & 0.49221 \tabularnewline
51 & 0.024812 & 0.2105 & 0.416921 \tabularnewline
52 & 0.00567 & 0.0481 & 0.480879 \tabularnewline
53 & -0.07062 & -0.5992 & 0.27545 \tabularnewline
54 & -0.083718 & -0.7104 & 0.239885 \tabularnewline
55 & -0.048719 & -0.4134 & 0.340272 \tabularnewline
56 & -0.020098 & -0.1705 & 0.432532 \tabularnewline
57 & -0.013718 & -0.1164 & 0.45383 \tabularnewline
58 & -0.019983 & -0.1696 & 0.432915 \tabularnewline
59 & 0.016719 & 0.1419 & 0.44379 \tabularnewline
60 & 0.14143 & 1.2001 & 0.117023 \tabularnewline
\hline
\end{tabular}
%Source: https://freestatistics.org/blog/index.php?pk=30855&T=1

[TABLE]
[ROW][C]Autocorrelation Function[/C][/ROW]
[ROW][C]Time lag k[/C][C]ACF(k)[/C][C]T-STAT[/C][C]P-value[/C][/ROW]
[ROW][C]1[/C][C]0.278046[/C][C]2.3593[/C][C]0.010512[/C][/ROW]
[ROW][C]2[/C][C]0.057493[/C][C]0.4878[/C][C]0.31357[/C][/ROW]
[ROW][C]3[/C][C]-0.048273[/C][C]-0.4096[/C][C]0.341655[/C][/ROW]
[ROW][C]4[/C][C]-0.151204[/C][C]-1.283[/C][C]0.101802[/C][/ROW]
[ROW][C]5[/C][C]-0.234595[/C][C]-1.9906[/C][C]0.025161[/C][/ROW]
[ROW][C]6[/C][C]-0.4355[/C][C]-3.6953[/C][C]0.000213[/C][/ROW]
[ROW][C]7[/C][C]-0.234993[/C][C]-1.994[/C][C]0.024971[/C][/ROW]
[ROW][C]8[/C][C]-0.145526[/C][C]-1.2348[/C][C]0.110455[/C][/ROW]
[ROW][C]9[/C][C]-0.072724[/C][C]-0.6171[/C][C]0.269562[/C][/ROW]
[ROW][C]10[/C][C]0.017451[/C][C]0.1481[/C][C]0.441347[/C][/ROW]
[ROW][C]11[/C][C]0.207111[/C][C]1.7574[/C][C]0.041551[/C][/ROW]
[ROW][C]12[/C][C]0.758964[/C][C]6.44[/C][C]0[/C][/ROW]
[ROW][C]13[/C][C]0.228556[/C][C]1.9394[/C][C]0.028188[/C][/ROW]
[ROW][C]14[/C][C]0.050743[/C][C]0.4306[/C][C]0.334034[/C][/ROW]
[ROW][C]15[/C][C]-0.052394[/C][C]-0.4446[/C][C]0.328979[/C][/ROW]
[ROW][C]16[/C][C]-0.159681[/C][C]-1.3549[/C][C]0.089837[/C][/ROW]
[ROW][C]17[/C][C]-0.204458[/C][C]-1.7349[/C][C]0.043521[/C][/ROW]
[ROW][C]18[/C][C]-0.400433[/C][C]-3.3978[/C][C]0.000555[/C][/ROW]
[ROW][C]19[/C][C]-0.214402[/C][C]-1.8193[/C][C]0.036515[/C][/ROW]
[ROW][C]20[/C][C]-0.168097[/C][C]-1.4264[/C][C]0.079044[/C][/ROW]
[ROW][C]21[/C][C]-0.098265[/C][C]-0.8338[/C][C]0.203574[/C][/ROW]
[ROW][C]22[/C][C]0.014909[/C][C]0.1265[/C][C]0.449843[/C][/ROW]
[ROW][C]23[/C][C]0.179355[/C][C]1.5219[/C][C]0.06621[/C][/ROW]
[ROW][C]24[/C][C]0.59416[/C][C]5.0416[/C][C]2e-06[/C][/ROW]
[ROW][C]25[/C][C]0.199484[/C][C]1.6927[/C][C]0.04742[/C][/ROW]
[ROW][C]26[/C][C]0.042047[/C][C]0.3568[/C][C]0.36115[/C][/ROW]
[ROW][C]27[/C][C]-0.004601[/C][C]-0.039[/C][C]0.484484[/C][/ROW]
[ROW][C]28[/C][C]-0.072698[/C][C]-0.6169[/C][C]0.269637[/C][/ROW]
[ROW][C]29[/C][C]-0.147041[/C][C]-1.2477[/C][C]0.108095[/C][/ROW]
[ROW][C]30[/C][C]-0.302952[/C][C]-2.5706[/C][C]0.006109[/C][/ROW]
[ROW][C]31[/C][C]-0.139106[/C][C]-1.1804[/C][C]0.120873[/C][/ROW]
[ROW][C]32[/C][C]-0.145574[/C][C]-1.2352[/C][C]0.110379[/C][/ROW]
[ROW][C]33[/C][C]-0.097232[/C][C]-0.825[/C][C]0.206038[/C][/ROW]
[ROW][C]34[/C][C]0.005979[/C][C]0.0507[/C][C]0.479838[/C][/ROW]
[ROW][C]35[/C][C]0.107378[/C][C]0.9111[/C][C]0.182632[/C][/ROW]
[ROW][C]36[/C][C]0.431431[/C][C]3.6608[/C][C]0.000238[/C][/ROW]
[ROW][C]37[/C][C]0.148074[/C][C]1.2564[/C][C]0.106508[/C][/ROW]
[ROW][C]38[/C][C]0.001321[/C][C]0.0112[/C][C]0.495544[/C][/ROW]
[ROW][C]39[/C][C]-0.002421[/C][C]-0.0205[/C][C]0.491835[/C][/ROW]
[ROW][C]40[/C][C]-0.028772[/C][C]-0.2441[/C][C]0.403909[/C][/ROW]
[ROW][C]41[/C][C]-0.131283[/C][C]-1.114[/C][C]0.134498[/C][/ROW]
[ROW][C]42[/C][C]-0.182209[/C][C]-1.5461[/C][C]0.063233[/C][/ROW]
[ROW][C]43[/C][C]-0.095496[/C][C]-0.8103[/C][C]0.210217[/C][/ROW]
[ROW][C]44[/C][C]-0.09188[/C][C]-0.7796[/C][C]0.219083[/C][/ROW]
[ROW][C]45[/C][C]-0.064512[/C][C]-0.5474[/C][C]0.292898[/C][/ROW]
[ROW][C]46[/C][C]-0.000109[/C][C]-9e-04[/C][C]0.499631[/C][/ROW]
[ROW][C]47[/C][C]0.074913[/C][C]0.6357[/C][C]0.263507[/C][/ROW]
[ROW][C]48[/C][C]0.310128[/C][C]2.6315[/C][C]0.005196[/C][/ROW]
[ROW][C]49[/C][C]0.113061[/C][C]0.9594[/C][C]0.170295[/C][/ROW]
[ROW][C]50[/C][C]0.002309[/C][C]0.0196[/C][C]0.49221[/C][/ROW]
[ROW][C]51[/C][C]0.024812[/C][C]0.2105[/C][C]0.416921[/C][/ROW]
[ROW][C]52[/C][C]0.00567[/C][C]0.0481[/C][C]0.480879[/C][/ROW]
[ROW][C]53[/C][C]-0.07062[/C][C]-0.5992[/C][C]0.27545[/C][/ROW]
[ROW][C]54[/C][C]-0.083718[/C][C]-0.7104[/C][C]0.239885[/C][/ROW]
[ROW][C]55[/C][C]-0.048719[/C][C]-0.4134[/C][C]0.340272[/C][/ROW]
[ROW][C]56[/C][C]-0.020098[/C][C]-0.1705[/C][C]0.432532[/C][/ROW]
[ROW][C]57[/C][C]-0.013718[/C][C]-0.1164[/C][C]0.45383[/C][/ROW]
[ROW][C]58[/C][C]-0.019983[/C][C]-0.1696[/C][C]0.432915[/C][/ROW]
[ROW][C]59[/C][C]0.016719[/C][C]0.1419[/C][C]0.44379[/C][/ROW]
[ROW][C]60[/C][C]0.14143[/C][C]1.2001[/C][C]0.117023[/C][/ROW]
[/TABLE]
Source: https://freestatistics.org/blog/index.php?pk=30855&T=1

Globally Unique Identifier (entire table): ba.freestatistics.org/blog/index.php?pk=30855&T=1

As an alternative you can also use a QR Code:  

The GUIDs for individual cells are displayed in the table below:

Autocorrelation Function
Time lag kACF(k)T-STATP-value
10.2780462.35930.010512
20.0574930.48780.31357
3-0.048273-0.40960.341655
4-0.151204-1.2830.101802
5-0.234595-1.99060.025161
6-0.4355-3.69530.000213
7-0.234993-1.9940.024971
8-0.145526-1.23480.110455
9-0.072724-0.61710.269562
100.0174510.14810.441347
110.2071111.75740.041551
120.7589646.440
130.2285561.93940.028188
140.0507430.43060.334034
15-0.052394-0.44460.328979
16-0.159681-1.35490.089837
17-0.204458-1.73490.043521
18-0.400433-3.39780.000555
19-0.214402-1.81930.036515
20-0.168097-1.42640.079044
21-0.098265-0.83380.203574
220.0149090.12650.449843
230.1793551.52190.06621
240.594165.04162e-06
250.1994841.69270.04742
260.0420470.35680.36115
27-0.004601-0.0390.484484
28-0.072698-0.61690.269637
29-0.147041-1.24770.108095
30-0.302952-2.57060.006109
31-0.139106-1.18040.120873
32-0.145574-1.23520.110379
33-0.097232-0.8250.206038
340.0059790.05070.479838
350.1073780.91110.182632
360.4314313.66080.000238
370.1480741.25640.106508
380.0013210.01120.495544
39-0.002421-0.02050.491835
40-0.028772-0.24410.403909
41-0.131283-1.1140.134498
42-0.182209-1.54610.063233
43-0.095496-0.81030.210217
44-0.09188-0.77960.219083
45-0.064512-0.54740.292898
46-0.000109-9e-040.499631
470.0749130.63570.263507
480.3101282.63150.005196
490.1130610.95940.170295
500.0023090.01960.49221
510.0248120.21050.416921
520.005670.04810.480879
53-0.07062-0.59920.27545
54-0.083718-0.71040.239885
55-0.048719-0.41340.340272
56-0.020098-0.17050.432532
57-0.013718-0.11640.45383
58-0.019983-0.16960.432915
590.0167190.14190.44379
600.141431.20010.117023


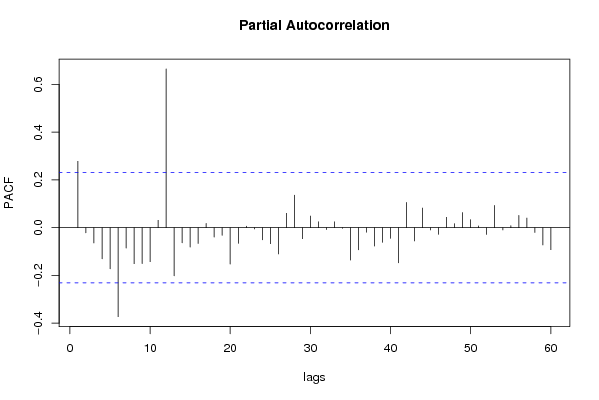
Partial Autocorrelation Function
Time lag kPACF(k)T-STATP-value
10.2780462.35930.010512
2-0.021477-0.18220.427955
3-0.063572-0.53940.295629
4-0.130301-1.10560.136281
5-0.172246-1.46160.074106
6-0.372466-3.16050.001152
7-0.085132-0.72240.236202
8-0.150528-1.27730.102805
9-0.150127-1.27390.103404
10-0.142075-1.20550.11597
110.0311950.26470.395999
120.6651015.64360
13-0.201234-1.70750.046017
14-0.063297-0.53710.296428
15-0.081105-0.68820.246768
16-0.065614-0.55680.28971
170.0182230.15460.438776
18-0.039099-0.33180.370516
19-0.031973-0.27130.393467
20-0.152305-1.29240.100184
21-0.065372-0.55470.29041
220.0063450.05380.478608
23-0.004883-0.04140.483534
24-0.050688-0.43010.334202
25-0.066767-0.56650.286394
26-0.109903-0.93260.177082
270.0606160.51430.304293
280.1362611.15620.125708
29-0.045748-0.38820.349513
300.0486950.41320.340347
310.0246110.20880.417583
32-0.007434-0.06310.47494
330.0248690.2110.416733
34-0.002434-0.02070.49179
35-0.135667-1.15120.126735
36-0.092566-0.78540.217384
37-0.018565-0.15750.437635
38-0.07694-0.65290.257964
39-0.061124-0.51870.302796
40-0.044295-0.37590.354065
41-0.147086-1.24810.108026
420.1058860.89850.185964
43-0.055568-0.47150.31935
440.0822370.69780.243775
45-0.009103-0.07720.469324
46-0.027797-0.23590.407102
470.0438560.37210.355445
480.0170120.14440.442812
490.0634450.53830.295999
500.0337770.28660.387617
510.0072870.06180.475433
52-0.028352-0.24060.405284
530.0936340.79450.214755
54-0.009114-0.07730.469286
550.0086860.07370.470724
560.0517020.43870.331094
570.0405190.34380.365994
58-0.019743-0.16750.433714
59-0.072062-0.61150.271408
60-0.091874-0.77960.219097

\begin{tabular}{lllllllll}
\hline
Partial Autocorrelation Function \tabularnewline
Time lag k & PACF(k) & T-STAT & P-value \tabularnewline
1 & 0.278046 & 2.3593 & 0.010512 \tabularnewline
2 & -0.021477 & -0.1822 & 0.427955 \tabularnewline
3 & -0.063572 & -0.5394 & 0.295629 \tabularnewline
4 & -0.130301 & -1.1056 & 0.136281 \tabularnewline
5 & -0.172246 & -1.4616 & 0.074106 \tabularnewline
6 & -0.372466 & -3.1605 & 0.001152 \tabularnewline
7 & -0.085132 & -0.7224 & 0.236202 \tabularnewline
8 & -0.150528 & -1.2773 & 0.102805 \tabularnewline
9 & -0.150127 & -1.2739 & 0.103404 \tabularnewline
10 & -0.142075 & -1.2055 & 0.11597 \tabularnewline
11 & 0.031195 & 0.2647 & 0.395999 \tabularnewline
12 & 0.665101 & 5.6436 & 0 \tabularnewline
13 & -0.201234 & -1.7075 & 0.046017 \tabularnewline
14 & -0.063297 & -0.5371 & 0.296428 \tabularnewline
15 & -0.081105 & -0.6882 & 0.246768 \tabularnewline
16 & -0.065614 & -0.5568 & 0.28971 \tabularnewline
17 & 0.018223 & 0.1546 & 0.438776 \tabularnewline
18 & -0.039099 & -0.3318 & 0.370516 \tabularnewline
19 & -0.031973 & -0.2713 & 0.393467 \tabularnewline
20 & -0.152305 & -1.2924 & 0.100184 \tabularnewline
21 & -0.065372 & -0.5547 & 0.29041 \tabularnewline
22 & 0.006345 & 0.0538 & 0.478608 \tabularnewline
23 & -0.004883 & -0.0414 & 0.483534 \tabularnewline
24 & -0.050688 & -0.4301 & 0.334202 \tabularnewline
25 & -0.066767 & -0.5665 & 0.286394 \tabularnewline
26 & -0.109903 & -0.9326 & 0.177082 \tabularnewline
27 & 0.060616 & 0.5143 & 0.304293 \tabularnewline
28 & 0.136261 & 1.1562 & 0.125708 \tabularnewline
29 & -0.045748 & -0.3882 & 0.349513 \tabularnewline
30 & 0.048695 & 0.4132 & 0.340347 \tabularnewline
31 & 0.024611 & 0.2088 & 0.417583 \tabularnewline
32 & -0.007434 & -0.0631 & 0.47494 \tabularnewline
33 & 0.024869 & 0.211 & 0.416733 \tabularnewline
34 & -0.002434 & -0.0207 & 0.49179 \tabularnewline
35 & -0.135667 & -1.1512 & 0.126735 \tabularnewline
36 & -0.092566 & -0.7854 & 0.217384 \tabularnewline
37 & -0.018565 & -0.1575 & 0.437635 \tabularnewline
38 & -0.07694 & -0.6529 & 0.257964 \tabularnewline
39 & -0.061124 & -0.5187 & 0.302796 \tabularnewline
40 & -0.044295 & -0.3759 & 0.354065 \tabularnewline
41 & -0.147086 & -1.2481 & 0.108026 \tabularnewline
42 & 0.105886 & 0.8985 & 0.185964 \tabularnewline
43 & -0.055568 & -0.4715 & 0.31935 \tabularnewline
44 & 0.082237 & 0.6978 & 0.243775 \tabularnewline
45 & -0.009103 & -0.0772 & 0.469324 \tabularnewline
46 & -0.027797 & -0.2359 & 0.407102 \tabularnewline
47 & 0.043856 & 0.3721 & 0.355445 \tabularnewline
48 & 0.017012 & 0.1444 & 0.442812 \tabularnewline
49 & 0.063445 & 0.5383 & 0.295999 \tabularnewline
50 & 0.033777 & 0.2866 & 0.387617 \tabularnewline
51 & 0.007287 & 0.0618 & 0.475433 \tabularnewline
52 & -0.028352 & -0.2406 & 0.405284 \tabularnewline
53 & 0.093634 & 0.7945 & 0.214755 \tabularnewline
54 & -0.009114 & -0.0773 & 0.469286 \tabularnewline
55 & 0.008686 & 0.0737 & 0.470724 \tabularnewline
56 & 0.051702 & 0.4387 & 0.331094 \tabularnewline
57 & 0.040519 & 0.3438 & 0.365994 \tabularnewline
58 & -0.019743 & -0.1675 & 0.433714 \tabularnewline
59 & -0.072062 & -0.6115 & 0.271408 \tabularnewline
60 & -0.091874 & -0.7796 & 0.219097 \tabularnewline
\hline
\end{tabular}
%Source: https://freestatistics.org/blog/index.php?pk=30855&T=2

[TABLE]
[ROW][C]Partial Autocorrelation Function[/C][/ROW]
[ROW][C]Time lag k[/C][C]PACF(k)[/C][C]T-STAT[/C][C]P-value[/C][/ROW]
[ROW][C]1[/C][C]0.278046[/C][C]2.3593[/C][C]0.010512[/C][/ROW]
[ROW][C]2[/C][C]-0.021477[/C][C]-0.1822[/C][C]0.427955[/C][/ROW]
[ROW][C]3[/C][C]-0.063572[/C][C]-0.5394[/C][C]0.295629[/C][/ROW]
[ROW][C]4[/C][C]-0.130301[/C][C]-1.1056[/C][C]0.136281[/C][/ROW]
[ROW][C]5[/C][C]-0.172246[/C][C]-1.4616[/C][C]0.074106[/C][/ROW]
[ROW][C]6[/C][C]-0.372466[/C][C]-3.1605[/C][C]0.001152[/C][/ROW]
[ROW][C]7[/C][C]-0.085132[/C][C]-0.7224[/C][C]0.236202[/C][/ROW]
[ROW][C]8[/C][C]-0.150528[/C][C]-1.2773[/C][C]0.102805[/C][/ROW]
[ROW][C]9[/C][C]-0.150127[/C][C]-1.2739[/C][C]0.103404[/C][/ROW]
[ROW][C]10[/C][C]-0.142075[/C][C]-1.2055[/C][C]0.11597[/C][/ROW]
[ROW][C]11[/C][C]0.031195[/C][C]0.2647[/C][C]0.395999[/C][/ROW]
[ROW][C]12[/C][C]0.665101[/C][C]5.6436[/C][C]0[/C][/ROW]
[ROW][C]13[/C][C]-0.201234[/C][C]-1.7075[/C][C]0.046017[/C][/ROW]
[ROW][C]14[/C][C]-0.063297[/C][C]-0.5371[/C][C]0.296428[/C][/ROW]
[ROW][C]15[/C][C]-0.081105[/C][C]-0.6882[/C][C]0.246768[/C][/ROW]
[ROW][C]16[/C][C]-0.065614[/C][C]-0.5568[/C][C]0.28971[/C][/ROW]
[ROW][C]17[/C][C]0.018223[/C][C]0.1546[/C][C]0.438776[/C][/ROW]
[ROW][C]18[/C][C]-0.039099[/C][C]-0.3318[/C][C]0.370516[/C][/ROW]
[ROW][C]19[/C][C]-0.031973[/C][C]-0.2713[/C][C]0.393467[/C][/ROW]
[ROW][C]20[/C][C]-0.152305[/C][C]-1.2924[/C][C]0.100184[/C][/ROW]
[ROW][C]21[/C][C]-0.065372[/C][C]-0.5547[/C][C]0.29041[/C][/ROW]
[ROW][C]22[/C][C]0.006345[/C][C]0.0538[/C][C]0.478608[/C][/ROW]
[ROW][C]23[/C][C]-0.004883[/C][C]-0.0414[/C][C]0.483534[/C][/ROW]
[ROW][C]24[/C][C]-0.050688[/C][C]-0.4301[/C][C]0.334202[/C][/ROW]
[ROW][C]25[/C][C]-0.066767[/C][C]-0.5665[/C][C]0.286394[/C][/ROW]
[ROW][C]26[/C][C]-0.109903[/C][C]-0.9326[/C][C]0.177082[/C][/ROW]
[ROW][C]27[/C][C]0.060616[/C][C]0.5143[/C][C]0.304293[/C][/ROW]
[ROW][C]28[/C][C]0.136261[/C][C]1.1562[/C][C]0.125708[/C][/ROW]
[ROW][C]29[/C][C]-0.045748[/C][C]-0.3882[/C][C]0.349513[/C][/ROW]
[ROW][C]30[/C][C]0.048695[/C][C]0.4132[/C][C]0.340347[/C][/ROW]
[ROW][C]31[/C][C]0.024611[/C][C]0.2088[/C][C]0.417583[/C][/ROW]
[ROW][C]32[/C][C]-0.007434[/C][C]-0.0631[/C][C]0.47494[/C][/ROW]
[ROW][C]33[/C][C]0.024869[/C][C]0.211[/C][C]0.416733[/C][/ROW]
[ROW][C]34[/C][C]-0.002434[/C][C]-0.0207[/C][C]0.49179[/C][/ROW]
[ROW][C]35[/C][C]-0.135667[/C][C]-1.1512[/C][C]0.126735[/C][/ROW]
[ROW][C]36[/C][C]-0.092566[/C][C]-0.7854[/C][C]0.217384[/C][/ROW]
[ROW][C]37[/C][C]-0.018565[/C][C]-0.1575[/C][C]0.437635[/C][/ROW]
[ROW][C]38[/C][C]-0.07694[/C][C]-0.6529[/C][C]0.257964[/C][/ROW]
[ROW][C]39[/C][C]-0.061124[/C][C]-0.5187[/C][C]0.302796[/C][/ROW]
[ROW][C]40[/C][C]-0.044295[/C][C]-0.3759[/C][C]0.354065[/C][/ROW]
[ROW][C]41[/C][C]-0.147086[/C][C]-1.2481[/C][C]0.108026[/C][/ROW]
[ROW][C]42[/C][C]0.105886[/C][C]0.8985[/C][C]0.185964[/C][/ROW]
[ROW][C]43[/C][C]-0.055568[/C][C]-0.4715[/C][C]0.31935[/C][/ROW]
[ROW][C]44[/C][C]0.082237[/C][C]0.6978[/C][C]0.243775[/C][/ROW]
[ROW][C]45[/C][C]-0.009103[/C][C]-0.0772[/C][C]0.469324[/C][/ROW]
[ROW][C]46[/C][C]-0.027797[/C][C]-0.2359[/C][C]0.407102[/C][/ROW]
[ROW][C]47[/C][C]0.043856[/C][C]0.3721[/C][C]0.355445[/C][/ROW]
[ROW][C]48[/C][C]0.017012[/C][C]0.1444[/C][C]0.442812[/C][/ROW]
[ROW][C]49[/C][C]0.063445[/C][C]0.5383[/C][C]0.295999[/C][/ROW]
[ROW][C]50[/C][C]0.033777[/C][C]0.2866[/C][C]0.387617[/C][/ROW]
[ROW][C]51[/C][C]0.007287[/C][C]0.0618[/C][C]0.475433[/C][/ROW]
[ROW][C]52[/C][C]-0.028352[/C][C]-0.2406[/C][C]0.405284[/C][/ROW]
[ROW][C]53[/C][C]0.093634[/C][C]0.7945[/C][C]0.214755[/C][/ROW]
[ROW][C]54[/C][C]-0.009114[/C][C]-0.0773[/C][C]0.469286[/C][/ROW]
[ROW][C]55[/C][C]0.008686[/C][C]0.0737[/C][C]0.470724[/C][/ROW]
[ROW][C]56[/C][C]0.051702[/C][C]0.4387[/C][C]0.331094[/C][/ROW]
[ROW][C]57[/C][C]0.040519[/C][C]0.3438[/C][C]0.365994[/C][/ROW]
[ROW][C]58[/C][C]-0.019743[/C][C]-0.1675[/C][C]0.433714[/C][/ROW]
[ROW][C]59[/C][C]-0.072062[/C][C]-0.6115[/C][C]0.271408[/C][/ROW]
[ROW][C]60[/C][C]-0.091874[/C][C]-0.7796[/C][C]0.219097[/C][/ROW]
[/TABLE]
Source: https://freestatistics.org/blog/index.php?pk=30855&T=2

Globally Unique Identifier (entire table): ba.freestatistics.org/blog/index.php?pk=30855&T=2

As an alternative you can also use a QR Code:  

The GUIDs for individual cells are displayed in the table below:

Partial Autocorrelation Function
Time lag kPACF(k)T-STATP-value
10.2780462.35930.010512
2-0.021477-0.18220.427955
3-0.063572-0.53940.295629
4-0.130301-1.10560.136281
5-0.172246-1.46160.074106
6-0.372466-3.16050.001152
7-0.085132-0.72240.236202
8-0.150528-1.27730.102805
9-0.150127-1.27390.103404
10-0.142075-1.20550.11597
110.0311950.26470.395999
120.6651015.64360
13-0.201234-1.70750.046017
14-0.063297-0.53710.296428
15-0.081105-0.68820.246768
16-0.065614-0.55680.28971
170.0182230.15460.438776
18-0.039099-0.33180.370516
19-0.031973-0.27130.393467
20-0.152305-1.29240.100184
21-0.065372-0.55470.29041
220.0063450.05380.478608
23-0.004883-0.04140.483534
24-0.050688-0.43010.334202
25-0.066767-0.56650.286394
26-0.109903-0.93260.177082
270.0606160.51430.304293
280.1362611.15620.125708
29-0.045748-0.38820.349513
300.0486950.41320.340347
310.0246110.20880.417583
32-0.007434-0.06310.47494
330.0248690.2110.416733
34-0.002434-0.02070.49179
35-0.135667-1.15120.126735
36-0.092566-0.78540.217384
37-0.018565-0.15750.437635
38-0.07694-0.65290.257964
39-0.061124-0.51870.302796
40-0.044295-0.37590.354065
41-0.147086-1.24810.108026
420.1058860.89850.185964
43-0.055568-0.47150.31935
440.0822370.69780.243775
45-0.009103-0.07720.469324
46-0.027797-0.23590.407102
470.0438560.37210.355445
480.0170120.14440.442812
490.0634450.53830.295999
500.0337770.28660.387617
510.0072870.06180.475433
52-0.028352-0.24060.405284
530.0936340.79450.214755
54-0.009114-0.07730.469286
550.0086860.07370.470724
560.0517020.43870.331094
570.0405190.34380.365994
58-0.019743-0.16750.433714
59-0.072062-0.61150.271408
60-0.091874-0.77960.219097


Parameters (Session):
par1 = FALSE ; par2 = 1 ; par3 = 0 ; par4 = 1 ; par5 = 12 ; par6 = 3 ; par7 = 0 ; par8 = 2 ; par9 = 1 ;
Parameters (R input):
par1 = 60 ; par2 = 0.4 ; par3 = 0 ; par4 = 0 ; par5 = 12 ;
R code (references can be found in the software module):
if (par1 == 'Default') {
par1 = 10*log10(length(x))
} else {
par1 <- as.numeric(par1)
}
par2 <- as.numeric(par2)
par3 <- as.numeric(par3)
par4 <- as.numeric(par4)
par5 <- as.numeric(par5)
if (par2 == 0) {
x <- log(x)
} else {
x <- (x ^ par2 - 1) / par2
}
if (par3 > 0) x <- diff(x,lag=1,difference=par3)
if (par4 > 0) x <- diff(x,lag=par5,difference=par4)
bitmap(file='pic1.png')
racf <- acf(x,par1,main='Autocorrelation',xlab='lags',ylab='ACF')
dev.off()
bitmap(file='pic2.png')
rpacf <- pacf(x,par1,main='Partial Autocorrelation',xlab='lags',ylab='PACF')
dev.off()
(myacf <- c(racf$acf))
(mypacf <- c(rpacf$acf))
lengthx <- length(x)
sqrtn <- sqrt(lengthx)
load(file='createtable')
a<-table.start()
a<-table.row.start(a)
a<-table.element(a,'Autocorrelation Function',4,TRUE)
a<-table.row.end(a)
a<-table.row.start(a)
a<-table.element(a,'Time lag k',header=TRUE)
a<-table.element(a,hyperlink('basics.htm','ACF(k)','click here for more information about the Autocorrelation Function'),header=TRUE)
a<-table.element(a,'T-STAT',header=TRUE)
a<-table.element(a,'P-value',header=TRUE)
a<-table.row.end(a)
for (i in 2:(par1+1)) {
a<-table.row.start(a)
a<-table.element(a,i-1,header=TRUE)
a<-table.element(a,round(myacf[i],6))
mytstat <- myacf[i]*sqrtn
a<-table.element(a,round(mytstat,4))
a<-table.element(a,round(1-pt(abs(mytstat),lengthx),6))
a<-table.row.end(a)
}
a<-table.end(a)
table.save(a,file='mytable.tab')
a<-table.start()
a<-table.row.start(a)
a<-table.element(a,'Partial Autocorrelation Function',4,TRUE)
a<-table.row.end(a)
a<-table.row.start(a)
a<-table.element(a,'Time lag k',header=TRUE)
a<-table.element(a,hyperlink('basics.htm','PACF(k)','click here for more information about the Partial Autocorrelation Function'),header=TRUE)
a<-table.element(a,'T-STAT',header=TRUE)
a<-table.element(a,'P-value',header=TRUE)
a<-table.row.end(a)
for (i in 1:par1) {
a<-table.row.start(a)
a<-table.element(a,i,header=TRUE)
a<-table.element(a,round(mypacf[i],6))
mytstat <- mypacf[i]*sqrtn
a<-table.element(a,round(mytstat,4))
a<-table.element(a,round(1-pt(abs(mytstat),lengthx),6))
a<-table.row.end(a)
}
a<-table.end(a)
table.save(a,file='mytable1.tab')