Free Statistics

of Irreproducible Research!

Author's title

Author*The author of this computation has been verified*
R Software Modulerwasp_arimabackwardselection.wasp
Title produced by softwareARIMA Backward Selection
Date of computationMon, 08 Dec 2008 12:29:21 -0700
Cite this page as followsStatistical Computations at FreeStatistics.org, Office for Research Development and Education, URL https://freestatistics.org/blog/index.php?v=date/2008/Dec/08/t1228764613vf4livdgvc91lqm.htm/, Retrieved Thu, 16 May 2024 08:38:53 +0000
Statistical Computations at FreeStatistics.org, Office for Research Development and Education, URL https://freestatistics.org/blog/index.php?pk=30816, Retrieved Thu, 16 May 2024 08:38:53 +0000
QR Codes:

Original text written by user:
IsPrivate?No (this computation is public)
User-defined keywords
Estimated Impact170
Family? (F = Feedback message, R = changed R code, M = changed R Module, P = changed Parameters, D = changed Data)
F     [ARIMA Backward Selection] [] [2008-12-07 14:04:55] [74be16979710d4c4e7c6647856088456]
-   PD    [ARIMA Backward Selection] [] [2008-12-08 19:29:21] [19ef54504342c1b076371d395a2ab19f] [Current]
Feedback Forum

Post a new message
Dataseries X:
31514
27071
29462
26105
22397
23843
21705
18089
20764
25316
17704
15548
28029
29383
36438
32034
22679
24319
18004
17537
20366
22782
19169
13807
29743
25591
29096
26482
22405
27044
17970
18730
19684
19785
18479
10698
31956
29506
34506
27165
26736
23691
18157
17328
18205
20995
17382
9367
31124
26551
30651
25859
25100
25778
20418
18688
20424
24776
19814
12738
31566
30111
30019
31934
25826
26835


Summary of computational transaction
Raw Inputview raw input (R code)
Raw Outputview raw output of R engine
Computing time3 seconds
R Server'Gwilym Jenkins' @ 72.249.127.135

\begin{tabular}{lllllllll}
\hline
Summary of computational transaction \tabularnewline
Raw Input & view raw input (R code)  \tabularnewline
Raw Output & view raw output of R engine  \tabularnewline
Computing time & 3 seconds \tabularnewline
R Server & 'Gwilym Jenkins' @ 72.249.127.135 \tabularnewline
\hline
\end{tabular}
%Source: https://freestatistics.org/blog/index.php?pk=30816&T=0

[TABLE]
[ROW][C]Summary of computational transaction[/C][/ROW]
[ROW][C]Raw Input[/C][C]view raw input (R code) [/C][/ROW]
[ROW][C]Raw Output[/C][C]view raw output of R engine [/C][/ROW]
[ROW][C]Computing time[/C][C]3 seconds[/C][/ROW]
[ROW][C]R Server[/C][C]'Gwilym Jenkins' @ 72.249.127.135[/C][/ROW]
[/TABLE]
Source: https://freestatistics.org/blog/index.php?pk=30816&T=0

Globally Unique Identifier (entire table): ba.freestatistics.org/blog/index.php?pk=30816&T=0

As an alternative you can also use a QR Code:  

The GUIDs for individual cells are displayed in the table below:

Summary of computational transaction
Raw Inputview raw input (R code)
Raw Outputview raw output of R engine
Computing time3 seconds
R Server'Gwilym Jenkins' @ 72.249.127.135


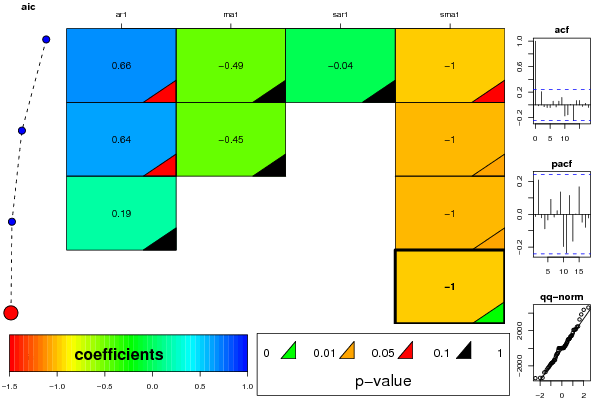
ARIMA Parameter Estimation and Backward Selection
Iterationar1ma1sar1sma1
Estimates ( 1 )0.6637-0.4887-0.0418-0.9998
(p-val)(0.0697 )(0.2511 )(0.834 )(0.0844 )
Estimates ( 2 )0.6435-0.45460-1.0017
(p-val)(0.0606 )(0.2343 )(NA )(0.0263 )
Estimates ( 3 )0.186700-1.0001
(p-val)(0.1669 )(NA )(NA )(0.0279 )
Estimates ( 4 )000-0.9994
(p-val)(NA )(NA )(NA )(0.006 )
Estimates ( 5 )NANANANA
(p-val)(NA )(NA )(NA )(NA )
Estimates ( 6 )NANANANA
(p-val)(NA )(NA )(NA )(NA )
Estimates ( 7 )NANANANA
(p-val)(NA )(NA )(NA )(NA )

\begin{tabular}{lllllllll}
\hline
ARIMA Parameter Estimation and Backward Selection \tabularnewline
Iteration & ar1 & ma1 & sar1 & sma1 \tabularnewline
Estimates ( 1 ) & 0.6637 & -0.4887 & -0.0418 & -0.9998 \tabularnewline
(p-val) & (0.0697 ) & (0.2511 ) & (0.834 ) & (0.0844 ) \tabularnewline
Estimates ( 2 ) & 0.6435 & -0.4546 & 0 & -1.0017 \tabularnewline
(p-val) & (0.0606 ) & (0.2343 ) & (NA ) & (0.0263 ) \tabularnewline
Estimates ( 3 ) & 0.1867 & 0 & 0 & -1.0001 \tabularnewline
(p-val) & (0.1669 ) & (NA ) & (NA ) & (0.0279 ) \tabularnewline
Estimates ( 4 ) & 0 & 0 & 0 & -0.9994 \tabularnewline
(p-val) & (NA ) & (NA ) & (NA ) & (0.006 ) \tabularnewline
Estimates ( 5 ) & NA & NA & NA & NA \tabularnewline
(p-val) & (NA ) & (NA ) & (NA ) & (NA ) \tabularnewline
Estimates ( 6 ) & NA & NA & NA & NA \tabularnewline
(p-val) & (NA ) & (NA ) & (NA ) & (NA ) \tabularnewline
Estimates ( 7 ) & NA & NA & NA & NA \tabularnewline
(p-val) & (NA ) & (NA ) & (NA ) & (NA ) \tabularnewline
\hline
\end{tabular}
%Source: https://freestatistics.org/blog/index.php?pk=30816&T=1

[TABLE]
[ROW][C]ARIMA Parameter Estimation and Backward Selection[/C][/ROW]
[ROW][C]Iteration[/C][C]ar1[/C][C]ma1[/C][C]sar1[/C][C]sma1[/C][/ROW]
[ROW][C]Estimates ( 1 )[/C][C]0.6637[/C][C]-0.4887[/C][C]-0.0418[/C][C]-0.9998[/C][/ROW]
[ROW][C](p-val)[/C][C](0.0697 )[/C][C](0.2511 )[/C][C](0.834 )[/C][C](0.0844 )[/C][/ROW]
[ROW][C]Estimates ( 2 )[/C][C]0.6435[/C][C]-0.4546[/C][C]0[/C][C]-1.0017[/C][/ROW]
[ROW][C](p-val)[/C][C](0.0606 )[/C][C](0.2343 )[/C][C](NA )[/C][C](0.0263 )[/C][/ROW]
[ROW][C]Estimates ( 3 )[/C][C]0.1867[/C][C]0[/C][C]0[/C][C]-1.0001[/C][/ROW]
[ROW][C](p-val)[/C][C](0.1669 )[/C][C](NA )[/C][C](NA )[/C][C](0.0279 )[/C][/ROW]
[ROW][C]Estimates ( 4 )[/C][C]0[/C][C]0[/C][C]0[/C][C]-0.9994[/C][/ROW]
[ROW][C](p-val)[/C][C](NA )[/C][C](NA )[/C][C](NA )[/C][C](0.006 )[/C][/ROW]
[ROW][C]Estimates ( 5 )[/C][C]NA[/C][C]NA[/C][C]NA[/C][C]NA[/C][/ROW]
[ROW][C](p-val)[/C][C](NA )[/C][C](NA )[/C][C](NA )[/C][C](NA )[/C][/ROW]
[ROW][C]Estimates ( 6 )[/C][C]NA[/C][C]NA[/C][C]NA[/C][C]NA[/C][/ROW]
[ROW][C](p-val)[/C][C](NA )[/C][C](NA )[/C][C](NA )[/C][C](NA )[/C][/ROW]
[ROW][C]Estimates ( 7 )[/C][C]NA[/C][C]NA[/C][C]NA[/C][C]NA[/C][/ROW]
[ROW][C](p-val)[/C][C](NA )[/C][C](NA )[/C][C](NA )[/C][C](NA )[/C][/ROW]
[/TABLE]
Source: https://freestatistics.org/blog/index.php?pk=30816&T=1

Globally Unique Identifier (entire table): ba.freestatistics.org/blog/index.php?pk=30816&T=1

As an alternative you can also use a QR Code:  

The GUIDs for individual cells are displayed in the table below:

ARIMA Parameter Estimation and Backward Selection
Iterationar1ma1sar1sma1
Estimates ( 1 )0.6637-0.4887-0.0418-0.9998
(p-val)(0.0697 )(0.2511 )(0.834 )(0.0844 )
Estimates ( 2 )0.6435-0.45460-1.0017
(p-val)(0.0606 )(0.2343 )(NA )(0.0263 )
Estimates ( 3 )0.186700-1.0001
(p-val)(0.1669 )(NA )(NA )(0.0279 )
Estimates ( 4 )000-0.9994
(p-val)(NA )(NA )(NA )(0.006 )
Estimates ( 5 )NANANANA
(p-val)(NA )(NA )(NA )(NA )
Estimates ( 6 )NANANANA
(p-val)(NA )(NA )(NA )(NA )
Estimates ( 7 )NANANANA
(p-val)(NA )(NA )(NA )(NA )


Estimated ARIMA Residuals
Value
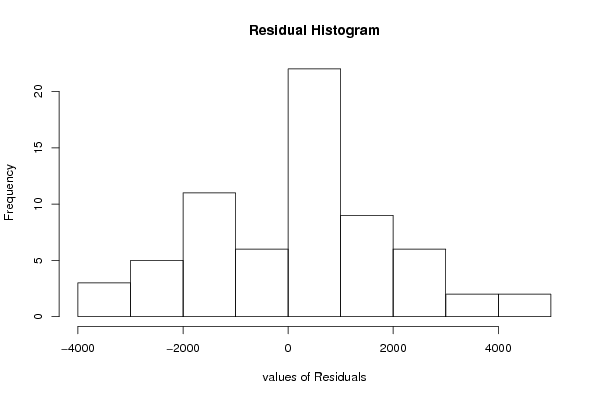
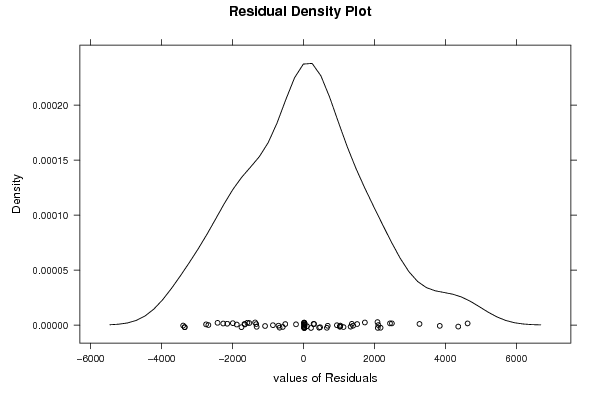
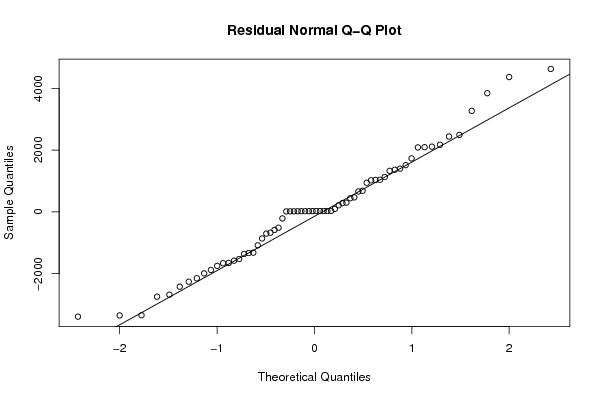
15.5479821829238
-2420.74703306835
2094.90523455873
4627.22532383326
3271.10297369299
-583.44239080948
299.338229310818
-2679.72234791399
98.1192687386126
-209.953766138482
-1746.87893851337
1329.07619586807
-1651.87714552071
214.170930975207
-2147.79174164023
-2744.67116876767
-1524.94330691463
285.923988194982
2439.41322693305
-1990.36300373548
1035.85206133014
-859.927388389012
-3351.49635214178
660.702039627512
-3390.75961554409
2492.96968079606
1513.69057368756
2111.02575361682
-1361.70458446991
3842.25252022017
-1879.05334934182
-703.233645729703
-511.839758781736
-1661.92579635312
-1081.86871679761
-673.14211134758
-3343.70744660559
1363.01411063782
-1331.4110608804
-1319.07654495403
-1578.97414348213
1731.12716987426
684.283722777859
1128.89071266699
442.26060549679
470.189314672444
2173.23085553919
1023.51286901548
28.6703615584727
942.07183262078
2087.18270147961
-2260.75803455666
4363.85024138284
1040.61757541802
1399.80621978577

\begin{tabular}{lllllllll}
\hline
Estimated ARIMA Residuals \tabularnewline
Value \tabularnewline
15.5479821829238 \tabularnewline
-2420.74703306835 \tabularnewline
2094.90523455873 \tabularnewline
4627.22532383326 \tabularnewline
3271.10297369299 \tabularnewline
-583.44239080948 \tabularnewline
299.338229310818 \tabularnewline
-2679.72234791399 \tabularnewline
98.1192687386126 \tabularnewline
-209.953766138482 \tabularnewline
-1746.87893851337 \tabularnewline
1329.07619586807 \tabularnewline
-1651.87714552071 \tabularnewline
214.170930975207 \tabularnewline
-2147.79174164023 \tabularnewline
-2744.67116876767 \tabularnewline
-1524.94330691463 \tabularnewline
285.923988194982 \tabularnewline
2439.41322693305 \tabularnewline
-1990.36300373548 \tabularnewline
1035.85206133014 \tabularnewline
-859.927388389012 \tabularnewline
-3351.49635214178 \tabularnewline
660.702039627512 \tabularnewline
-3390.75961554409 \tabularnewline
2492.96968079606 \tabularnewline
1513.69057368756 \tabularnewline
2111.02575361682 \tabularnewline
-1361.70458446991 \tabularnewline
3842.25252022017 \tabularnewline
-1879.05334934182 \tabularnewline
-703.233645729703 \tabularnewline
-511.839758781736 \tabularnewline
-1661.92579635312 \tabularnewline
-1081.86871679761 \tabularnewline
-673.14211134758 \tabularnewline
-3343.70744660559 \tabularnewline
1363.01411063782 \tabularnewline
-1331.4110608804 \tabularnewline
-1319.07654495403 \tabularnewline
-1578.97414348213 \tabularnewline
1731.12716987426 \tabularnewline
684.283722777859 \tabularnewline
1128.89071266699 \tabularnewline
442.26060549679 \tabularnewline
470.189314672444 \tabularnewline
2173.23085553919 \tabularnewline
1023.51286901548 \tabularnewline
28.6703615584727 \tabularnewline
942.07183262078 \tabularnewline
2087.18270147961 \tabularnewline
-2260.75803455666 \tabularnewline
4363.85024138284 \tabularnewline
1040.61757541802 \tabularnewline
1399.80621978577 \tabularnewline
\hline
\end{tabular}
%Source: https://freestatistics.org/blog/index.php?pk=30816&T=2

[TABLE]
[ROW][C]Estimated ARIMA Residuals[/C][/ROW]
[ROW][C]Value[/C][/ROW]
[ROW][C]15.5479821829238[/C][/ROW]
[ROW][C]-2420.74703306835[/C][/ROW]
[ROW][C]2094.90523455873[/C][/ROW]
[ROW][C]4627.22532383326[/C][/ROW]
[ROW][C]3271.10297369299[/C][/ROW]
[ROW][C]-583.44239080948[/C][/ROW]
[ROW][C]299.338229310818[/C][/ROW]
[ROW][C]-2679.72234791399[/C][/ROW]
[ROW][C]98.1192687386126[/C][/ROW]
[ROW][C]-209.953766138482[/C][/ROW]
[ROW][C]-1746.87893851337[/C][/ROW]
[ROW][C]1329.07619586807[/C][/ROW]
[ROW][C]-1651.87714552071[/C][/ROW]
[ROW][C]214.170930975207[/C][/ROW]
[ROW][C]-2147.79174164023[/C][/ROW]
[ROW][C]-2744.67116876767[/C][/ROW]
[ROW][C]-1524.94330691463[/C][/ROW]
[ROW][C]285.923988194982[/C][/ROW]
[ROW][C]2439.41322693305[/C][/ROW]
[ROW][C]-1990.36300373548[/C][/ROW]
[ROW][C]1035.85206133014[/C][/ROW]
[ROW][C]-859.927388389012[/C][/ROW]
[ROW][C]-3351.49635214178[/C][/ROW]
[ROW][C]660.702039627512[/C][/ROW]
[ROW][C]-3390.75961554409[/C][/ROW]
[ROW][C]2492.96968079606[/C][/ROW]
[ROW][C]1513.69057368756[/C][/ROW]
[ROW][C]2111.02575361682[/C][/ROW]
[ROW][C]-1361.70458446991[/C][/ROW]
[ROW][C]3842.25252022017[/C][/ROW]
[ROW][C]-1879.05334934182[/C][/ROW]
[ROW][C]-703.233645729703[/C][/ROW]
[ROW][C]-511.839758781736[/C][/ROW]
[ROW][C]-1661.92579635312[/C][/ROW]
[ROW][C]-1081.86871679761[/C][/ROW]
[ROW][C]-673.14211134758[/C][/ROW]
[ROW][C]-3343.70744660559[/C][/ROW]
[ROW][C]1363.01411063782[/C][/ROW]
[ROW][C]-1331.4110608804[/C][/ROW]
[ROW][C]-1319.07654495403[/C][/ROW]
[ROW][C]-1578.97414348213[/C][/ROW]
[ROW][C]1731.12716987426[/C][/ROW]
[ROW][C]684.283722777859[/C][/ROW]
[ROW][C]1128.89071266699[/C][/ROW]
[ROW][C]442.26060549679[/C][/ROW]
[ROW][C]470.189314672444[/C][/ROW]
[ROW][C]2173.23085553919[/C][/ROW]
[ROW][C]1023.51286901548[/C][/ROW]
[ROW][C]28.6703615584727[/C][/ROW]
[ROW][C]942.07183262078[/C][/ROW]
[ROW][C]2087.18270147961[/C][/ROW]
[ROW][C]-2260.75803455666[/C][/ROW]
[ROW][C]4363.85024138284[/C][/ROW]
[ROW][C]1040.61757541802[/C][/ROW]
[ROW][C]1399.80621978577[/C][/ROW]
[/TABLE]
Source: https://freestatistics.org/blog/index.php?pk=30816&T=2

Globally Unique Identifier (entire table): ba.freestatistics.org/blog/index.php?pk=30816&T=2

As an alternative you can also use a QR Code:  

The GUIDs for individual cells are displayed in the table below:

Estimated ARIMA Residuals
Value
15.5479821829238
-2420.74703306835
2094.90523455873
4627.22532383326
3271.10297369299
-583.44239080948
299.338229310818
-2679.72234791399
98.1192687386126
-209.953766138482
-1746.87893851337
1329.07619586807
-1651.87714552071
214.170930975207
-2147.79174164023
-2744.67116876767
-1524.94330691463
285.923988194982
2439.41322693305
-1990.36300373548
1035.85206133014
-859.927388389012
-3351.49635214178
660.702039627512
-3390.75961554409
2492.96968079606
1513.69057368756
2111.02575361682
-1361.70458446991
3842.25252022017
-1879.05334934182
-703.233645729703
-511.839758781736
-1661.92579635312
-1081.86871679761
-673.14211134758
-3343.70744660559
1363.01411063782
-1331.4110608804
-1319.07654495403
-1578.97414348213
1731.12716987426
684.283722777859
1128.89071266699
442.26060549679
470.189314672444
2173.23085553919
1023.51286901548
28.6703615584727
942.07183262078
2087.18270147961
-2260.75803455666
4363.85024138284
1040.61757541802
1399.80621978577


Parameters (Session):
par1 = FALSE ; par2 = 1 ; par3 = 0 ; par4 = 1 ; par5 = 12 ; par6 = 1 ; par7 = 1 ; par8 = 1 ; par9 = 1 ;
Parameters (R input):
par1 = FALSE ; par2 = 1 ; par3 = 0 ; par4 = 1 ; par5 = 12 ; par6 = 1 ; par7 = 1 ; par8 = 1 ; par9 = 1 ;
R code (references can be found in the software module):
library(lattice)
if (par1 == 'TRUE') par1 <- TRUE
if (par1 == 'FALSE') par1 <- FALSE
par2 <- as.numeric(par2) #Box-Cox lambda transformation parameter
par3 <- as.numeric(par3) #degree of non-seasonal differencing
par4 <- as.numeric(par4) #degree of seasonal differencing
par5 <- as.numeric(par5) #seasonal period
par6 <- as.numeric(par6) #degree (p) of the non-seasonal AR(p) polynomial
par7 <- as.numeric(par7) #degree (q) of the non-seasonal MA(q) polynomial
par8 <- as.numeric(par8) #degree (P) of the seasonal AR(P) polynomial
par9 <- as.numeric(par9) #degree (Q) of the seasonal MA(Q) polynomial
armaGR <- function(arima.out, names, n){
try1 <- arima.out$coef
try2 <- sqrt(diag(arima.out$var.coef))
try.data.frame <- data.frame(matrix(NA,ncol=4,nrow=length(names)))
dimnames(try.data.frame) <- list(names,c('coef','std','tstat','pv'))
try.data.frame[,1] <- try1
for(i in 1:length(try2)) try.data.frame[which(rownames(try.data.frame)==names(try2)[i]),2] <- try2[i]
try.data.frame[,3] <- try.data.frame[,1] / try.data.frame[,2]
try.data.frame[,4] <- round((1-pt(abs(try.data.frame[,3]),df=n-(length(try2)+1)))*2,5)
vector <- rep(NA,length(names))
vector[is.na(try.data.frame[,4])] <- 0
maxi <- which.max(try.data.frame[,4])
continue <- max(try.data.frame[,4],na.rm=TRUE) > .05
vector[maxi] <- 0
list(summary=try.data.frame,next.vector=vector,continue=continue)
}
arimaSelect <- function(series, order=c(13,0,0), seasonal=list(order=c(2,0,0),period=12), include.mean=F){
nrc <- order[1]+order[3]+seasonal$order[1]+seasonal$order[3]
coeff <- matrix(NA, nrow=nrc*2, ncol=nrc)
pval <- matrix(NA, nrow=nrc*2, ncol=nrc)
mylist <- rep(list(NULL), nrc)
names <- NULL
if(order[1] > 0) names <- paste('ar',1:order[1],sep='')
if(order[3] > 0) names <- c( names , paste('ma',1:order[3],sep='') )
if(seasonal$order[1] > 0) names <- c(names, paste('sar',1:seasonal$order[1],sep=''))
if(seasonal$order[3] > 0) names <- c(names, paste('sma',1:seasonal$order[3],sep=''))
arima.out <- arima(series, order=order, seasonal=seasonal, include.mean=include.mean, method='ML')
mylist[[1]] <- arima.out
last.arma <- armaGR(arima.out, names, length(series))
mystop <- FALSE
i <- 1
coeff[i,] <- last.arma[[1]][,1]
pval [i,] <- last.arma[[1]][,4]
i <- 2
aic <- arima.out$aic
while(!mystop){
mylist[[i]] <- arima.out
arima.out <- arima(series, order=order, seasonal=seasonal, include.mean=include.mean, method='ML', fixed=last.arma$next.vector)
aic <- c(aic, arima.out$aic)
last.arma <- armaGR(arima.out, names, length(series))
mystop <- !last.arma$continue
coeff[i,] <- last.arma[[1]][,1]
pval [i,] <- last.arma[[1]][,4]
i <- i+1
}
list(coeff, pval, mylist, aic=aic)
}
arimaSelectplot <- function(arimaSelect.out,noms,choix){
noms <- names(arimaSelect.out[[3]][[1]]$coef)
coeff <- arimaSelect.out[[1]]
k <- min(which(is.na(coeff[,1])))-1
coeff <- coeff[1:k,]
pval <- arimaSelect.out[[2]][1:k,]
aic <- arimaSelect.out$aic[1:k]
coeff[coeff==0] <- NA
n <- ncol(coeff)
if(missing(choix)) choix <- k
layout(matrix(c(1,1,1,2,
3,3,3,2,
3,3,3,4,
5,6,7,7),nr=4),
widths=c(10,35,45,15),
heights=c(30,30,15,15))
couleurs <- rainbow(75)[1:50]#(50)
ticks <- pretty(coeff)
par(mar=c(1,1,3,1))
plot(aic,k:1-.5,type='o',pch=21,bg='blue',cex=2,axes=F,lty=2,xpd=NA)
points(aic[choix],k-choix+.5,pch=21,cex=4,bg=2,xpd=NA)
title('aic',line=2)
par(mar=c(3,0,0,0))
plot(0,axes=F,xlab='',ylab='',xlim=range(ticks),ylim=c(.1,1))
rect(xleft = min(ticks) + (0:49)/50*(max(ticks)-min(ticks)),
xright = min(ticks) + (1:50)/50*(max(ticks)-min(ticks)),
ytop = rep(1,50),
ybottom= rep(0,50),col=couleurs,border=NA)
axis(1,ticks)
rect(xleft=min(ticks),xright=max(ticks),ytop=1,ybottom=0)
text(mean(coeff,na.rm=T),.5,'coefficients',cex=2,font=2)
par(mar=c(1,1,3,1))
image(1:n,1:k,t(coeff[k:1,]),axes=F,col=couleurs,zlim=range(ticks))
for(i in 1:n) for(j in 1:k) if(!is.na(coeff[j,i])) {
if(pval[j,i]<.01) symb = 'green'
else if( (pval[j,i]<.05) & (pval[j,i]>=.01)) symb = 'orange'
else if( (pval[j,i]<.1) & (pval[j,i]>=.05)) symb = 'red'
else symb = 'black'
polygon(c(i+.5 ,i+.2 ,i+.5 ,i+.5),
c(k-j+0.5,k-j+0.5,k-j+0.8,k-j+0.5),
col=symb)
if(j==choix) {
rect(xleft=i-.5,
xright=i+.5,
ybottom=k-j+1.5,
ytop=k-j+.5,
lwd=4)
text(i,
k-j+1,
round(coeff[j,i],2),
cex=1.2,
font=2)
}
else{
rect(xleft=i-.5,xright=i+.5,ybottom=k-j+1.5,ytop=k-j+.5)
text(i,k-j+1,round(coeff[j,i],2),cex=1.2,font=1)
}
}
axis(3,1:n,noms)
par(mar=c(0.5,0,0,0.5))
plot(0,axes=F,xlab='',ylab='',type='n',xlim=c(0,8),ylim=c(-.2,.8))
cols <- c('green','orange','red','black')
niv <- c('0','0.01','0.05','0.1')
for(i in 0:3){
polygon(c(1+2*i ,1+2*i ,1+2*i-.5 ,1+2*i),
c(.4 ,.7 , .4 , .4),
col=cols[i+1])
text(2*i,0.5,niv[i+1],cex=1.5)
}
text(8,.5,1,cex=1.5)
text(4,0,'p-value',cex=2)
box()
residus <- arimaSelect.out[[3]][[choix]]$res
par(mar=c(1,2,4,1))
acf(residus,main='')
title('acf',line=.5)
par(mar=c(1,2,4,1))
pacf(residus,main='')
title('pacf',line=.5)
par(mar=c(2,2,4,1))
qqnorm(residus,main='')
title('qq-norm',line=.5)
qqline(residus)
residus
}
if (par2 == 0) x <- log(x)
if (par2 != 0) x <- x^par2
(selection <- arimaSelect(x, order=c(par6,par3,par7), seasonal=list(order=c(par8,par4,par9), period=par5)))
bitmap(file='test1.png')
resid <- arimaSelectplot(selection)
dev.off()
resid
bitmap(file='test2.png')
acf(resid,length(resid)/2, main='Residual Autocorrelation Function')
dev.off()
bitmap(file='test3.png')
pacf(resid,length(resid)/2, main='Residual Partial Autocorrelation Function')
dev.off()
bitmap(file='test4.png')
cpgram(resid, main='Residual Cumulative Periodogram')
dev.off()
bitmap(file='test5.png')
hist(resid, main='Residual Histogram', xlab='values of Residuals')
dev.off()
bitmap(file='test6.png')
densityplot(~resid,col='black',main='Residual Density Plot', xlab='values of Residuals')
dev.off()
bitmap(file='test7.png')
qqnorm(resid, main='Residual Normal Q-Q Plot')
qqline(resid)
dev.off()
ncols <- length(selection[[1]][1,])
nrows <- length(selection[[2]][,1])-1
load(file='createtable')
a<-table.start()
a<-table.row.start(a)
a<-table.element(a,'ARIMA Parameter Estimation and Backward Selection', ncols+1,TRUE)
a<-table.row.end(a)
a<-table.row.start(a)
a<-table.element(a,'Iteration', header=TRUE)
for (i in 1:ncols) {
a<-table.element(a,names(selection[[3]][[1]]$coef)[i],header=TRUE)
}
a<-table.row.end(a)
for (j in 1:nrows) {
a<-table.row.start(a)
mydum <- 'Estimates ('
mydum <- paste(mydum,j)
mydum <- paste(mydum,')')
a<-table.element(a,mydum, header=TRUE)
for (i in 1:ncols) {
a<-table.element(a,round(selection[[1]][j,i],4))
}
a<-table.row.end(a)
a<-table.row.start(a)
a<-table.element(a,'(p-val)', header=TRUE)
for (i in 1:ncols) {
mydum <- '('
mydum <- paste(mydum,round(selection[[2]][j,i],4),sep='')
mydum <- paste(mydum,')')
a<-table.element(a,mydum)
}
a<-table.row.end(a)
}
a<-table.end(a)
table.save(a,file='mytable.tab')
a<-table.start()
a<-table.row.start(a)
a<-table.element(a,'Estimated ARIMA Residuals', 1,TRUE)
a<-table.row.end(a)
a<-table.row.start(a)
a<-table.element(a,'Value', 1,TRUE)
a<-table.row.end(a)
for (i in (par4*par5+par3):length(resid)) {
a<-table.row.start(a)
a<-table.element(a,resid[i])
a<-table.row.end(a)
}
a<-table.end(a)
table.save(a,file='mytable1.tab')