Free Statistics

of Irreproducible Research!

Author's title

Author*The author of this computation has been verified*
R Software Modulerwasp_smp.wasp
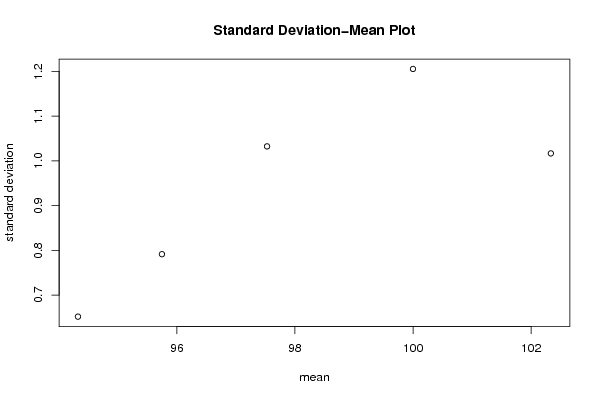
Title produced by softwareStandard Deviation-Mean Plot
Date of computationMon, 08 Dec 2008 12:27:06 -0700
Cite this page as followsStatistical Computations at FreeStatistics.org, Office for Research Development and Education, URL https://freestatistics.org/blog/index.php?v=date/2008/Dec/08/t1228764522j32n1p1hvqr4hav.htm/, Retrieved Thu, 16 May 2024 09:48:59 +0000
Statistical Computations at FreeStatistics.org, Office for Research Development and Education, URL https://freestatistics.org/blog/index.php?pk=30808, Retrieved Thu, 16 May 2024 09:48:59 +0000
QR Codes:

Original text written by user:
IsPrivate?No (this computation is public)
User-defined keywords
Estimated Impact186
Family? (F = Feedback message, R = changed R code, M = changed R Module, P = changed Parameters, D = changed Data)
-     [Univariate Data Series] [Run sequence plot...] [2008-12-02 22:19:27] [ed2ba3b6182103c15c0ab511ae4e6284]
F RMPD  [Standard Deviation-Mean Plot] [SD mean plot peri...] [2008-12-06 11:54:38] [ed2ba3b6182103c15c0ab511ae4e6284]
F           [Standard Deviation-Mean Plot] [SD mean plot 12] [2008-12-08 19:27:06] [577b699a0819d2125728ba9ae2c57238] [Current]
Feedback Forum
2008-12-14 14:31:06 [Roland Feldman] [reply
De p-waarde heeft betrekking op de beta-coefficient (= de helling van de scatterplot) en niet op de standaardfout.
2008-12-14 20:06:40 [Michaël De Kuyer] [reply
De beta-coëfficiënt is niet significant verschillend van nul, dus we moeten niet meer naar de volgende tabel kijken. Er is dus geen verband tussen het gemiddelde en de standaardafwijking. We veronderstellen wel dat er een transformatie moet gebeuren, maar we vinden deze niet, daarom stellen we de lambda gelijk aan 1.

Post a new message
Dataseries X:
92.66
94.2
94.37
94.45
94.62
94.37
93.43
94.79
94.88
94.79
94.62
94.71
93.77
95.73
95.99
95.82
95.47
95.82
94.71
96.33
96.5
96.16
96.33
96.33
95.05
96.84
96.92
97.44
97.78
97.69
96.67
98.29
98.2
98.71
98.54
98.2
96.92
99.06
99.65
99.82
99.99
100.33
99.31
101.1
101.1
100.93
100.85
100.93
99.6
101.88
101.81
102.38
102.74
102.82
101.72
103.47
102.98
102.68
102.9
103.03
101.29


Summary of computational transaction
Raw Inputview raw input (R code)
Raw Outputview raw output of R engine
Computing time2 seconds
R Server'George Udny Yule' @ 72.249.76.132

\begin{tabular}{lllllllll}
\hline
Summary of computational transaction \tabularnewline
Raw Input & view raw input (R code)  \tabularnewline
Raw Output & view raw output of R engine  \tabularnewline
Computing time & 2 seconds \tabularnewline
R Server & 'George Udny Yule' @ 72.249.76.132 \tabularnewline
\hline
\end{tabular}
%Source: https://freestatistics.org/blog/index.php?pk=30808&T=0

[TABLE]
[ROW][C]Summary of computational transaction[/C][/ROW]
[ROW][C]Raw Input[/C][C]view raw input (R code) [/C][/ROW]
[ROW][C]Raw Output[/C][C]view raw output of R engine [/C][/ROW]
[ROW][C]Computing time[/C][C]2 seconds[/C][/ROW]
[ROW][C]R Server[/C][C]'George Udny Yule' @ 72.249.76.132[/C][/ROW]
[/TABLE]
Source: https://freestatistics.org/blog/index.php?pk=30808&T=0

Globally Unique Identifier (entire table): ba.freestatistics.org/blog/index.php?pk=30808&T=0

As an alternative you can also use a QR Code:  

The GUIDs for individual cells are displayed in the table below:

Summary of computational transaction
Raw Inputview raw input (R code)
Raw Outputview raw output of R engine
Computing time2 seconds
R Server'George Udny Yule' @ 72.249.76.132


Standard Deviation-Mean Plot
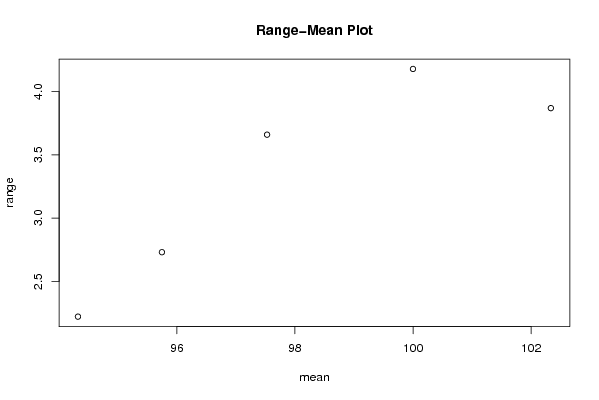
SectionMeanStandard DeviationRange
194.32416666666670.6516616290590382.22
295.74666666666670.791308850556912.73000000000000
397.52751.032306552426083.66
499.99916666666671.205377785617694.17999999999999
5102.3341666666671.01658482035183.87000000000000

\begin{tabular}{lllllllll}
\hline
Standard Deviation-Mean Plot \tabularnewline
Section & Mean & Standard Deviation & Range \tabularnewline
1 & 94.3241666666667 & 0.651661629059038 & 2.22 \tabularnewline
2 & 95.7466666666667 & 0.79130885055691 & 2.73000000000000 \tabularnewline
3 & 97.5275 & 1.03230655242608 & 3.66 \tabularnewline
4 & 99.9991666666667 & 1.20537778561769 & 4.17999999999999 \tabularnewline
5 & 102.334166666667 & 1.0165848203518 & 3.87000000000000 \tabularnewline
\hline
\end{tabular}
%Source: https://freestatistics.org/blog/index.php?pk=30808&T=1

[TABLE]
[ROW][C]Standard Deviation-Mean Plot[/C][/ROW]
[ROW][C]Section[/C][C]Mean[/C][C]Standard Deviation[/C][C]Range[/C][/ROW]
[ROW][C]1[/C][C]94.3241666666667[/C][C]0.651661629059038[/C][C]2.22[/C][/ROW]
[ROW][C]2[/C][C]95.7466666666667[/C][C]0.79130885055691[/C][C]2.73000000000000[/C][/ROW]
[ROW][C]3[/C][C]97.5275[/C][C]1.03230655242608[/C][C]3.66[/C][/ROW]
[ROW][C]4[/C][C]99.9991666666667[/C][C]1.20537778561769[/C][C]4.17999999999999[/C][/ROW]
[ROW][C]5[/C][C]102.334166666667[/C][C]1.0165848203518[/C][C]3.87000000000000[/C][/ROW]
[/TABLE]
Source: https://freestatistics.org/blog/index.php?pk=30808&T=1

Globally Unique Identifier (entire table): ba.freestatistics.org/blog/index.php?pk=30808&T=1

As an alternative you can also use a QR Code:  

The GUIDs for individual cells are displayed in the table below:

Standard Deviation-Mean Plot
SectionMeanStandard DeviationRange
194.32416666666670.6516616290590382.22
295.74666666666670.791308850556912.73000000000000
397.52751.032306552426083.66
499.99916666666671.205377785617694.17999999999999
5102.3341666666671.01658482035183.87000000000000


Regression: S.E.(k) = alpha + beta * Mean(k)
alpha-4.27574956214814
beta0.0532237232717873
S.D.0.0240601334687361
T-STAT2.21211255294766
p-value0.113877017161827

\begin{tabular}{lllllllll}
\hline
Regression: S.E.(k) = alpha + beta * Mean(k) \tabularnewline
alpha & -4.27574956214814 \tabularnewline
beta & 0.0532237232717873 \tabularnewline
S.D. & 0.0240601334687361 \tabularnewline
T-STAT & 2.21211255294766 \tabularnewline
p-value & 0.113877017161827 \tabularnewline
\hline
\end{tabular}
%Source: https://freestatistics.org/blog/index.php?pk=30808&T=2

[TABLE]
[ROW][C]Regression: S.E.(k) = alpha + beta * Mean(k)[/C][/ROW]
[ROW][C]alpha[/C][C]-4.27574956214814[/C][/ROW]
[ROW][C]beta[/C][C]0.0532237232717873[/C][/ROW]
[ROW][C]S.D.[/C][C]0.0240601334687361[/C][/ROW]
[ROW][C]T-STAT[/C][C]2.21211255294766[/C][/ROW]
[ROW][C]p-value[/C][C]0.113877017161827[/C][/ROW]
[/TABLE]
Source: https://freestatistics.org/blog/index.php?pk=30808&T=2

Globally Unique Identifier (entire table): ba.freestatistics.org/blog/index.php?pk=30808&T=2

As an alternative you can also use a QR Code:  

The GUIDs for individual cells are displayed in the table below:

Regression: S.E.(k) = alpha + beta * Mean(k)
alpha-4.27574956214814
beta0.0532237232717873
S.D.0.0240601334687361
T-STAT2.21211255294766
p-value0.113877017161827


Regression: ln S.E.(k) = alpha + beta * ln Mean(k)
alpha-27.6689574130391
beta6.01682355593603
S.D.2.51946351274346
T-STAT2.38813680988151
p-value0.0969039503467427
Lambda-5.01682355593603

\begin{tabular}{lllllllll}
\hline
Regression: ln S.E.(k) = alpha + beta * ln Mean(k) \tabularnewline
alpha & -27.6689574130391 \tabularnewline
beta & 6.01682355593603 \tabularnewline
S.D. & 2.51946351274346 \tabularnewline
T-STAT & 2.38813680988151 \tabularnewline
p-value & 0.0969039503467427 \tabularnewline
Lambda & -5.01682355593603 \tabularnewline
\hline
\end{tabular}
%Source: https://freestatistics.org/blog/index.php?pk=30808&T=3

[TABLE]
[ROW][C]Regression: ln S.E.(k) = alpha + beta * ln Mean(k)[/C][/ROW]
[ROW][C]alpha[/C][C]-27.6689574130391[/C][/ROW]
[ROW][C]beta[/C][C]6.01682355593603[/C][/ROW]
[ROW][C]S.D.[/C][C]2.51946351274346[/C][/ROW]
[ROW][C]T-STAT[/C][C]2.38813680988151[/C][/ROW]
[ROW][C]p-value[/C][C]0.0969039503467427[/C][/ROW]
[ROW][C]Lambda[/C][C]-5.01682355593603[/C][/ROW]
[/TABLE]
Source: https://freestatistics.org/blog/index.php?pk=30808&T=3

Globally Unique Identifier (entire table): ba.freestatistics.org/blog/index.php?pk=30808&T=3

As an alternative you can also use a QR Code:  

The GUIDs for individual cells are displayed in the table below:

Regression: ln S.E.(k) = alpha + beta * ln Mean(k)
alpha-27.6689574130391
beta6.01682355593603
S.D.2.51946351274346
T-STAT2.38813680988151
p-value0.0969039503467427
Lambda-5.01682355593603


Parameters (Session):
par1 = 12 ;
Parameters (R input):
par1 = 12 ;
R code (references can be found in the software module):
par1 <- as.numeric(par1)
(n <- length(x))
(np <- floor(n / par1))
arr <- array(NA,dim=c(par1,np))
j <- 0
k <- 1
for (i in 1:(np*par1))
{
j = j + 1
arr[j,k] <- x[i]
if (j == par1) {
j = 0
k=k+1
}
}
arr
arr.mean <- array(NA,dim=np)
arr.sd <- array(NA,dim=np)
arr.range <- array(NA,dim=np)
for (j in 1:np)
{
arr.mean[j] <- mean(arr[,j],na.rm=TRUE)
arr.sd[j] <- sd(arr[,j],na.rm=TRUE)
arr.range[j] <- max(arr[,j],na.rm=TRUE) - min(arr[,j],na.rm=TRUE)
}
arr.mean
arr.sd
arr.range
(lm1 <- lm(arr.sd~arr.mean))
(lnlm1 <- lm(log(arr.sd)~log(arr.mean)))
(lm2 <- lm(arr.range~arr.mean))
bitmap(file='test1.png')
plot(arr.mean,arr.sd,main='Standard Deviation-Mean Plot',xlab='mean',ylab='standard deviation')
dev.off()
bitmap(file='test2.png')
plot(arr.mean,arr.range,main='Range-Mean Plot',xlab='mean',ylab='range')
dev.off()
load(file='createtable')
a<-table.start()
a<-table.row.start(a)
a<-table.element(a,'Standard Deviation-Mean Plot',4,TRUE)
a<-table.row.end(a)
a<-table.row.start(a)
a<-table.element(a,'Section',header=TRUE)
a<-table.element(a,'Mean',header=TRUE)
a<-table.element(a,'Standard Deviation',header=TRUE)
a<-table.element(a,'Range',header=TRUE)
a<-table.row.end(a)
for (j in 1:np) {
a<-table.row.start(a)
a<-table.element(a,j,header=TRUE)
a<-table.element(a,arr.mean[j])
a<-table.element(a,arr.sd[j] )
a<-table.element(a,arr.range[j] )
a<-table.row.end(a)
}
a<-table.end(a)
table.save(a,file='mytable.tab')
a<-table.start()
a<-table.row.start(a)
a<-table.element(a,'Regression: S.E.(k) = alpha + beta * Mean(k)',2,TRUE)
a<-table.row.end(a)
a<-table.row.start(a)
a<-table.element(a,'alpha',header=TRUE)
a<-table.element(a,lm1$coefficients[[1]])
a<-table.row.end(a)
a<-table.row.start(a)
a<-table.element(a,'beta',header=TRUE)
a<-table.element(a,lm1$coefficients[[2]])
a<-table.row.end(a)
a<-table.row.start(a)
a<-table.element(a,'S.D.',header=TRUE)
a<-table.element(a,summary(lm1)$coefficients[2,2])
a<-table.row.end(a)
a<-table.row.start(a)
a<-table.element(a,'T-STAT',header=TRUE)
a<-table.element(a,summary(lm1)$coefficients[2,3])
a<-table.row.end(a)
a<-table.row.start(a)
a<-table.element(a,'p-value',header=TRUE)
a<-table.element(a,summary(lm1)$coefficients[2,4])
a<-table.row.end(a)
a<-table.end(a)
table.save(a,file='mytable1.tab')
a<-table.start()
a<-table.row.start(a)
a<-table.element(a,'Regression: ln S.E.(k) = alpha + beta * ln Mean(k)',2,TRUE)
a<-table.row.end(a)
a<-table.row.start(a)
a<-table.element(a,'alpha',header=TRUE)
a<-table.element(a,lnlm1$coefficients[[1]])
a<-table.row.end(a)
a<-table.row.start(a)
a<-table.element(a,'beta',header=TRUE)
a<-table.element(a,lnlm1$coefficients[[2]])
a<-table.row.end(a)
a<-table.row.start(a)
a<-table.element(a,'S.D.',header=TRUE)
a<-table.element(a,summary(lnlm1)$coefficients[2,2])
a<-table.row.end(a)
a<-table.row.start(a)
a<-table.element(a,'T-STAT',header=TRUE)
a<-table.element(a,summary(lnlm1)$coefficients[2,3])
a<-table.row.end(a)
a<-table.row.start(a)
a<-table.element(a,'p-value',header=TRUE)
a<-table.element(a,summary(lnlm1)$coefficients[2,4])
a<-table.row.end(a)
a<-table.row.start(a)
a<-table.element(a,'Lambda',header=TRUE)
a<-table.element(a,1-lnlm1$coefficients[[2]])
a<-table.row.end(a)
a<-table.end(a)
table.save(a,file='mytable2.tab')