Free Statistics

of Irreproducible Research!

Author's title

Author*The author of this computation has been verified*
R Software Modulerwasp_arimabackwardselection.wasp
Title produced by softwareARIMA Backward Selection
Date of computationMon, 08 Dec 2008 12:22:11 -0700
Cite this page as followsStatistical Computations at FreeStatistics.org, Office for Research Development and Education, URL https://freestatistics.org/blog/index.php?v=date/2008/Dec/08/t1228764274nj6cptqf3vfunub.htm/, Retrieved Thu, 16 May 2024 20:20:44 +0000
Statistical Computations at FreeStatistics.org, Office for Research Development and Education, URL https://freestatistics.org/blog/index.php?pk=30792, Retrieved Thu, 16 May 2024 20:20:44 +0000
QR Codes:

Original text written by user:
IsPrivate?No (this computation is public)
User-defined keywords
Estimated Impact175
Family? (F = Feedback message, R = changed R code, M = changed R Module, P = changed Parameters, D = changed Data)
-     [Univariate Data Series] [data set] [2008-12-01 19:54:57] [b98453cac15ba1066b407e146608df68]
F RMPD    [ARIMA Backward Selection] [step5] [2008-12-08 19:22:11] [e515c0250d6233b5d2604259ab52cebe] [Current]
Feedback Forum
2008-12-10 15:22:48 [Ken Van den Heuvel] [reply
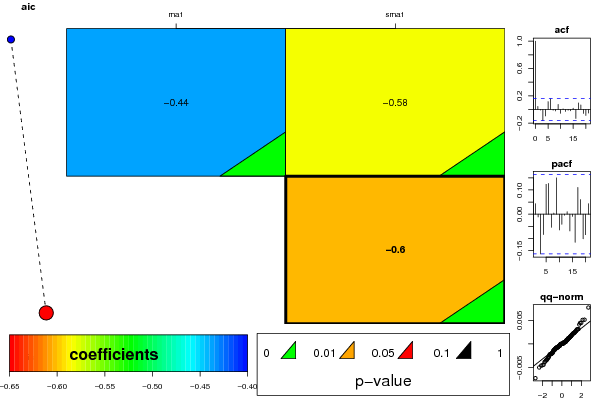
ARIMA Backward Selection:
We vullen volgende parameters in:
Lambda = 0,5
d = 1
D = 1
Seiz. = 12
Max p = 3
Max q = 1
Max P = 2
Max Q = 1

We maximaliseren de p, P, q en Q waarden zodat de module ons verschillende modellen toont.

De module heeft nu 4 verschillende modellen (rijen) berekend.

De parameters zie je bovenaan elke kolom.
AR1 = Ǿ1
AR2 = Ǿ2
AR3 = Ǿ3
…..

De getallen in de vierkante blokjes stemmen overeen met de berekende Phi-waarden en Théta-waarden.
De kleur van het vierkante blokje komt overeen met een bepaalde waarde op de schaal.

Het kleine driehoekje in elk blokje stelt de p-waarde voor.
Deze driehoekjes kunnen 4 verschillende kleuren hebben.
a) Groen: P-waarde = 0
b) Oranje: P-waarde =tussen 0,01 / 0,05
c) Rood: P-waarde = tussen 0,05 / 0,1
d) Zwart: P-waarde = tussen 0,1 / 1
Een grote p-waarde (zwart) zegt ons dat een bepaalde parameter niet significant is en dus kan weggelaten worden.

1) Eerste Rij

In de eerste rij zie je dat AR 3 niet significant is, het driehoekje is namelijk zwart. Eerde twijfelden we of we onze AR orde 2 of 3 was (cfr. verbetering vorige vraag), we namen toen p=3. De module toont ons nu dat de 3de term inderdaad niet significant was en p=2 een correcter beeld geeft. We hebben dus via deze methode al een twijfelgeval kunnen uitsluiten.

2) Tweede Rij

Omwille van voorvermelde reden (p=2) hebben we nu een AR 2 proces. We merken nu wel op dat er twee driehoekjes zijn bijgekomen die zwart kleuren. SAR 1 en SAR 2.
Deze worden ook geëlimineerd.
Eerder stelden we al vast dat er geen seizoenaal AR proces was (P=0). De module geeft ons dus gelijk.

3) Derde Rij

Hier heeft de computer SAR 2 weggelaten omdat deze de hoogste waarde van de twee had. We zien dat SAR 1 nog steeds een zwart driehoekje bevat.

4) Vierde Rij

Tenslotte krijgen we het finale model.
AR2 , MA1 en SMA1 Proces.

Merkwaardig is dat de module ons eveneens een MA1 component aangeeft, terwijl we deze eerder niet vaststelde. Het hangt er allemaal een beetje vanaf hoe groot onze eisen zijn. De MA1 component heeft een oranje driehoekje. Als we hoge eisen stellen en deze p-waarden te hoog vinden dan kunnen we deze MA1 component buitenbeschouwing laten .
2008-12-10 15:24:45 [Ken Van den Heuvel] [reply
Vervolgens dienen we nog de residu assumpties te controleren (geen autocorrelatie, normale distributie, vaste locatie en variantie.

Residual ACF
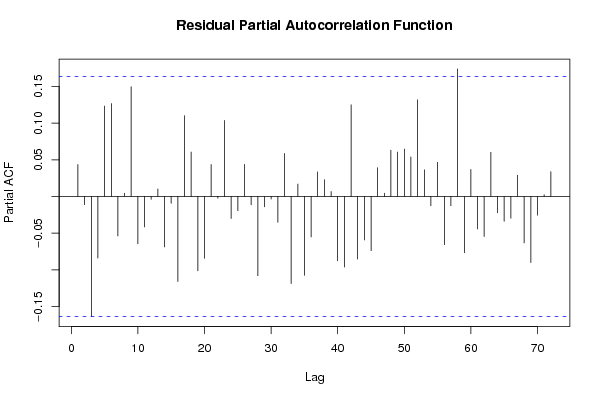
Residual Partial ACF

Er valt slechts 1 waarde buiten het interval. Gezien de lengte van onze reeks (200 observaties) is dit echter geen probleem. => geen autocorrelatie.

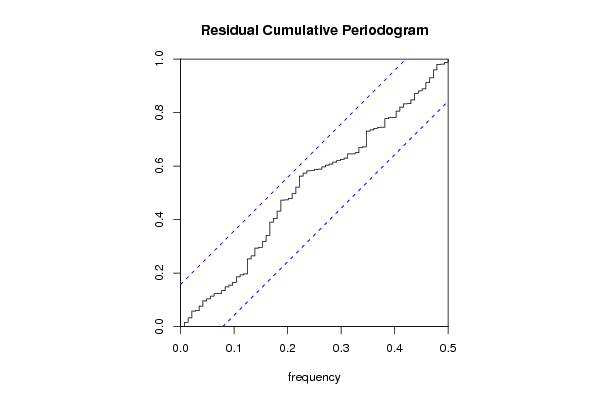
Residual Cumulative Periodogram

Perfect tussen interval.

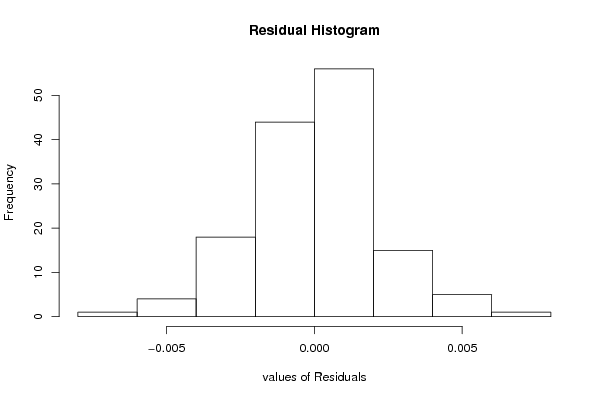
Residual Histogram en Residual Density Plot

Relatief mooie verdeling.

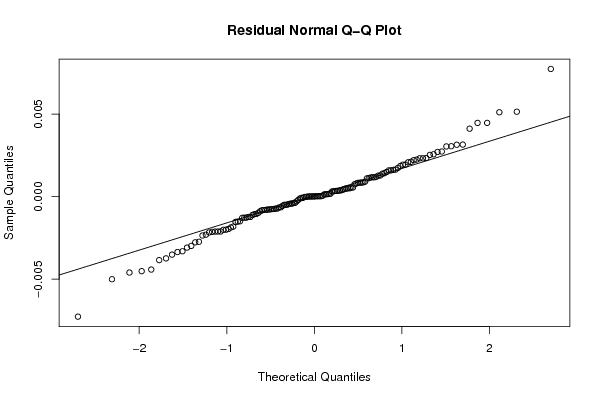
Residual QQ-plot

Kleine afwijking aan de staarten. Voor de rest wijst dit op een normaalverdeling.
=> normaal verdeeld.
=> vaste locatie en variantie is een resultaat van het stationair maken van onze reeks. Hieraan is dus ook voldaan.
2008-12-14 15:01:09 [Chi-Kwong Man] [reply
De lambda waarde moet hier 0,5 zijn denk ik ipv 0,3.
2008-12-15 12:44:27 [Kristof Augustyns] [reply
De uitleg van Ken Van Den Heuvel is correct en hier valt niets meer aan toe te voegen.
2008-12-15 17:07:42 [Lindsay Heyndrickx] [reply
Eerst hadden we dit moeten berekenen met de maximum parameters zodat er verschillende modellen getoond worden.
http://www.freestatistics.org/blog/date/2008/Dec/10/t1228924748sjwn9w7kr0z3olz.htm
Rij 3 is niet significant dus we hebben hier te maken met een AR2 proces. Dit wil dus zeggen dat we kleine p op 2 moeten zetten. Hier zien we ook dat het een niet seizonaal MA1 proces is. Dus we moeten de grote Q =1 bepalen.
Nadat we de juiste parameters gevonden hebben kunnen we naar de andere grafieken kijken. Deze wijzen op een perfecte normaalverdeling behalve in de staarten. Ook zien we dat er geen autocorrelatie meer te vinden is. Bij het residual cumulative periodogram ligt het perfect tussen het betrouwbaarheidsinterval.

Post a new message
Dataseries X:
112
118
132
129
121
135
148
148
136
119
104
118
115
126
141
135
125
149
170
170
158
133
114
140
145
150
178
163
172
178
199
199
184
162
146
166
171
180
193
181
183
218
230
242
209
191
172
194
196
196
236
235
229
243
264
272
237
211
180
201
204
188
235
227
234
264
302
293
259
229
203
229
242
233
267
269
270
315
364
347
312
274
237
278
284
277
317
313
318
374
413
405
355
306
271
306
315
301
356
348
355
422
465
467
404
347
305
336
340
318
362
348
363
435
491
505
404
359
310
337
360
342
406
396
420
472
548
559
463
407
362
405
417
391
419
461
472
535
622
606
508
461
390
432


Summary of computational transaction
Raw Inputview raw input (R code)
Raw Outputview raw output of R engine
Computing time3 seconds
R Server'George Udny Yule' @ 72.249.76.132

\begin{tabular}{lllllllll}
\hline
Summary of computational transaction \tabularnewline
Raw Input & view raw input (R code)  \tabularnewline
Raw Output & view raw output of R engine  \tabularnewline
Computing time & 3 seconds \tabularnewline
R Server & 'George Udny Yule' @ 72.249.76.132 \tabularnewline
\hline
\end{tabular}
%Source: https://freestatistics.org/blog/index.php?pk=30792&T=0

[TABLE]
[ROW][C]Summary of computational transaction[/C][/ROW]
[ROW][C]Raw Input[/C][C]view raw input (R code) [/C][/ROW]
[ROW][C]Raw Output[/C][C]view raw output of R engine [/C][/ROW]
[ROW][C]Computing time[/C][C]3 seconds[/C][/ROW]
[ROW][C]R Server[/C][C]'George Udny Yule' @ 72.249.76.132[/C][/ROW]
[/TABLE]
Source: https://freestatistics.org/blog/index.php?pk=30792&T=0

Globally Unique Identifier (entire table): ba.freestatistics.org/blog/index.php?pk=30792&T=0

As an alternative you can also use a QR Code:  

The GUIDs for individual cells are displayed in the table below:

Summary of computational transaction
Raw Inputview raw input (R code)
Raw Outputview raw output of R engine
Computing time3 seconds
R Server'George Udny Yule' @ 72.249.76.132


ARIMA Parameter Estimation and Backward Selection
Iterationma1sma1
Estimates ( 1 )-0.4357-0.5839
(p-val)(0 )(0 )
Estimates ( 2 )0-0.6011
(p-val)(NA )(0 )
Estimates ( 3 )NANA
(p-val)(NA )(NA )

\begin{tabular}{lllllllll}
\hline
ARIMA Parameter Estimation and Backward Selection \tabularnewline
Iteration & ma1 & sma1 \tabularnewline
Estimates ( 1 ) & -0.4357 & -0.5839 \tabularnewline
(p-val) & (0 ) & (0 ) \tabularnewline
Estimates ( 2 ) & 0 & -0.6011 \tabularnewline
(p-val) & (NA ) & (0 ) \tabularnewline
Estimates ( 3 ) & NA & NA \tabularnewline
(p-val) & (NA ) & (NA ) \tabularnewline
\hline
\end{tabular}
%Source: https://freestatistics.org/blog/index.php?pk=30792&T=1

[TABLE]
[ROW][C]ARIMA Parameter Estimation and Backward Selection[/C][/ROW]
[ROW][C]Iteration[/C][C]ma1[/C][C]sma1[/C][/ROW]
[ROW][C]Estimates ( 1 )[/C][C]-0.4357[/C][C]-0.5839[/C][/ROW]
[ROW][C](p-val)[/C][C](0 )[/C][C](0 )[/C][/ROW]
[ROW][C]Estimates ( 2 )[/C][C]0[/C][C]-0.6011[/C][/ROW]
[ROW][C](p-val)[/C][C](NA )[/C][C](0 )[/C][/ROW]
[ROW][C]Estimates ( 3 )[/C][C]NA[/C][C]NA[/C][/ROW]
[ROW][C](p-val)[/C][C](NA )[/C][C](NA )[/C][/ROW]
[/TABLE]
Source: https://freestatistics.org/blog/index.php?pk=30792&T=1

Globally Unique Identifier (entire table): ba.freestatistics.org/blog/index.php?pk=30792&T=1

As an alternative you can also use a QR Code:  

The GUIDs for individual cells are displayed in the table below:

ARIMA Parameter Estimation and Backward Selection
Iterationma1sma1
Estimates ( 1 )-0.4357-0.5839
(p-val)(0 )(0 )
Estimates ( 2 )0-0.6011
(p-val)(NA )(0 )
Estimates ( 3 )NANA
(p-val)(NA )(NA )


Estimated ARIMA Residuals
Value
-0.000830616394377666
-0.00217087736686087
-0.00074420026186913
0.000866119841126281
0.00110874338598884
-0.00331026578193515
-0.00351361885042004
-0.00153118277282079
-0.00151448840227860
0.00128356993671869
0.00149155950956391
-0.00384596939991697
-0.00500439657674154
0.000907992107513854
-0.00276740950533674
0.00194123854071811
-0.00727148922439195
0.00446821195533995
0.00256751291699350
0.00111852907130615
0.000177657731460723
-0.00230809272675960
-0.00441769167207709
0.00162132463434916
-0.00049312198322883
0.000423749128236736
0.00511269751267707
0.00234072362027584
-0.00072551585742207
-0.00451519874980857
0.00210677907882325
-0.00200516421155062
0.00270728256038345
-0.00273563233018959
-0.00335525321364332
0.00138692465325380
0.00117275074699273
0.00411699520424155
-0.00211294984586300
-0.00459962697401286
-0.00080868132220656
0.0044677884107055
0.00273416738878983
0.000797867790875228
0.00159034082068879
-0.00019429421298422
0.00185743250696807
0.0031536832361225
0.00142341371089048
0.00773690474936147
-0.00122796502113955
-0.000890201308304278
-0.00298483986549153
-0.00195899271811672
-0.00308854990361402
0.00173856199021156
0.000489803948920651
-7.72593594471491e-05
-0.00149297594400830
0.000355095235735099
-0.00213617186542915
0.000393237730359364
0.00314473906383679
-0.00128434623221824
-0.000499750275298062
-0.00210944855096696
-0.00235575372970138
0.00159015201133718
-0.000716011784037044
-0.000490589918802115
-1.9602998838638e-05
-0.00127204426096681
0.000147208797153351
1.32222078370964e-05
0.00220588003083355
0.000508748080129951
-0.000381693428320164
-0.00127543262710258
0.00120489050471911
0.000554161916804196
0.000471588988376432
0.000834013191674272
-0.00111566511058388
0.00117427761611580
0.000546117666793331
0.00127274282648352
0.000315423274288868
0.000369279485536819
-0.000374510269234132
-0.0010602179474654
0.000844734586164225
-0.000784692130776965
0.000164220602010325
0.000325140613146788
-0.000561904703047603
0.00224392259503174
0.00193384438190774
0.00252908555751111
0.00305429788271937
0.00232446856739655
-0.000444269271333975
-0.00105044905897234
-0.000781602944646357
-0.00211856556150784
0.00304184657900462
-0.000281481641659432
0.000346705980444821
0.00232321302099502
-0.00123221575118798
-0.000427009570773048
-0.000989407962138414
-0.000644459441726152
-0.00186615523708969
0.00208155260264458
-0.00042367049061435
-0.000810192534237934
-1.99748996837454e-05
-0.000651268353576058
-0.00181652506593953
-0.000751369959354825
0.000343749939033168
0.000753240688615269
0.00514546595725425
-0.00373880123457549
-0.000765740544340116
0.00115914031069109
-7.70375461684578e-05
0.00163688286465245
0.000141637907034179
-0.00200888870528688
0.000503575269585197
0.000851149357146722

\begin{tabular}{lllllllll}
\hline
Estimated ARIMA Residuals \tabularnewline
Value \tabularnewline
-0.000830616394377666 \tabularnewline
-0.00217087736686087 \tabularnewline
-0.00074420026186913 \tabularnewline
0.000866119841126281 \tabularnewline
0.00110874338598884 \tabularnewline
-0.00331026578193515 \tabularnewline
-0.00351361885042004 \tabularnewline
-0.00153118277282079 \tabularnewline
-0.00151448840227860 \tabularnewline
0.00128356993671869 \tabularnewline
0.00149155950956391 \tabularnewline
-0.00384596939991697 \tabularnewline
-0.00500439657674154 \tabularnewline
0.000907992107513854 \tabularnewline
-0.00276740950533674 \tabularnewline
0.00194123854071811 \tabularnewline
-0.00727148922439195 \tabularnewline
0.00446821195533995 \tabularnewline
0.00256751291699350 \tabularnewline
0.00111852907130615 \tabularnewline
0.000177657731460723 \tabularnewline
-0.00230809272675960 \tabularnewline
-0.00441769167207709 \tabularnewline
0.00162132463434916 \tabularnewline
-0.00049312198322883 \tabularnewline
0.000423749128236736 \tabularnewline
0.00511269751267707 \tabularnewline
0.00234072362027584 \tabularnewline
-0.00072551585742207 \tabularnewline
-0.00451519874980857 \tabularnewline
0.00210677907882325 \tabularnewline
-0.00200516421155062 \tabularnewline
0.00270728256038345 \tabularnewline
-0.00273563233018959 \tabularnewline
-0.00335525321364332 \tabularnewline
0.00138692465325380 \tabularnewline
0.00117275074699273 \tabularnewline
0.00411699520424155 \tabularnewline
-0.00211294984586300 \tabularnewline
-0.00459962697401286 \tabularnewline
-0.00080868132220656 \tabularnewline
0.0044677884107055 \tabularnewline
0.00273416738878983 \tabularnewline
0.000797867790875228 \tabularnewline
0.00159034082068879 \tabularnewline
-0.00019429421298422 \tabularnewline
0.00185743250696807 \tabularnewline
0.0031536832361225 \tabularnewline
0.00142341371089048 \tabularnewline
0.00773690474936147 \tabularnewline
-0.00122796502113955 \tabularnewline
-0.000890201308304278 \tabularnewline
-0.00298483986549153 \tabularnewline
-0.00195899271811672 \tabularnewline
-0.00308854990361402 \tabularnewline
0.00173856199021156 \tabularnewline
0.000489803948920651 \tabularnewline
-7.72593594471491e-05 \tabularnewline
-0.00149297594400830 \tabularnewline
0.000355095235735099 \tabularnewline
-0.00213617186542915 \tabularnewline
0.000393237730359364 \tabularnewline
0.00314473906383679 \tabularnewline
-0.00128434623221824 \tabularnewline
-0.000499750275298062 \tabularnewline
-0.00210944855096696 \tabularnewline
-0.00235575372970138 \tabularnewline
0.00159015201133718 \tabularnewline
-0.000716011784037044 \tabularnewline
-0.000490589918802115 \tabularnewline
-1.9602998838638e-05 \tabularnewline
-0.00127204426096681 \tabularnewline
0.000147208797153351 \tabularnewline
1.32222078370964e-05 \tabularnewline
0.00220588003083355 \tabularnewline
0.000508748080129951 \tabularnewline
-0.000381693428320164 \tabularnewline
-0.00127543262710258 \tabularnewline
0.00120489050471911 \tabularnewline
0.000554161916804196 \tabularnewline
0.000471588988376432 \tabularnewline
0.000834013191674272 \tabularnewline
-0.00111566511058388 \tabularnewline
0.00117427761611580 \tabularnewline
0.000546117666793331 \tabularnewline
0.00127274282648352 \tabularnewline
0.000315423274288868 \tabularnewline
0.000369279485536819 \tabularnewline
-0.000374510269234132 \tabularnewline
-0.0010602179474654 \tabularnewline
0.000844734586164225 \tabularnewline
-0.000784692130776965 \tabularnewline
0.000164220602010325 \tabularnewline
0.000325140613146788 \tabularnewline
-0.000561904703047603 \tabularnewline
0.00224392259503174 \tabularnewline
0.00193384438190774 \tabularnewline
0.00252908555751111 \tabularnewline
0.00305429788271937 \tabularnewline
0.00232446856739655 \tabularnewline
-0.000444269271333975 \tabularnewline
-0.00105044905897234 \tabularnewline
-0.000781602944646357 \tabularnewline
-0.00211856556150784 \tabularnewline
0.00304184657900462 \tabularnewline
-0.000281481641659432 \tabularnewline
0.000346705980444821 \tabularnewline
0.00232321302099502 \tabularnewline
-0.00123221575118798 \tabularnewline
-0.000427009570773048 \tabularnewline
-0.000989407962138414 \tabularnewline
-0.000644459441726152 \tabularnewline
-0.00186615523708969 \tabularnewline
0.00208155260264458 \tabularnewline
-0.00042367049061435 \tabularnewline
-0.000810192534237934 \tabularnewline
-1.99748996837454e-05 \tabularnewline
-0.000651268353576058 \tabularnewline
-0.00181652506593953 \tabularnewline
-0.000751369959354825 \tabularnewline
0.000343749939033168 \tabularnewline
0.000753240688615269 \tabularnewline
0.00514546595725425 \tabularnewline
-0.00373880123457549 \tabularnewline
-0.000765740544340116 \tabularnewline
0.00115914031069109 \tabularnewline
-7.70375461684578e-05 \tabularnewline
0.00163688286465245 \tabularnewline
0.000141637907034179 \tabularnewline
-0.00200888870528688 \tabularnewline
0.000503575269585197 \tabularnewline
0.000851149357146722 \tabularnewline
\hline
\end{tabular}
%Source: https://freestatistics.org/blog/index.php?pk=30792&T=2

[TABLE]
[ROW][C]Estimated ARIMA Residuals[/C][/ROW]
[ROW][C]Value[/C][/ROW]
[ROW][C]-0.000830616394377666[/C][/ROW]
[ROW][C]-0.00217087736686087[/C][/ROW]
[ROW][C]-0.00074420026186913[/C][/ROW]
[ROW][C]0.000866119841126281[/C][/ROW]
[ROW][C]0.00110874338598884[/C][/ROW]
[ROW][C]-0.00331026578193515[/C][/ROW]
[ROW][C]-0.00351361885042004[/C][/ROW]
[ROW][C]-0.00153118277282079[/C][/ROW]
[ROW][C]-0.00151448840227860[/C][/ROW]
[ROW][C]0.00128356993671869[/C][/ROW]
[ROW][C]0.00149155950956391[/C][/ROW]
[ROW][C]-0.00384596939991697[/C][/ROW]
[ROW][C]-0.00500439657674154[/C][/ROW]
[ROW][C]0.000907992107513854[/C][/ROW]
[ROW][C]-0.00276740950533674[/C][/ROW]
[ROW][C]0.00194123854071811[/C][/ROW]
[ROW][C]-0.00727148922439195[/C][/ROW]
[ROW][C]0.00446821195533995[/C][/ROW]
[ROW][C]0.00256751291699350[/C][/ROW]
[ROW][C]0.00111852907130615[/C][/ROW]
[ROW][C]0.000177657731460723[/C][/ROW]
[ROW][C]-0.00230809272675960[/C][/ROW]
[ROW][C]-0.00441769167207709[/C][/ROW]
[ROW][C]0.00162132463434916[/C][/ROW]
[ROW][C]-0.00049312198322883[/C][/ROW]
[ROW][C]0.000423749128236736[/C][/ROW]
[ROW][C]0.00511269751267707[/C][/ROW]
[ROW][C]0.00234072362027584[/C][/ROW]
[ROW][C]-0.00072551585742207[/C][/ROW]
[ROW][C]-0.00451519874980857[/C][/ROW]
[ROW][C]0.00210677907882325[/C][/ROW]
[ROW][C]-0.00200516421155062[/C][/ROW]
[ROW][C]0.00270728256038345[/C][/ROW]
[ROW][C]-0.00273563233018959[/C][/ROW]
[ROW][C]-0.00335525321364332[/C][/ROW]
[ROW][C]0.00138692465325380[/C][/ROW]
[ROW][C]0.00117275074699273[/C][/ROW]
[ROW][C]0.00411699520424155[/C][/ROW]
[ROW][C]-0.00211294984586300[/C][/ROW]
[ROW][C]-0.00459962697401286[/C][/ROW]
[ROW][C]-0.00080868132220656[/C][/ROW]
[ROW][C]0.0044677884107055[/C][/ROW]
[ROW][C]0.00273416738878983[/C][/ROW]
[ROW][C]0.000797867790875228[/C][/ROW]
[ROW][C]0.00159034082068879[/C][/ROW]
[ROW][C]-0.00019429421298422[/C][/ROW]
[ROW][C]0.00185743250696807[/C][/ROW]
[ROW][C]0.0031536832361225[/C][/ROW]
[ROW][C]0.00142341371089048[/C][/ROW]
[ROW][C]0.00773690474936147[/C][/ROW]
[ROW][C]-0.00122796502113955[/C][/ROW]
[ROW][C]-0.000890201308304278[/C][/ROW]
[ROW][C]-0.00298483986549153[/C][/ROW]
[ROW][C]-0.00195899271811672[/C][/ROW]
[ROW][C]-0.00308854990361402[/C][/ROW]
[ROW][C]0.00173856199021156[/C][/ROW]
[ROW][C]0.000489803948920651[/C][/ROW]
[ROW][C]-7.72593594471491e-05[/C][/ROW]
[ROW][C]-0.00149297594400830[/C][/ROW]
[ROW][C]0.000355095235735099[/C][/ROW]
[ROW][C]-0.00213617186542915[/C][/ROW]
[ROW][C]0.000393237730359364[/C][/ROW]
[ROW][C]0.00314473906383679[/C][/ROW]
[ROW][C]-0.00128434623221824[/C][/ROW]
[ROW][C]-0.000499750275298062[/C][/ROW]
[ROW][C]-0.00210944855096696[/C][/ROW]
[ROW][C]-0.00235575372970138[/C][/ROW]
[ROW][C]0.00159015201133718[/C][/ROW]
[ROW][C]-0.000716011784037044[/C][/ROW]
[ROW][C]-0.000490589918802115[/C][/ROW]
[ROW][C]-1.9602998838638e-05[/C][/ROW]
[ROW][C]-0.00127204426096681[/C][/ROW]
[ROW][C]0.000147208797153351[/C][/ROW]
[ROW][C]1.32222078370964e-05[/C][/ROW]
[ROW][C]0.00220588003083355[/C][/ROW]
[ROW][C]0.000508748080129951[/C][/ROW]
[ROW][C]-0.000381693428320164[/C][/ROW]
[ROW][C]-0.00127543262710258[/C][/ROW]
[ROW][C]0.00120489050471911[/C][/ROW]
[ROW][C]0.000554161916804196[/C][/ROW]
[ROW][C]0.000471588988376432[/C][/ROW]
[ROW][C]0.000834013191674272[/C][/ROW]
[ROW][C]-0.00111566511058388[/C][/ROW]
[ROW][C]0.00117427761611580[/C][/ROW]
[ROW][C]0.000546117666793331[/C][/ROW]
[ROW][C]0.00127274282648352[/C][/ROW]
[ROW][C]0.000315423274288868[/C][/ROW]
[ROW][C]0.000369279485536819[/C][/ROW]
[ROW][C]-0.000374510269234132[/C][/ROW]
[ROW][C]-0.0010602179474654[/C][/ROW]
[ROW][C]0.000844734586164225[/C][/ROW]
[ROW][C]-0.000784692130776965[/C][/ROW]
[ROW][C]0.000164220602010325[/C][/ROW]
[ROW][C]0.000325140613146788[/C][/ROW]
[ROW][C]-0.000561904703047603[/C][/ROW]
[ROW][C]0.00224392259503174[/C][/ROW]
[ROW][C]0.00193384438190774[/C][/ROW]
[ROW][C]0.00252908555751111[/C][/ROW]
[ROW][C]0.00305429788271937[/C][/ROW]
[ROW][C]0.00232446856739655[/C][/ROW]
[ROW][C]-0.000444269271333975[/C][/ROW]
[ROW][C]-0.00105044905897234[/C][/ROW]
[ROW][C]-0.000781602944646357[/C][/ROW]
[ROW][C]-0.00211856556150784[/C][/ROW]
[ROW][C]0.00304184657900462[/C][/ROW]
[ROW][C]-0.000281481641659432[/C][/ROW]
[ROW][C]0.000346705980444821[/C][/ROW]
[ROW][C]0.00232321302099502[/C][/ROW]
[ROW][C]-0.00123221575118798[/C][/ROW]
[ROW][C]-0.000427009570773048[/C][/ROW]
[ROW][C]-0.000989407962138414[/C][/ROW]
[ROW][C]-0.000644459441726152[/C][/ROW]
[ROW][C]-0.00186615523708969[/C][/ROW]
[ROW][C]0.00208155260264458[/C][/ROW]
[ROW][C]-0.00042367049061435[/C][/ROW]
[ROW][C]-0.000810192534237934[/C][/ROW]
[ROW][C]-1.99748996837454e-05[/C][/ROW]
[ROW][C]-0.000651268353576058[/C][/ROW]
[ROW][C]-0.00181652506593953[/C][/ROW]
[ROW][C]-0.000751369959354825[/C][/ROW]
[ROW][C]0.000343749939033168[/C][/ROW]
[ROW][C]0.000753240688615269[/C][/ROW]
[ROW][C]0.00514546595725425[/C][/ROW]
[ROW][C]-0.00373880123457549[/C][/ROW]
[ROW][C]-0.000765740544340116[/C][/ROW]
[ROW][C]0.00115914031069109[/C][/ROW]
[ROW][C]-7.70375461684578e-05[/C][/ROW]
[ROW][C]0.00163688286465245[/C][/ROW]
[ROW][C]0.000141637907034179[/C][/ROW]
[ROW][C]-0.00200888870528688[/C][/ROW]
[ROW][C]0.000503575269585197[/C][/ROW]
[ROW][C]0.000851149357146722[/C][/ROW]
[/TABLE]
Source: https://freestatistics.org/blog/index.php?pk=30792&T=2

Globally Unique Identifier (entire table): ba.freestatistics.org/blog/index.php?pk=30792&T=2

As an alternative you can also use a QR Code:  

The GUIDs for individual cells are displayed in the table below:

Estimated ARIMA Residuals
Value
-0.000830616394377666
-0.00217087736686087
-0.00074420026186913
0.000866119841126281
0.00110874338598884
-0.00331026578193515
-0.00351361885042004
-0.00153118277282079
-0.00151448840227860
0.00128356993671869
0.00149155950956391
-0.00384596939991697
-0.00500439657674154
0.000907992107513854
-0.00276740950533674
0.00194123854071811
-0.00727148922439195
0.00446821195533995
0.00256751291699350
0.00111852907130615
0.000177657731460723
-0.00230809272675960
-0.00441769167207709
0.00162132463434916
-0.00049312198322883
0.000423749128236736
0.00511269751267707
0.00234072362027584
-0.00072551585742207
-0.00451519874980857
0.00210677907882325
-0.00200516421155062
0.00270728256038345
-0.00273563233018959
-0.00335525321364332
0.00138692465325380
0.00117275074699273
0.00411699520424155
-0.00211294984586300
-0.00459962697401286
-0.00080868132220656
0.0044677884107055
0.00273416738878983
0.000797867790875228
0.00159034082068879
-0.00019429421298422
0.00185743250696807
0.0031536832361225
0.00142341371089048
0.00773690474936147
-0.00122796502113955
-0.000890201308304278
-0.00298483986549153
-0.00195899271811672
-0.00308854990361402
0.00173856199021156
0.000489803948920651
-7.72593594471491e-05
-0.00149297594400830
0.000355095235735099
-0.00213617186542915
0.000393237730359364
0.00314473906383679
-0.00128434623221824
-0.000499750275298062
-0.00210944855096696
-0.00235575372970138
0.00159015201133718
-0.000716011784037044
-0.000490589918802115
-1.9602998838638e-05
-0.00127204426096681
0.000147208797153351
1.32222078370964e-05
0.00220588003083355
0.000508748080129951
-0.000381693428320164
-0.00127543262710258
0.00120489050471911
0.000554161916804196
0.000471588988376432
0.000834013191674272
-0.00111566511058388
0.00117427761611580
0.000546117666793331
0.00127274282648352
0.000315423274288868
0.000369279485536819
-0.000374510269234132
-0.0010602179474654
0.000844734586164225
-0.000784692130776965
0.000164220602010325
0.000325140613146788
-0.000561904703047603
0.00224392259503174
0.00193384438190774
0.00252908555751111
0.00305429788271937
0.00232446856739655
-0.000444269271333975
-0.00105044905897234
-0.000781602944646357
-0.00211856556150784
0.00304184657900462
-0.000281481641659432
0.000346705980444821
0.00232321302099502
-0.00123221575118798
-0.000427009570773048
-0.000989407962138414
-0.000644459441726152
-0.00186615523708969
0.00208155260264458
-0.00042367049061435
-0.000810192534237934
-1.99748996837454e-05
-0.000651268353576058
-0.00181652506593953
-0.000751369959354825
0.000343749939033168
0.000753240688615269
0.00514546595725425
-0.00373880123457549
-0.000765740544340116
0.00115914031069109
-7.70375461684578e-05
0.00163688286465245
0.000141637907034179
-0.00200888870528688
0.000503575269585197
0.000851149357146722


Parameters (Session):
par1 = FALSE ; par2 = -0.3 ; par3 = 1 ; par4 = 1 ; par5 = 12 ; par6 = 0 ; par7 = 1 ; par8 = 0 ; par9 = 1 ;
Parameters (R input):
par1 = FALSE ; par2 = -0.3 ; par3 = 1 ; par4 = 1 ; par5 = 12 ; par6 = 0 ; par7 = 1 ; par8 = 0 ; par9 = 1 ;
R code (references can be found in the software module):
library(lattice)
if (par1 == 'TRUE') par1 <- TRUE
if (par1 == 'FALSE') par1 <- FALSE
par2 <- as.numeric(par2) #Box-Cox lambda transformation parameter
par3 <- as.numeric(par3) #degree of non-seasonal differencing
par4 <- as.numeric(par4) #degree of seasonal differencing
par5 <- as.numeric(par5) #seasonal period
par6 <- as.numeric(par6) #degree (p) of the non-seasonal AR(p) polynomial
par7 <- as.numeric(par7) #degree (q) of the non-seasonal MA(q) polynomial
par8 <- as.numeric(par8) #degree (P) of the seasonal AR(P) polynomial
par9 <- as.numeric(par9) #degree (Q) of the seasonal MA(Q) polynomial
armaGR <- function(arima.out, names, n){
try1 <- arima.out$coef
try2 <- sqrt(diag(arima.out$var.coef))
try.data.frame <- data.frame(matrix(NA,ncol=4,nrow=length(names)))
dimnames(try.data.frame) <- list(names,c('coef','std','tstat','pv'))
try.data.frame[,1] <- try1
for(i in 1:length(try2)) try.data.frame[which(rownames(try.data.frame)==names(try2)[i]),2] <- try2[i]
try.data.frame[,3] <- try.data.frame[,1] / try.data.frame[,2]
try.data.frame[,4] <- round((1-pt(abs(try.data.frame[,3]),df=n-(length(try2)+1)))*2,5)
vector <- rep(NA,length(names))
vector[is.na(try.data.frame[,4])] <- 0
maxi <- which.max(try.data.frame[,4])
continue <- max(try.data.frame[,4],na.rm=TRUE) > .05
vector[maxi] <- 0
list(summary=try.data.frame,next.vector=vector,continue=continue)
}
arimaSelect <- function(series, order=c(13,0,0), seasonal=list(order=c(2,0,0),period=12), include.mean=F){
nrc <- order[1]+order[3]+seasonal$order[1]+seasonal$order[3]
coeff <- matrix(NA, nrow=nrc*2, ncol=nrc)
pval <- matrix(NA, nrow=nrc*2, ncol=nrc)
mylist <- rep(list(NULL), nrc)
names <- NULL
if(order[1] > 0) names <- paste('ar',1:order[1],sep='')
if(order[3] > 0) names <- c( names , paste('ma',1:order[3],sep='') )
if(seasonal$order[1] > 0) names <- c(names, paste('sar',1:seasonal$order[1],sep=''))
if(seasonal$order[3] > 0) names <- c(names, paste('sma',1:seasonal$order[3],sep=''))
arima.out <- arima(series, order=order, seasonal=seasonal, include.mean=include.mean, method='ML')
mylist[[1]] <- arima.out
last.arma <- armaGR(arima.out, names, length(series))
mystop <- FALSE
i <- 1
coeff[i,] <- last.arma[[1]][,1]
pval [i,] <- last.arma[[1]][,4]
i <- 2
aic <- arima.out$aic
while(!mystop){
mylist[[i]] <- arima.out
arima.out <- arima(series, order=order, seasonal=seasonal, include.mean=include.mean, method='ML', fixed=last.arma$next.vector)
aic <- c(aic, arima.out$aic)
last.arma <- armaGR(arima.out, names, length(series))
mystop <- !last.arma$continue
coeff[i,] <- last.arma[[1]][,1]
pval [i,] <- last.arma[[1]][,4]
i <- i+1
}
list(coeff, pval, mylist, aic=aic)
}
arimaSelectplot <- function(arimaSelect.out,noms,choix){
noms <- names(arimaSelect.out[[3]][[1]]$coef)
coeff <- arimaSelect.out[[1]]
k <- min(which(is.na(coeff[,1])))-1
coeff <- coeff[1:k,]
pval <- arimaSelect.out[[2]][1:k,]
aic <- arimaSelect.out$aic[1:k]
coeff[coeff==0] <- NA
n <- ncol(coeff)
if(missing(choix)) choix <- k
layout(matrix(c(1,1,1,2,
3,3,3,2,
3,3,3,4,
5,6,7,7),nr=4),
widths=c(10,35,45,15),
heights=c(30,30,15,15))
couleurs <- rainbow(75)[1:50]#(50)
ticks <- pretty(coeff)
par(mar=c(1,1,3,1))
plot(aic,k:1-.5,type='o',pch=21,bg='blue',cex=2,axes=F,lty=2,xpd=NA)
points(aic[choix],k-choix+.5,pch=21,cex=4,bg=2,xpd=NA)
title('aic',line=2)
par(mar=c(3,0,0,0))
plot(0,axes=F,xlab='',ylab='',xlim=range(ticks),ylim=c(.1,1))
rect(xleft = min(ticks) + (0:49)/50*(max(ticks)-min(ticks)),
xright = min(ticks) + (1:50)/50*(max(ticks)-min(ticks)),
ytop = rep(1,50),
ybottom= rep(0,50),col=couleurs,border=NA)
axis(1,ticks)
rect(xleft=min(ticks),xright=max(ticks),ytop=1,ybottom=0)
text(mean(coeff,na.rm=T),.5,'coefficients',cex=2,font=2)
par(mar=c(1,1,3,1))
image(1:n,1:k,t(coeff[k:1,]),axes=F,col=couleurs,zlim=range(ticks))
for(i in 1:n) for(j in 1:k) if(!is.na(coeff[j,i])) {
if(pval[j,i]<.01) symb = 'green'
else if( (pval[j,i]<.05) & (pval[j,i]>=.01)) symb = 'orange'
else if( (pval[j,i]<.1) & (pval[j,i]>=.05)) symb = 'red'
else symb = 'black'
polygon(c(i+.5 ,i+.2 ,i+.5 ,i+.5),
c(k-j+0.5,k-j+0.5,k-j+0.8,k-j+0.5),
col=symb)
if(j==choix) {
rect(xleft=i-.5,
xright=i+.5,
ybottom=k-j+1.5,
ytop=k-j+.5,
lwd=4)
text(i,
k-j+1,
round(coeff[j,i],2),
cex=1.2,
font=2)
}
else{
rect(xleft=i-.5,xright=i+.5,ybottom=k-j+1.5,ytop=k-j+.5)
text(i,k-j+1,round(coeff[j,i],2),cex=1.2,font=1)
}
}
axis(3,1:n,noms)
par(mar=c(0.5,0,0,0.5))
plot(0,axes=F,xlab='',ylab='',type='n',xlim=c(0,8),ylim=c(-.2,.8))
cols <- c('green','orange','red','black')
niv <- c('0','0.01','0.05','0.1')
for(i in 0:3){
polygon(c(1+2*i ,1+2*i ,1+2*i-.5 ,1+2*i),
c(.4 ,.7 , .4 , .4),
col=cols[i+1])
text(2*i,0.5,niv[i+1],cex=1.5)
}
text(8,.5,1,cex=1.5)
text(4,0,'p-value',cex=2)
box()
residus <- arimaSelect.out[[3]][[choix]]$res
par(mar=c(1,2,4,1))
acf(residus,main='')
title('acf',line=.5)
par(mar=c(1,2,4,1))
pacf(residus,main='')
title('pacf',line=.5)
par(mar=c(2,2,4,1))
qqnorm(residus,main='')
title('qq-norm',line=.5)
qqline(residus)
residus
}
if (par2 == 0) x <- log(x)
if (par2 != 0) x <- x^par2
(selection <- arimaSelect(x, order=c(par6,par3,par7), seasonal=list(order=c(par8,par4,par9), period=par5)))
bitmap(file='test1.png')
resid <- arimaSelectplot(selection)
dev.off()
resid
bitmap(file='test2.png')
acf(resid,length(resid)/2, main='Residual Autocorrelation Function')
dev.off()
bitmap(file='test3.png')
pacf(resid,length(resid)/2, main='Residual Partial Autocorrelation Function')
dev.off()
bitmap(file='test4.png')
cpgram(resid, main='Residual Cumulative Periodogram')
dev.off()
bitmap(file='test5.png')
hist(resid, main='Residual Histogram', xlab='values of Residuals')
dev.off()
bitmap(file='test6.png')
densityplot(~resid,col='black',main='Residual Density Plot', xlab='values of Residuals')
dev.off()
bitmap(file='test7.png')
qqnorm(resid, main='Residual Normal Q-Q Plot')
qqline(resid)
dev.off()
ncols <- length(selection[[1]][1,])
nrows <- length(selection[[2]][,1])-1
load(file='createtable')
a<-table.start()
a<-table.row.start(a)
a<-table.element(a,'ARIMA Parameter Estimation and Backward Selection', ncols+1,TRUE)
a<-table.row.end(a)
a<-table.row.start(a)
a<-table.element(a,'Iteration', header=TRUE)
for (i in 1:ncols) {
a<-table.element(a,names(selection[[3]][[1]]$coef)[i],header=TRUE)
}
a<-table.row.end(a)
for (j in 1:nrows) {
a<-table.row.start(a)
mydum <- 'Estimates ('
mydum <- paste(mydum,j)
mydum <- paste(mydum,')')
a<-table.element(a,mydum, header=TRUE)
for (i in 1:ncols) {
a<-table.element(a,round(selection[[1]][j,i],4))
}
a<-table.row.end(a)
a<-table.row.start(a)
a<-table.element(a,'(p-val)', header=TRUE)
for (i in 1:ncols) {
mydum <- '('
mydum <- paste(mydum,round(selection[[2]][j,i],4),sep='')
mydum <- paste(mydum,')')
a<-table.element(a,mydum)
}
a<-table.row.end(a)
}
a<-table.end(a)
table.save(a,file='mytable.tab')
a<-table.start()
a<-table.row.start(a)
a<-table.element(a,'Estimated ARIMA Residuals', 1,TRUE)
a<-table.row.end(a)
a<-table.row.start(a)
a<-table.element(a,'Value', 1,TRUE)
a<-table.row.end(a)
for (i in (par4*par5+par3):length(resid)) {
a<-table.row.start(a)
a<-table.element(a,resid[i])
a<-table.row.end(a)
}
a<-table.end(a)
table.save(a,file='mytable1.tab')