Free Statistics

of Irreproducible Research!

Author's title

Author*The author of this computation has been verified*
R Software Modulerwasp_autocorrelation.wasp
Title produced by software(Partial) Autocorrelation Function
Date of computationMon, 08 Dec 2008 12:23:30 -0700
Cite this page as followsStatistical Computations at FreeStatistics.org, Office for Research Development and Education, URL https://freestatistics.org/blog/index.php?v=date/2008/Dec/08/t12287642407en9c32zscw9a5w.htm/, Retrieved Thu, 16 May 2024 04:54:37 +0000
Statistical Computations at FreeStatistics.org, Office for Research Development and Education, URL https://freestatistics.org/blog/index.php?pk=30790, Retrieved Thu, 16 May 2024 04:54:37 +0000
QR Codes:

Original text written by user:
IsPrivate?No (this computation is public)
User-defined keywords
Estimated Impact168
Family? (F = Feedback message, R = changed R code, M = changed R Module, P = changed Parameters, D = changed Data)
F     [ARIMA Backward Selection] [] [2008-12-07 14:04:55] [74be16979710d4c4e7c6647856088456]
- RMPD    [(Partial) Autocorrelation Function] [] [2008-12-08 19:23:30] [19ef54504342c1b076371d395a2ab19f] [Current]
Feedback Forum

Post a new message
Dataseries X:
31514
27071
29462
26105
22397
23843
21705
18089
20764
25316
17704
15548
28029
29383
36438
32034
22679
24319
18004
17537
20366
22782
19169
13807
29743
25591
29096
26482
22405
27044
17970
18730
19684
19785
18479
10698
31956
29506
34506
27165
26736
23691
18157
17328
18205
20995
17382
9367
31124
26551
30651
25859
25100
25778
20418
18688
20424
24776
19814
12738
31566
30111
30019
31934
25826
26835


Summary of computational transaction
Raw Inputview raw input (R code)
Raw Outputview raw output of R engine
Computing time4 seconds
R Server'Herman Ole Andreas Wold' @ 193.190.124.10:1001

\begin{tabular}{lllllllll}
\hline
Summary of computational transaction \tabularnewline
Raw Input & view raw input (R code)  \tabularnewline
Raw Output & view raw output of R engine  \tabularnewline
Computing time & 4 seconds \tabularnewline
R Server & 'Herman Ole Andreas Wold' @ 193.190.124.10:1001 \tabularnewline
\hline
\end{tabular}
%Source: https://freestatistics.org/blog/index.php?pk=30790&T=0

[TABLE]
[ROW][C]Summary of computational transaction[/C][/ROW]
[ROW][C]Raw Input[/C][C]view raw input (R code) [/C][/ROW]
[ROW][C]Raw Output[/C][C]view raw output of R engine [/C][/ROW]
[ROW][C]Computing time[/C][C]4 seconds[/C][/ROW]
[ROW][C]R Server[/C][C]'Herman Ole Andreas Wold' @ 193.190.124.10:1001[/C][/ROW]
[/TABLE]
Source: https://freestatistics.org/blog/index.php?pk=30790&T=0

Globally Unique Identifier (entire table): ba.freestatistics.org/blog/index.php?pk=30790&T=0

As an alternative you can also use a QR Code:  

The GUIDs for individual cells are displayed in the table below:

Summary of computational transaction
Raw Inputview raw input (R code)
Raw Outputview raw output of R engine
Computing time4 seconds
R Server'Herman Ole Andreas Wold' @ 193.190.124.10:1001


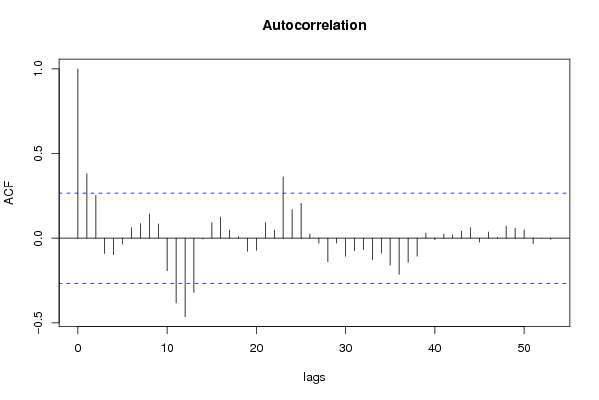
Autocorrelation Function
Time lag kACF(k)T-STATP-value
10.3811282.80070.003531
20.2526291.85640.034425
3-0.089829-0.66010.255996
4-0.097421-0.71590.238569
5-0.034317-0.25220.40093
60.0620080.45570.32523
70.0864250.63510.264026
80.1430411.05110.148939
90.0841460.61830.269475
10-0.192641-1.41560.081314
11-0.38194-2.80670.003474
12-0.463262-3.40430.000629
13-0.319712-2.34940.011246
14-0.003996-0.02940.488341
150.0916770.67370.251692
160.1251570.91970.180906
170.0489410.35960.360259
180.0088750.06520.474122
19-0.07694-0.56540.287075
20-0.071503-0.52540.300716
210.0926120.68060.24953
220.048890.35930.360399
230.3620642.66060.005124
240.1685781.23880.11039
250.206271.51580.067705
260.0254170.18680.426267
27-0.029477-0.21660.414664
28-0.139193-1.02290.155469
29-0.028676-0.21070.416947
30-0.106946-0.78590.217683
31-0.07401-0.54390.294389
32-0.067527-0.49620.310878
33-0.127719-0.93850.176073
34-0.088718-0.65190.258601
35-0.159359-1.1710.12336
36-0.213455-1.56860.061295
37-0.142289-1.04560.150201
38-0.106128-0.77990.219434
390.0300030.22050.413167
40-0.008975-0.0660.473828
410.0246210.18090.428551
420.0184560.13560.446311
430.0416790.30630.380286
440.0621210.45650.324933
45-0.022653-0.16650.434208
460.0362410.26630.395505
470.0064710.04760.481123
480.0708630.52070.302341
490.0587150.43150.333923
500.0488960.35930.360381
51-0.03262-0.23970.405732
52-0.000239-0.00180.499301
53-0.006379-0.04690.481392
54NANANA
55NANANA
56NANANA
57NANANA
58NANANA
59NANANA
60NANANA

\begin{tabular}{lllllllll}
\hline
Autocorrelation Function \tabularnewline
Time lag k & ACF(k) & T-STAT & P-value \tabularnewline
1 & 0.381128 & 2.8007 & 0.003531 \tabularnewline
2 & 0.252629 & 1.8564 & 0.034425 \tabularnewline
3 & -0.089829 & -0.6601 & 0.255996 \tabularnewline
4 & -0.097421 & -0.7159 & 0.238569 \tabularnewline
5 & -0.034317 & -0.2522 & 0.40093 \tabularnewline
6 & 0.062008 & 0.4557 & 0.32523 \tabularnewline
7 & 0.086425 & 0.6351 & 0.264026 \tabularnewline
8 & 0.143041 & 1.0511 & 0.148939 \tabularnewline
9 & 0.084146 & 0.6183 & 0.269475 \tabularnewline
10 & -0.192641 & -1.4156 & 0.081314 \tabularnewline
11 & -0.38194 & -2.8067 & 0.003474 \tabularnewline
12 & -0.463262 & -3.4043 & 0.000629 \tabularnewline
13 & -0.319712 & -2.3494 & 0.011246 \tabularnewline
14 & -0.003996 & -0.0294 & 0.488341 \tabularnewline
15 & 0.091677 & 0.6737 & 0.251692 \tabularnewline
16 & 0.125157 & 0.9197 & 0.180906 \tabularnewline
17 & 0.048941 & 0.3596 & 0.360259 \tabularnewline
18 & 0.008875 & 0.0652 & 0.474122 \tabularnewline
19 & -0.07694 & -0.5654 & 0.287075 \tabularnewline
20 & -0.071503 & -0.5254 & 0.300716 \tabularnewline
21 & 0.092612 & 0.6806 & 0.24953 \tabularnewline
22 & 0.04889 & 0.3593 & 0.360399 \tabularnewline
23 & 0.362064 & 2.6606 & 0.005124 \tabularnewline
24 & 0.168578 & 1.2388 & 0.11039 \tabularnewline
25 & 0.20627 & 1.5158 & 0.067705 \tabularnewline
26 & 0.025417 & 0.1868 & 0.426267 \tabularnewline
27 & -0.029477 & -0.2166 & 0.414664 \tabularnewline
28 & -0.139193 & -1.0229 & 0.155469 \tabularnewline
29 & -0.028676 & -0.2107 & 0.416947 \tabularnewline
30 & -0.106946 & -0.7859 & 0.217683 \tabularnewline
31 & -0.07401 & -0.5439 & 0.294389 \tabularnewline
32 & -0.067527 & -0.4962 & 0.310878 \tabularnewline
33 & -0.127719 & -0.9385 & 0.176073 \tabularnewline
34 & -0.088718 & -0.6519 & 0.258601 \tabularnewline
35 & -0.159359 & -1.171 & 0.12336 \tabularnewline
36 & -0.213455 & -1.5686 & 0.061295 \tabularnewline
37 & -0.142289 & -1.0456 & 0.150201 \tabularnewline
38 & -0.106128 & -0.7799 & 0.219434 \tabularnewline
39 & 0.030003 & 0.2205 & 0.413167 \tabularnewline
40 & -0.008975 & -0.066 & 0.473828 \tabularnewline
41 & 0.024621 & 0.1809 & 0.428551 \tabularnewline
42 & 0.018456 & 0.1356 & 0.446311 \tabularnewline
43 & 0.041679 & 0.3063 & 0.380286 \tabularnewline
44 & 0.062121 & 0.4565 & 0.324933 \tabularnewline
45 & -0.022653 & -0.1665 & 0.434208 \tabularnewline
46 & 0.036241 & 0.2663 & 0.395505 \tabularnewline
47 & 0.006471 & 0.0476 & 0.481123 \tabularnewline
48 & 0.070863 & 0.5207 & 0.302341 \tabularnewline
49 & 0.058715 & 0.4315 & 0.333923 \tabularnewline
50 & 0.048896 & 0.3593 & 0.360381 \tabularnewline
51 & -0.03262 & -0.2397 & 0.405732 \tabularnewline
52 & -0.000239 & -0.0018 & 0.499301 \tabularnewline
53 & -0.006379 & -0.0469 & 0.481392 \tabularnewline
54 & NA & NA & NA \tabularnewline
55 & NA & NA & NA \tabularnewline
56 & NA & NA & NA \tabularnewline
57 & NA & NA & NA \tabularnewline
58 & NA & NA & NA \tabularnewline
59 & NA & NA & NA \tabularnewline
60 & NA & NA & NA \tabularnewline
\hline
\end{tabular}
%Source: https://freestatistics.org/blog/index.php?pk=30790&T=1

[TABLE]
[ROW][C]Autocorrelation Function[/C][/ROW]
[ROW][C]Time lag k[/C][C]ACF(k)[/C][C]T-STAT[/C][C]P-value[/C][/ROW]
[ROW][C]1[/C][C]0.381128[/C][C]2.8007[/C][C]0.003531[/C][/ROW]
[ROW][C]2[/C][C]0.252629[/C][C]1.8564[/C][C]0.034425[/C][/ROW]
[ROW][C]3[/C][C]-0.089829[/C][C]-0.6601[/C][C]0.255996[/C][/ROW]
[ROW][C]4[/C][C]-0.097421[/C][C]-0.7159[/C][C]0.238569[/C][/ROW]
[ROW][C]5[/C][C]-0.034317[/C][C]-0.2522[/C][C]0.40093[/C][/ROW]
[ROW][C]6[/C][C]0.062008[/C][C]0.4557[/C][C]0.32523[/C][/ROW]
[ROW][C]7[/C][C]0.086425[/C][C]0.6351[/C][C]0.264026[/C][/ROW]
[ROW][C]8[/C][C]0.143041[/C][C]1.0511[/C][C]0.148939[/C][/ROW]
[ROW][C]9[/C][C]0.084146[/C][C]0.6183[/C][C]0.269475[/C][/ROW]
[ROW][C]10[/C][C]-0.192641[/C][C]-1.4156[/C][C]0.081314[/C][/ROW]
[ROW][C]11[/C][C]-0.38194[/C][C]-2.8067[/C][C]0.003474[/C][/ROW]
[ROW][C]12[/C][C]-0.463262[/C][C]-3.4043[/C][C]0.000629[/C][/ROW]
[ROW][C]13[/C][C]-0.319712[/C][C]-2.3494[/C][C]0.011246[/C][/ROW]
[ROW][C]14[/C][C]-0.003996[/C][C]-0.0294[/C][C]0.488341[/C][/ROW]
[ROW][C]15[/C][C]0.091677[/C][C]0.6737[/C][C]0.251692[/C][/ROW]
[ROW][C]16[/C][C]0.125157[/C][C]0.9197[/C][C]0.180906[/C][/ROW]
[ROW][C]17[/C][C]0.048941[/C][C]0.3596[/C][C]0.360259[/C][/ROW]
[ROW][C]18[/C][C]0.008875[/C][C]0.0652[/C][C]0.474122[/C][/ROW]
[ROW][C]19[/C][C]-0.07694[/C][C]-0.5654[/C][C]0.287075[/C][/ROW]
[ROW][C]20[/C][C]-0.071503[/C][C]-0.5254[/C][C]0.300716[/C][/ROW]
[ROW][C]21[/C][C]0.092612[/C][C]0.6806[/C][C]0.24953[/C][/ROW]
[ROW][C]22[/C][C]0.04889[/C][C]0.3593[/C][C]0.360399[/C][/ROW]
[ROW][C]23[/C][C]0.362064[/C][C]2.6606[/C][C]0.005124[/C][/ROW]
[ROW][C]24[/C][C]0.168578[/C][C]1.2388[/C][C]0.11039[/C][/ROW]
[ROW][C]25[/C][C]0.20627[/C][C]1.5158[/C][C]0.067705[/C][/ROW]
[ROW][C]26[/C][C]0.025417[/C][C]0.1868[/C][C]0.426267[/C][/ROW]
[ROW][C]27[/C][C]-0.029477[/C][C]-0.2166[/C][C]0.414664[/C][/ROW]
[ROW][C]28[/C][C]-0.139193[/C][C]-1.0229[/C][C]0.155469[/C][/ROW]
[ROW][C]29[/C][C]-0.028676[/C][C]-0.2107[/C][C]0.416947[/C][/ROW]
[ROW][C]30[/C][C]-0.106946[/C][C]-0.7859[/C][C]0.217683[/C][/ROW]
[ROW][C]31[/C][C]-0.07401[/C][C]-0.5439[/C][C]0.294389[/C][/ROW]
[ROW][C]32[/C][C]-0.067527[/C][C]-0.4962[/C][C]0.310878[/C][/ROW]
[ROW][C]33[/C][C]-0.127719[/C][C]-0.9385[/C][C]0.176073[/C][/ROW]
[ROW][C]34[/C][C]-0.088718[/C][C]-0.6519[/C][C]0.258601[/C][/ROW]
[ROW][C]35[/C][C]-0.159359[/C][C]-1.171[/C][C]0.12336[/C][/ROW]
[ROW][C]36[/C][C]-0.213455[/C][C]-1.5686[/C][C]0.061295[/C][/ROW]
[ROW][C]37[/C][C]-0.142289[/C][C]-1.0456[/C][C]0.150201[/C][/ROW]
[ROW][C]38[/C][C]-0.106128[/C][C]-0.7799[/C][C]0.219434[/C][/ROW]
[ROW][C]39[/C][C]0.030003[/C][C]0.2205[/C][C]0.413167[/C][/ROW]
[ROW][C]40[/C][C]-0.008975[/C][C]-0.066[/C][C]0.473828[/C][/ROW]
[ROW][C]41[/C][C]0.024621[/C][C]0.1809[/C][C]0.428551[/C][/ROW]
[ROW][C]42[/C][C]0.018456[/C][C]0.1356[/C][C]0.446311[/C][/ROW]
[ROW][C]43[/C][C]0.041679[/C][C]0.3063[/C][C]0.380286[/C][/ROW]
[ROW][C]44[/C][C]0.062121[/C][C]0.4565[/C][C]0.324933[/C][/ROW]
[ROW][C]45[/C][C]-0.022653[/C][C]-0.1665[/C][C]0.434208[/C][/ROW]
[ROW][C]46[/C][C]0.036241[/C][C]0.2663[/C][C]0.395505[/C][/ROW]
[ROW][C]47[/C][C]0.006471[/C][C]0.0476[/C][C]0.481123[/C][/ROW]
[ROW][C]48[/C][C]0.070863[/C][C]0.5207[/C][C]0.302341[/C][/ROW]
[ROW][C]49[/C][C]0.058715[/C][C]0.4315[/C][C]0.333923[/C][/ROW]
[ROW][C]50[/C][C]0.048896[/C][C]0.3593[/C][C]0.360381[/C][/ROW]
[ROW][C]51[/C][C]-0.03262[/C][C]-0.2397[/C][C]0.405732[/C][/ROW]
[ROW][C]52[/C][C]-0.000239[/C][C]-0.0018[/C][C]0.499301[/C][/ROW]
[ROW][C]53[/C][C]-0.006379[/C][C]-0.0469[/C][C]0.481392[/C][/ROW]
[ROW][C]54[/C][C]NA[/C][C]NA[/C][C]NA[/C][/ROW]
[ROW][C]55[/C][C]NA[/C][C]NA[/C][C]NA[/C][/ROW]
[ROW][C]56[/C][C]NA[/C][C]NA[/C][C]NA[/C][/ROW]
[ROW][C]57[/C][C]NA[/C][C]NA[/C][C]NA[/C][/ROW]
[ROW][C]58[/C][C]NA[/C][C]NA[/C][C]NA[/C][/ROW]
[ROW][C]59[/C][C]NA[/C][C]NA[/C][C]NA[/C][/ROW]
[ROW][C]60[/C][C]NA[/C][C]NA[/C][C]NA[/C][/ROW]
[/TABLE]
Source: https://freestatistics.org/blog/index.php?pk=30790&T=1

Globally Unique Identifier (entire table): ba.freestatistics.org/blog/index.php?pk=30790&T=1

As an alternative you can also use a QR Code:  

The GUIDs for individual cells are displayed in the table below:

Autocorrelation Function
Time lag kACF(k)T-STATP-value
10.3811282.80070.003531
20.2526291.85640.034425
3-0.089829-0.66010.255996
4-0.097421-0.71590.238569
5-0.034317-0.25220.40093
60.0620080.45570.32523
70.0864250.63510.264026
80.1430411.05110.148939
90.0841460.61830.269475
10-0.192641-1.41560.081314
11-0.38194-2.80670.003474
12-0.463262-3.40430.000629
13-0.319712-2.34940.011246
14-0.003996-0.02940.488341
150.0916770.67370.251692
160.1251570.91970.180906
170.0489410.35960.360259
180.0088750.06520.474122
19-0.07694-0.56540.287075
20-0.071503-0.52540.300716
210.0926120.68060.24953
220.048890.35930.360399
230.3620642.66060.005124
240.1685781.23880.11039
250.206271.51580.067705
260.0254170.18680.426267
27-0.029477-0.21660.414664
28-0.139193-1.02290.155469
29-0.028676-0.21070.416947
30-0.106946-0.78590.217683
31-0.07401-0.54390.294389
32-0.067527-0.49620.310878
33-0.127719-0.93850.176073
34-0.088718-0.65190.258601
35-0.159359-1.1710.12336
36-0.213455-1.56860.061295
37-0.142289-1.04560.150201
38-0.106128-0.77990.219434
390.0300030.22050.413167
40-0.008975-0.0660.473828
410.0246210.18090.428551
420.0184560.13560.446311
430.0416790.30630.380286
440.0621210.45650.324933
45-0.022653-0.16650.434208
460.0362410.26630.395505
470.0064710.04760.481123
480.0708630.52070.302341
490.0587150.43150.333923
500.0488960.35930.360381
51-0.03262-0.23970.405732
52-0.000239-0.00180.499301
53-0.006379-0.04690.481392
54NANANA
55NANANA
56NANANA
57NANANA
58NANANA
59NANANA
60NANANA


Partial Autocorrelation Function
Time lag kPACF(k)T-STATP-value
10.3811282.80070.003531
20.1256180.92310.180031
3-0.263766-1.93830.028912
4-0.022897-0.16830.433506
50.1197080.87970.191468
60.05770.4240.336622
7-0.009099-0.06690.47347
80.0994650.73090.233995
90.019890.14620.442169
10-0.337024-2.47660.008214
11-0.301621-2.21650.015447
12-0.147106-1.0810.142249
13-0.05741-0.42190.337394
140.1580191.16120.125335
150.040590.29830.383318
160.0071960.05290.479011
170.0475090.34910.364179
180.109990.80830.211244
190.0140830.10350.458979
20-0.022274-0.16370.435298
210.1986551.45980.075068
22-0.271715-1.99670.025455
230.0896360.65870.256449
24-0.08501-0.62470.267402
250.0611410.44930.327508
260.0945660.69490.245044
270.0207130.15220.439794
28-0.119888-0.8810.191113
290.0344720.25330.400493
30-0.123575-0.90810.183934
31-0.146793-1.07870.142758
32-0.037984-0.27910.390607
330.021890.16090.436404
340.0358810.26370.396518
35-0.082496-0.60620.273454
36-0.032612-0.23960.405755
370.0194470.14290.443448
380.0139490.10250.45937
390.0658110.48360.31531
40-0.133786-0.98310.164966
41-0.130679-0.96030.170594
42-0.007185-0.05280.479045
43-0.076833-0.56460.287339
44-0.082812-0.60850.272689
450.0732630.53840.296267
46-0.020041-0.14730.441734
47-0.067803-0.49820.310167
48-0.090927-0.66820.253435
490.0791860.58190.28153
50-0.028245-0.20760.418177
510.0361670.26580.395714
52-0.058406-0.42920.334744
530.0611860.44960.327392
54NANANA
55NANANA
56NANANA
57NANANA
58NANANA
59NANANA
60NANANA

\begin{tabular}{lllllllll}
\hline
Partial Autocorrelation Function \tabularnewline
Time lag k & PACF(k) & T-STAT & P-value \tabularnewline
1 & 0.381128 & 2.8007 & 0.003531 \tabularnewline
2 & 0.125618 & 0.9231 & 0.180031 \tabularnewline
3 & -0.263766 & -1.9383 & 0.028912 \tabularnewline
4 & -0.022897 & -0.1683 & 0.433506 \tabularnewline
5 & 0.119708 & 0.8797 & 0.191468 \tabularnewline
6 & 0.0577 & 0.424 & 0.336622 \tabularnewline
7 & -0.009099 & -0.0669 & 0.47347 \tabularnewline
8 & 0.099465 & 0.7309 & 0.233995 \tabularnewline
9 & 0.01989 & 0.1462 & 0.442169 \tabularnewline
10 & -0.337024 & -2.4766 & 0.008214 \tabularnewline
11 & -0.301621 & -2.2165 & 0.015447 \tabularnewline
12 & -0.147106 & -1.081 & 0.142249 \tabularnewline
13 & -0.05741 & -0.4219 & 0.337394 \tabularnewline
14 & 0.158019 & 1.1612 & 0.125335 \tabularnewline
15 & 0.04059 & 0.2983 & 0.383318 \tabularnewline
16 & 0.007196 & 0.0529 & 0.479011 \tabularnewline
17 & 0.047509 & 0.3491 & 0.364179 \tabularnewline
18 & 0.10999 & 0.8083 & 0.211244 \tabularnewline
19 & 0.014083 & 0.1035 & 0.458979 \tabularnewline
20 & -0.022274 & -0.1637 & 0.435298 \tabularnewline
21 & 0.198655 & 1.4598 & 0.075068 \tabularnewline
22 & -0.271715 & -1.9967 & 0.025455 \tabularnewline
23 & 0.089636 & 0.6587 & 0.256449 \tabularnewline
24 & -0.08501 & -0.6247 & 0.267402 \tabularnewline
25 & 0.061141 & 0.4493 & 0.327508 \tabularnewline
26 & 0.094566 & 0.6949 & 0.245044 \tabularnewline
27 & 0.020713 & 0.1522 & 0.439794 \tabularnewline
28 & -0.119888 & -0.881 & 0.191113 \tabularnewline
29 & 0.034472 & 0.2533 & 0.400493 \tabularnewline
30 & -0.123575 & -0.9081 & 0.183934 \tabularnewline
31 & -0.146793 & -1.0787 & 0.142758 \tabularnewline
32 & -0.037984 & -0.2791 & 0.390607 \tabularnewline
33 & 0.02189 & 0.1609 & 0.436404 \tabularnewline
34 & 0.035881 & 0.2637 & 0.396518 \tabularnewline
35 & -0.082496 & -0.6062 & 0.273454 \tabularnewline
36 & -0.032612 & -0.2396 & 0.405755 \tabularnewline
37 & 0.019447 & 0.1429 & 0.443448 \tabularnewline
38 & 0.013949 & 0.1025 & 0.45937 \tabularnewline
39 & 0.065811 & 0.4836 & 0.31531 \tabularnewline
40 & -0.133786 & -0.9831 & 0.164966 \tabularnewline
41 & -0.130679 & -0.9603 & 0.170594 \tabularnewline
42 & -0.007185 & -0.0528 & 0.479045 \tabularnewline
43 & -0.076833 & -0.5646 & 0.287339 \tabularnewline
44 & -0.082812 & -0.6085 & 0.272689 \tabularnewline
45 & 0.073263 & 0.5384 & 0.296267 \tabularnewline
46 & -0.020041 & -0.1473 & 0.441734 \tabularnewline
47 & -0.067803 & -0.4982 & 0.310167 \tabularnewline
48 & -0.090927 & -0.6682 & 0.253435 \tabularnewline
49 & 0.079186 & 0.5819 & 0.28153 \tabularnewline
50 & -0.028245 & -0.2076 & 0.418177 \tabularnewline
51 & 0.036167 & 0.2658 & 0.395714 \tabularnewline
52 & -0.058406 & -0.4292 & 0.334744 \tabularnewline
53 & 0.061186 & 0.4496 & 0.327392 \tabularnewline
54 & NA & NA & NA \tabularnewline
55 & NA & NA & NA \tabularnewline
56 & NA & NA & NA \tabularnewline
57 & NA & NA & NA \tabularnewline
58 & NA & NA & NA \tabularnewline
59 & NA & NA & NA \tabularnewline
60 & NA & NA & NA \tabularnewline
\hline
\end{tabular}
%Source: https://freestatistics.org/blog/index.php?pk=30790&T=2

[TABLE]
[ROW][C]Partial Autocorrelation Function[/C][/ROW]
[ROW][C]Time lag k[/C][C]PACF(k)[/C][C]T-STAT[/C][C]P-value[/C][/ROW]
[ROW][C]1[/C][C]0.381128[/C][C]2.8007[/C][C]0.003531[/C][/ROW]
[ROW][C]2[/C][C]0.125618[/C][C]0.9231[/C][C]0.180031[/C][/ROW]
[ROW][C]3[/C][C]-0.263766[/C][C]-1.9383[/C][C]0.028912[/C][/ROW]
[ROW][C]4[/C][C]-0.022897[/C][C]-0.1683[/C][C]0.433506[/C][/ROW]
[ROW][C]5[/C][C]0.119708[/C][C]0.8797[/C][C]0.191468[/C][/ROW]
[ROW][C]6[/C][C]0.0577[/C][C]0.424[/C][C]0.336622[/C][/ROW]
[ROW][C]7[/C][C]-0.009099[/C][C]-0.0669[/C][C]0.47347[/C][/ROW]
[ROW][C]8[/C][C]0.099465[/C][C]0.7309[/C][C]0.233995[/C][/ROW]
[ROW][C]9[/C][C]0.01989[/C][C]0.1462[/C][C]0.442169[/C][/ROW]
[ROW][C]10[/C][C]-0.337024[/C][C]-2.4766[/C][C]0.008214[/C][/ROW]
[ROW][C]11[/C][C]-0.301621[/C][C]-2.2165[/C][C]0.015447[/C][/ROW]
[ROW][C]12[/C][C]-0.147106[/C][C]-1.081[/C][C]0.142249[/C][/ROW]
[ROW][C]13[/C][C]-0.05741[/C][C]-0.4219[/C][C]0.337394[/C][/ROW]
[ROW][C]14[/C][C]0.158019[/C][C]1.1612[/C][C]0.125335[/C][/ROW]
[ROW][C]15[/C][C]0.04059[/C][C]0.2983[/C][C]0.383318[/C][/ROW]
[ROW][C]16[/C][C]0.007196[/C][C]0.0529[/C][C]0.479011[/C][/ROW]
[ROW][C]17[/C][C]0.047509[/C][C]0.3491[/C][C]0.364179[/C][/ROW]
[ROW][C]18[/C][C]0.10999[/C][C]0.8083[/C][C]0.211244[/C][/ROW]
[ROW][C]19[/C][C]0.014083[/C][C]0.1035[/C][C]0.458979[/C][/ROW]
[ROW][C]20[/C][C]-0.022274[/C][C]-0.1637[/C][C]0.435298[/C][/ROW]
[ROW][C]21[/C][C]0.198655[/C][C]1.4598[/C][C]0.075068[/C][/ROW]
[ROW][C]22[/C][C]-0.271715[/C][C]-1.9967[/C][C]0.025455[/C][/ROW]
[ROW][C]23[/C][C]0.089636[/C][C]0.6587[/C][C]0.256449[/C][/ROW]
[ROW][C]24[/C][C]-0.08501[/C][C]-0.6247[/C][C]0.267402[/C][/ROW]
[ROW][C]25[/C][C]0.061141[/C][C]0.4493[/C][C]0.327508[/C][/ROW]
[ROW][C]26[/C][C]0.094566[/C][C]0.6949[/C][C]0.245044[/C][/ROW]
[ROW][C]27[/C][C]0.020713[/C][C]0.1522[/C][C]0.439794[/C][/ROW]
[ROW][C]28[/C][C]-0.119888[/C][C]-0.881[/C][C]0.191113[/C][/ROW]
[ROW][C]29[/C][C]0.034472[/C][C]0.2533[/C][C]0.400493[/C][/ROW]
[ROW][C]30[/C][C]-0.123575[/C][C]-0.9081[/C][C]0.183934[/C][/ROW]
[ROW][C]31[/C][C]-0.146793[/C][C]-1.0787[/C][C]0.142758[/C][/ROW]
[ROW][C]32[/C][C]-0.037984[/C][C]-0.2791[/C][C]0.390607[/C][/ROW]
[ROW][C]33[/C][C]0.02189[/C][C]0.1609[/C][C]0.436404[/C][/ROW]
[ROW][C]34[/C][C]0.035881[/C][C]0.2637[/C][C]0.396518[/C][/ROW]
[ROW][C]35[/C][C]-0.082496[/C][C]-0.6062[/C][C]0.273454[/C][/ROW]
[ROW][C]36[/C][C]-0.032612[/C][C]-0.2396[/C][C]0.405755[/C][/ROW]
[ROW][C]37[/C][C]0.019447[/C][C]0.1429[/C][C]0.443448[/C][/ROW]
[ROW][C]38[/C][C]0.013949[/C][C]0.1025[/C][C]0.45937[/C][/ROW]
[ROW][C]39[/C][C]0.065811[/C][C]0.4836[/C][C]0.31531[/C][/ROW]
[ROW][C]40[/C][C]-0.133786[/C][C]-0.9831[/C][C]0.164966[/C][/ROW]
[ROW][C]41[/C][C]-0.130679[/C][C]-0.9603[/C][C]0.170594[/C][/ROW]
[ROW][C]42[/C][C]-0.007185[/C][C]-0.0528[/C][C]0.479045[/C][/ROW]
[ROW][C]43[/C][C]-0.076833[/C][C]-0.5646[/C][C]0.287339[/C][/ROW]
[ROW][C]44[/C][C]-0.082812[/C][C]-0.6085[/C][C]0.272689[/C][/ROW]
[ROW][C]45[/C][C]0.073263[/C][C]0.5384[/C][C]0.296267[/C][/ROW]
[ROW][C]46[/C][C]-0.020041[/C][C]-0.1473[/C][C]0.441734[/C][/ROW]
[ROW][C]47[/C][C]-0.067803[/C][C]-0.4982[/C][C]0.310167[/C][/ROW]
[ROW][C]48[/C][C]-0.090927[/C][C]-0.6682[/C][C]0.253435[/C][/ROW]
[ROW][C]49[/C][C]0.079186[/C][C]0.5819[/C][C]0.28153[/C][/ROW]
[ROW][C]50[/C][C]-0.028245[/C][C]-0.2076[/C][C]0.418177[/C][/ROW]
[ROW][C]51[/C][C]0.036167[/C][C]0.2658[/C][C]0.395714[/C][/ROW]
[ROW][C]52[/C][C]-0.058406[/C][C]-0.4292[/C][C]0.334744[/C][/ROW]
[ROW][C]53[/C][C]0.061186[/C][C]0.4496[/C][C]0.327392[/C][/ROW]
[ROW][C]54[/C][C]NA[/C][C]NA[/C][C]NA[/C][/ROW]
[ROW][C]55[/C][C]NA[/C][C]NA[/C][C]NA[/C][/ROW]
[ROW][C]56[/C][C]NA[/C][C]NA[/C][C]NA[/C][/ROW]
[ROW][C]57[/C][C]NA[/C][C]NA[/C][C]NA[/C][/ROW]
[ROW][C]58[/C][C]NA[/C][C]NA[/C][C]NA[/C][/ROW]
[ROW][C]59[/C][C]NA[/C][C]NA[/C][C]NA[/C][/ROW]
[ROW][C]60[/C][C]NA[/C][C]NA[/C][C]NA[/C][/ROW]
[/TABLE]
Source: https://freestatistics.org/blog/index.php?pk=30790&T=2

Globally Unique Identifier (entire table): ba.freestatistics.org/blog/index.php?pk=30790&T=2

As an alternative you can also use a QR Code:  

The GUIDs for individual cells are displayed in the table below:

Partial Autocorrelation Function
Time lag kPACF(k)T-STATP-value
10.3811282.80070.003531
20.1256180.92310.180031
3-0.263766-1.93830.028912
4-0.022897-0.16830.433506
50.1197080.87970.191468
60.05770.4240.336622
7-0.009099-0.06690.47347
80.0994650.73090.233995
90.019890.14620.442169
10-0.337024-2.47660.008214
11-0.301621-2.21650.015447
12-0.147106-1.0810.142249
13-0.05741-0.42190.337394
140.1580191.16120.125335
150.040590.29830.383318
160.0071960.05290.479011
170.0475090.34910.364179
180.109990.80830.211244
190.0140830.10350.458979
20-0.022274-0.16370.435298
210.1986551.45980.075068
22-0.271715-1.99670.025455
230.0896360.65870.256449
24-0.08501-0.62470.267402
250.0611410.44930.327508
260.0945660.69490.245044
270.0207130.15220.439794
28-0.119888-0.8810.191113
290.0344720.25330.400493
30-0.123575-0.90810.183934
31-0.146793-1.07870.142758
32-0.037984-0.27910.390607
330.021890.16090.436404
340.0358810.26370.396518
35-0.082496-0.60620.273454
36-0.032612-0.23960.405755
370.0194470.14290.443448
380.0139490.10250.45937
390.0658110.48360.31531
40-0.133786-0.98310.164966
41-0.130679-0.96030.170594
42-0.007185-0.05280.479045
43-0.076833-0.56460.287339
44-0.082812-0.60850.272689
450.0732630.53840.296267
46-0.020041-0.14730.441734
47-0.067803-0.49820.310167
48-0.090927-0.66820.253435
490.0791860.58190.28153
50-0.028245-0.20760.418177
510.0361670.26580.395714
52-0.058406-0.42920.334744
530.0611860.44960.327392
54NANANA
55NANANA
56NANANA
57NANANA
58NANANA
59NANANA
60NANANA


Parameters (Session):
par1 = 60 ; par2 = 1 ; par3 = 0 ; par4 = 1 ; par5 = 12 ;
Parameters (R input):
par1 = 60 ; par2 = 1 ; par3 = 0 ; par4 = 1 ; par5 = 12 ;
R code (references can be found in the software module):
if (par1 == 'Default') {
par1 = 10*log10(length(x))
} else {
par1 <- as.numeric(par1)
}
par2 <- as.numeric(par2)
par3 <- as.numeric(par3)
par4 <- as.numeric(par4)
par5 <- as.numeric(par5)
if (par2 == 0) {
x <- log(x)
} else {
x <- (x ^ par2 - 1) / par2
}
if (par3 > 0) x <- diff(x,lag=1,difference=par3)
if (par4 > 0) x <- diff(x,lag=par5,difference=par4)
bitmap(file='pic1.png')
racf <- acf(x,par1,main='Autocorrelation',xlab='lags',ylab='ACF')
dev.off()
bitmap(file='pic2.png')
rpacf <- pacf(x,par1,main='Partial Autocorrelation',xlab='lags',ylab='PACF')
dev.off()
(myacf <- c(racf$acf))
(mypacf <- c(rpacf$acf))
lengthx <- length(x)
sqrtn <- sqrt(lengthx)
load(file='createtable')
a<-table.start()
a<-table.row.start(a)
a<-table.element(a,'Autocorrelation Function',4,TRUE)
a<-table.row.end(a)
a<-table.row.start(a)
a<-table.element(a,'Time lag k',header=TRUE)
a<-table.element(a,hyperlink('basics.htm','ACF(k)','click here for more information about the Autocorrelation Function'),header=TRUE)
a<-table.element(a,'T-STAT',header=TRUE)
a<-table.element(a,'P-value',header=TRUE)
a<-table.row.end(a)
for (i in 2:(par1+1)) {
a<-table.row.start(a)
a<-table.element(a,i-1,header=TRUE)
a<-table.element(a,round(myacf[i],6))
mytstat <- myacf[i]*sqrtn
a<-table.element(a,round(mytstat,4))
a<-table.element(a,round(1-pt(abs(mytstat),lengthx),6))
a<-table.row.end(a)
}
a<-table.end(a)
table.save(a,file='mytable.tab')
a<-table.start()
a<-table.row.start(a)
a<-table.element(a,'Partial Autocorrelation Function',4,TRUE)
a<-table.row.end(a)
a<-table.row.start(a)
a<-table.element(a,'Time lag k',header=TRUE)
a<-table.element(a,hyperlink('basics.htm','PACF(k)','click here for more information about the Partial Autocorrelation Function'),header=TRUE)
a<-table.element(a,'T-STAT',header=TRUE)
a<-table.element(a,'P-value',header=TRUE)
a<-table.row.end(a)
for (i in 1:par1) {
a<-table.row.start(a)
a<-table.element(a,i,header=TRUE)
a<-table.element(a,round(mypacf[i],6))
mytstat <- mypacf[i]*sqrtn
a<-table.element(a,round(mytstat,4))
a<-table.element(a,round(1-pt(abs(mytstat),lengthx),6))
a<-table.row.end(a)
}
a<-table.end(a)
table.save(a,file='mytable1.tab')