Free Statistics

of Irreproducible Research!

Author's title

Author*The author of this computation has been verified*
R Software Modulerwasp_autocorrelation.wasp
Title produced by software(Partial) Autocorrelation Function
Date of computationMon, 08 Dec 2008 12:23:15 -0700
Cite this page as followsStatistical Computations at FreeStatistics.org, Office for Research Development and Education, URL https://freestatistics.org/blog/index.php?v=date/2008/Dec/08/t12287642295iomo7ot17r1qb6.htm/, Retrieved Thu, 16 May 2024 19:28:28 +0000
Statistical Computations at FreeStatistics.org, Office for Research Development and Education, URL https://freestatistics.org/blog/index.php?pk=30789, Retrieved Thu, 16 May 2024 19:28:28 +0000
QR Codes:

Original text written by user:
IsPrivate?No (this computation is public)
User-defined keywords
Estimated Impact165
Family? (F = Feedback message, R = changed R code, M = changed R Module, P = changed Parameters, D = changed Data)
-     [Univariate Data Series] [data set] [2008-12-01 19:54:57] [b98453cac15ba1066b407e146608df68]
F RMP   [(Partial) Autocorrelation Function] [step 2] [2008-12-08 12:08:27] [6bf01ed8d6668535fdab898b5820a5bc]
F   P     [(Partial) Autocorrelation Function] [step 3] [2008-12-08 12:29:14] [6bf01ed8d6668535fdab898b5820a5bc]
F   PD        [(Partial) Autocorrelation Function] [step 3] [2008-12-08 19:23:15] [db9a5fd0f9c3e1245d8075d8bb09236d] [Current]
Feedback Forum
2008-12-14 14:13:17 [Jeroen Michel] [reply
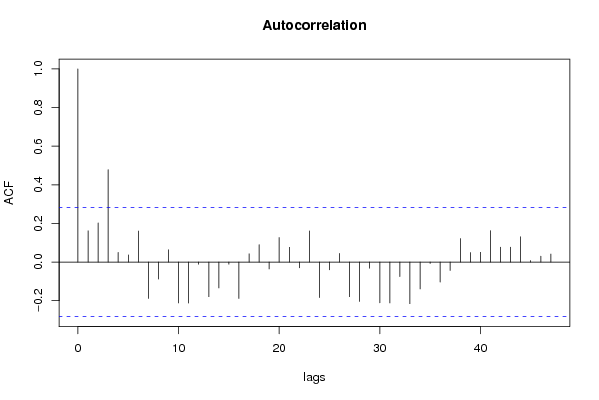
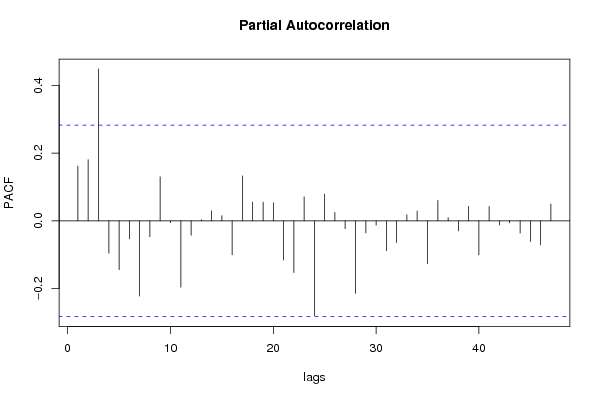
Hier is er inderdaad sprake van een seizoensinvloed op de lags 12 en 24. Deze beïnvloeden duidelijk de geselecteerde reeks. De student haalt duidelijk aan dat door een nieuwe berekening de invloeden kunnen worden weggewerkt.

Post a new message
Dataseries X:
9097,4
12639,8
13040,1
11687,3
11191,7
11391,9
11793,1
13933,2
12778,1
11810,3
13698,4
11956,6
10723,8
13938,9
13979,8
13807,4
12973,9
12509,8
12934,1
14908,3
13772,1
13012,6
14049,9
11816,5
11593,2
14466,2
13615,9
14733,9
13880,7
13527,5
13584
16170,2
13260,6
14741,9
15486,5
13154,5
12621,2
15031,6
15452,4
15428
13105,9
14716,8
14180
16202,2
14392,4
15140,6
15960,1
14351,3
13230,2
15202,1
17157,3
16159,1
13405,7
17224,7
17338,4
17370,6
18817,8
16593,2
17979,5
17015,2


Summary of computational transaction
Raw Inputview raw input (R code)
Raw Outputview raw output of R engine
Computing time1 seconds
R Server'George Udny Yule' @ 72.249.76.132

\begin{tabular}{lllllllll}
\hline
Summary of computational transaction \tabularnewline
Raw Input & view raw input (R code)  \tabularnewline
Raw Output & view raw output of R engine  \tabularnewline
Computing time & 1 seconds \tabularnewline
R Server & 'George Udny Yule' @ 72.249.76.132 \tabularnewline
\hline
\end{tabular}
%Source: https://freestatistics.org/blog/index.php?pk=30789&T=0

[TABLE]
[ROW][C]Summary of computational transaction[/C][/ROW]
[ROW][C]Raw Input[/C][C]view raw input (R code) [/C][/ROW]
[ROW][C]Raw Output[/C][C]view raw output of R engine [/C][/ROW]
[ROW][C]Computing time[/C][C]1 seconds[/C][/ROW]
[ROW][C]R Server[/C][C]'George Udny Yule' @ 72.249.76.132[/C][/ROW]
[/TABLE]
Source: https://freestatistics.org/blog/index.php?pk=30789&T=0

Globally Unique Identifier (entire table): ba.freestatistics.org/blog/index.php?pk=30789&T=0

As an alternative you can also use a QR Code:  

The GUIDs for individual cells are displayed in the table below:

Summary of computational transaction
Raw Inputview raw input (R code)
Raw Outputview raw output of R engine
Computing time1 seconds
R Server'George Udny Yule' @ 72.249.76.132


Autocorrelation Function
Time lag kACF(k)T-STATP-value
10.1618741.12150.133828
20.2021861.40080.083855
30.4785573.31550.000874
40.0500420.34670.365166
50.036950.2560.399523
60.1605431.11230.135779
7-0.188891-1.30870.098438
8-0.087974-0.60950.272532
90.0635940.44060.330744
10-0.211673-1.46650.074515
11-0.212523-1.47240.07372
12-0.011238-0.07790.469132
13-0.17925-1.24190.110158
14-0.134289-0.93040.178415
15-0.011499-0.07970.468417
16-0.188865-1.30850.098468
170.0424590.29420.38495
180.0896530.62110.268725
19-0.035464-0.24570.403479
200.1267420.87810.192134
210.0760370.52680.300381
22-0.029962-0.20760.418217
230.1610161.11560.135084
24-0.18385-1.27370.104443
25-0.040354-0.27960.390501
260.0443690.30740.379936
27-0.179721-1.24510.109562
28-0.204122-1.41420.081879
29-0.032027-0.22190.412672
30-0.211427-1.46480.074746
31-0.2119-1.46810.074301
32-0.075316-0.52180.302103
33-0.215673-1.49420.070831
34-0.139286-0.9650.169691
35-0.007398-0.05130.479667
36-0.103842-0.71940.237679
37-0.043623-0.30220.381891
380.1213020.84040.202424
390.0491540.34050.367466
400.0505060.34990.363966
410.1620821.12290.133525
420.0769560.53320.298189
430.0766330.53090.298957
440.1307040.90550.184851
450.0076340.05290.47902
460.030180.20910.417629
470.0409950.2840.388807
48NANANA
49NANANA
50NANANA
51NANANA
52NANANA
53NANANA
54NANANA
55NANANA
56NANANA
57NANANA
58NANANA
59NANANA
60NANANA

\begin{tabular}{lllllllll}
\hline
Autocorrelation Function \tabularnewline
Time lag k & ACF(k) & T-STAT & P-value \tabularnewline
1 & 0.161874 & 1.1215 & 0.133828 \tabularnewline
2 & 0.202186 & 1.4008 & 0.083855 \tabularnewline
3 & 0.478557 & 3.3155 & 0.000874 \tabularnewline
4 & 0.050042 & 0.3467 & 0.365166 \tabularnewline
5 & 0.03695 & 0.256 & 0.399523 \tabularnewline
6 & 0.160543 & 1.1123 & 0.135779 \tabularnewline
7 & -0.188891 & -1.3087 & 0.098438 \tabularnewline
8 & -0.087974 & -0.6095 & 0.272532 \tabularnewline
9 & 0.063594 & 0.4406 & 0.330744 \tabularnewline
10 & -0.211673 & -1.4665 & 0.074515 \tabularnewline
11 & -0.212523 & -1.4724 & 0.07372 \tabularnewline
12 & -0.011238 & -0.0779 & 0.469132 \tabularnewline
13 & -0.17925 & -1.2419 & 0.110158 \tabularnewline
14 & -0.134289 & -0.9304 & 0.178415 \tabularnewline
15 & -0.011499 & -0.0797 & 0.468417 \tabularnewline
16 & -0.188865 & -1.3085 & 0.098468 \tabularnewline
17 & 0.042459 & 0.2942 & 0.38495 \tabularnewline
18 & 0.089653 & 0.6211 & 0.268725 \tabularnewline
19 & -0.035464 & -0.2457 & 0.403479 \tabularnewline
20 & 0.126742 & 0.8781 & 0.192134 \tabularnewline
21 & 0.076037 & 0.5268 & 0.300381 \tabularnewline
22 & -0.029962 & -0.2076 & 0.418217 \tabularnewline
23 & 0.161016 & 1.1156 & 0.135084 \tabularnewline
24 & -0.18385 & -1.2737 & 0.104443 \tabularnewline
25 & -0.040354 & -0.2796 & 0.390501 \tabularnewline
26 & 0.044369 & 0.3074 & 0.379936 \tabularnewline
27 & -0.179721 & -1.2451 & 0.109562 \tabularnewline
28 & -0.204122 & -1.4142 & 0.081879 \tabularnewline
29 & -0.032027 & -0.2219 & 0.412672 \tabularnewline
30 & -0.211427 & -1.4648 & 0.074746 \tabularnewline
31 & -0.2119 & -1.4681 & 0.074301 \tabularnewline
32 & -0.075316 & -0.5218 & 0.302103 \tabularnewline
33 & -0.215673 & -1.4942 & 0.070831 \tabularnewline
34 & -0.139286 & -0.965 & 0.169691 \tabularnewline
35 & -0.007398 & -0.0513 & 0.479667 \tabularnewline
36 & -0.103842 & -0.7194 & 0.237679 \tabularnewline
37 & -0.043623 & -0.3022 & 0.381891 \tabularnewline
38 & 0.121302 & 0.8404 & 0.202424 \tabularnewline
39 & 0.049154 & 0.3405 & 0.367466 \tabularnewline
40 & 0.050506 & 0.3499 & 0.363966 \tabularnewline
41 & 0.162082 & 1.1229 & 0.133525 \tabularnewline
42 & 0.076956 & 0.5332 & 0.298189 \tabularnewline
43 & 0.076633 & 0.5309 & 0.298957 \tabularnewline
44 & 0.130704 & 0.9055 & 0.184851 \tabularnewline
45 & 0.007634 & 0.0529 & 0.47902 \tabularnewline
46 & 0.03018 & 0.2091 & 0.417629 \tabularnewline
47 & 0.040995 & 0.284 & 0.388807 \tabularnewline
48 & NA & NA & NA \tabularnewline
49 & NA & NA & NA \tabularnewline
50 & NA & NA & NA \tabularnewline
51 & NA & NA & NA \tabularnewline
52 & NA & NA & NA \tabularnewline
53 & NA & NA & NA \tabularnewline
54 & NA & NA & NA \tabularnewline
55 & NA & NA & NA \tabularnewline
56 & NA & NA & NA \tabularnewline
57 & NA & NA & NA \tabularnewline
58 & NA & NA & NA \tabularnewline
59 & NA & NA & NA \tabularnewline
60 & NA & NA & NA \tabularnewline
\hline
\end{tabular}
%Source: https://freestatistics.org/blog/index.php?pk=30789&T=1

[TABLE]
[ROW][C]Autocorrelation Function[/C][/ROW]
[ROW][C]Time lag k[/C][C]ACF(k)[/C][C]T-STAT[/C][C]P-value[/C][/ROW]
[ROW][C]1[/C][C]0.161874[/C][C]1.1215[/C][C]0.133828[/C][/ROW]
[ROW][C]2[/C][C]0.202186[/C][C]1.4008[/C][C]0.083855[/C][/ROW]
[ROW][C]3[/C][C]0.478557[/C][C]3.3155[/C][C]0.000874[/C][/ROW]
[ROW][C]4[/C][C]0.050042[/C][C]0.3467[/C][C]0.365166[/C][/ROW]
[ROW][C]5[/C][C]0.03695[/C][C]0.256[/C][C]0.399523[/C][/ROW]
[ROW][C]6[/C][C]0.160543[/C][C]1.1123[/C][C]0.135779[/C][/ROW]
[ROW][C]7[/C][C]-0.188891[/C][C]-1.3087[/C][C]0.098438[/C][/ROW]
[ROW][C]8[/C][C]-0.087974[/C][C]-0.6095[/C][C]0.272532[/C][/ROW]
[ROW][C]9[/C][C]0.063594[/C][C]0.4406[/C][C]0.330744[/C][/ROW]
[ROW][C]10[/C][C]-0.211673[/C][C]-1.4665[/C][C]0.074515[/C][/ROW]
[ROW][C]11[/C][C]-0.212523[/C][C]-1.4724[/C][C]0.07372[/C][/ROW]
[ROW][C]12[/C][C]-0.011238[/C][C]-0.0779[/C][C]0.469132[/C][/ROW]
[ROW][C]13[/C][C]-0.17925[/C][C]-1.2419[/C][C]0.110158[/C][/ROW]
[ROW][C]14[/C][C]-0.134289[/C][C]-0.9304[/C][C]0.178415[/C][/ROW]
[ROW][C]15[/C][C]-0.011499[/C][C]-0.0797[/C][C]0.468417[/C][/ROW]
[ROW][C]16[/C][C]-0.188865[/C][C]-1.3085[/C][C]0.098468[/C][/ROW]
[ROW][C]17[/C][C]0.042459[/C][C]0.2942[/C][C]0.38495[/C][/ROW]
[ROW][C]18[/C][C]0.089653[/C][C]0.6211[/C][C]0.268725[/C][/ROW]
[ROW][C]19[/C][C]-0.035464[/C][C]-0.2457[/C][C]0.403479[/C][/ROW]
[ROW][C]20[/C][C]0.126742[/C][C]0.8781[/C][C]0.192134[/C][/ROW]
[ROW][C]21[/C][C]0.076037[/C][C]0.5268[/C][C]0.300381[/C][/ROW]
[ROW][C]22[/C][C]-0.029962[/C][C]-0.2076[/C][C]0.418217[/C][/ROW]
[ROW][C]23[/C][C]0.161016[/C][C]1.1156[/C][C]0.135084[/C][/ROW]
[ROW][C]24[/C][C]-0.18385[/C][C]-1.2737[/C][C]0.104443[/C][/ROW]
[ROW][C]25[/C][C]-0.040354[/C][C]-0.2796[/C][C]0.390501[/C][/ROW]
[ROW][C]26[/C][C]0.044369[/C][C]0.3074[/C][C]0.379936[/C][/ROW]
[ROW][C]27[/C][C]-0.179721[/C][C]-1.2451[/C][C]0.109562[/C][/ROW]
[ROW][C]28[/C][C]-0.204122[/C][C]-1.4142[/C][C]0.081879[/C][/ROW]
[ROW][C]29[/C][C]-0.032027[/C][C]-0.2219[/C][C]0.412672[/C][/ROW]
[ROW][C]30[/C][C]-0.211427[/C][C]-1.4648[/C][C]0.074746[/C][/ROW]
[ROW][C]31[/C][C]-0.2119[/C][C]-1.4681[/C][C]0.074301[/C][/ROW]
[ROW][C]32[/C][C]-0.075316[/C][C]-0.5218[/C][C]0.302103[/C][/ROW]
[ROW][C]33[/C][C]-0.215673[/C][C]-1.4942[/C][C]0.070831[/C][/ROW]
[ROW][C]34[/C][C]-0.139286[/C][C]-0.965[/C][C]0.169691[/C][/ROW]
[ROW][C]35[/C][C]-0.007398[/C][C]-0.0513[/C][C]0.479667[/C][/ROW]
[ROW][C]36[/C][C]-0.103842[/C][C]-0.7194[/C][C]0.237679[/C][/ROW]
[ROW][C]37[/C][C]-0.043623[/C][C]-0.3022[/C][C]0.381891[/C][/ROW]
[ROW][C]38[/C][C]0.121302[/C][C]0.8404[/C][C]0.202424[/C][/ROW]
[ROW][C]39[/C][C]0.049154[/C][C]0.3405[/C][C]0.367466[/C][/ROW]
[ROW][C]40[/C][C]0.050506[/C][C]0.3499[/C][C]0.363966[/C][/ROW]
[ROW][C]41[/C][C]0.162082[/C][C]1.1229[/C][C]0.133525[/C][/ROW]
[ROW][C]42[/C][C]0.076956[/C][C]0.5332[/C][C]0.298189[/C][/ROW]
[ROW][C]43[/C][C]0.076633[/C][C]0.5309[/C][C]0.298957[/C][/ROW]
[ROW][C]44[/C][C]0.130704[/C][C]0.9055[/C][C]0.184851[/C][/ROW]
[ROW][C]45[/C][C]0.007634[/C][C]0.0529[/C][C]0.47902[/C][/ROW]
[ROW][C]46[/C][C]0.03018[/C][C]0.2091[/C][C]0.417629[/C][/ROW]
[ROW][C]47[/C][C]0.040995[/C][C]0.284[/C][C]0.388807[/C][/ROW]
[ROW][C]48[/C][C]NA[/C][C]NA[/C][C]NA[/C][/ROW]
[ROW][C]49[/C][C]NA[/C][C]NA[/C][C]NA[/C][/ROW]
[ROW][C]50[/C][C]NA[/C][C]NA[/C][C]NA[/C][/ROW]
[ROW][C]51[/C][C]NA[/C][C]NA[/C][C]NA[/C][/ROW]
[ROW][C]52[/C][C]NA[/C][C]NA[/C][C]NA[/C][/ROW]
[ROW][C]53[/C][C]NA[/C][C]NA[/C][C]NA[/C][/ROW]
[ROW][C]54[/C][C]NA[/C][C]NA[/C][C]NA[/C][/ROW]
[ROW][C]55[/C][C]NA[/C][C]NA[/C][C]NA[/C][/ROW]
[ROW][C]56[/C][C]NA[/C][C]NA[/C][C]NA[/C][/ROW]
[ROW][C]57[/C][C]NA[/C][C]NA[/C][C]NA[/C][/ROW]
[ROW][C]58[/C][C]NA[/C][C]NA[/C][C]NA[/C][/ROW]
[ROW][C]59[/C][C]NA[/C][C]NA[/C][C]NA[/C][/ROW]
[ROW][C]60[/C][C]NA[/C][C]NA[/C][C]NA[/C][/ROW]
[/TABLE]
Source: https://freestatistics.org/blog/index.php?pk=30789&T=1

Globally Unique Identifier (entire table): ba.freestatistics.org/blog/index.php?pk=30789&T=1

As an alternative you can also use a QR Code:  

The GUIDs for individual cells are displayed in the table below:

Autocorrelation Function
Time lag kACF(k)T-STATP-value
10.1618741.12150.133828
20.2021861.40080.083855
30.4785573.31550.000874
40.0500420.34670.365166
50.036950.2560.399523
60.1605431.11230.135779
7-0.188891-1.30870.098438
8-0.087974-0.60950.272532
90.0635940.44060.330744
10-0.211673-1.46650.074515
11-0.212523-1.47240.07372
12-0.011238-0.07790.469132
13-0.17925-1.24190.110158
14-0.134289-0.93040.178415
15-0.011499-0.07970.468417
16-0.188865-1.30850.098468
170.0424590.29420.38495
180.0896530.62110.268725
19-0.035464-0.24570.403479
200.1267420.87810.192134
210.0760370.52680.300381
22-0.029962-0.20760.418217
230.1610161.11560.135084
24-0.18385-1.27370.104443
25-0.040354-0.27960.390501
260.0443690.30740.379936
27-0.179721-1.24510.109562
28-0.204122-1.41420.081879
29-0.032027-0.22190.412672
30-0.211427-1.46480.074746
31-0.2119-1.46810.074301
32-0.075316-0.52180.302103
33-0.215673-1.49420.070831
34-0.139286-0.9650.169691
35-0.007398-0.05130.479667
36-0.103842-0.71940.237679
37-0.043623-0.30220.381891
380.1213020.84040.202424
390.0491540.34050.367466
400.0505060.34990.363966
410.1620821.12290.133525
420.0769560.53320.298189
430.0766330.53090.298957
440.1307040.90550.184851
450.0076340.05290.47902
460.030180.20910.417629
470.0409950.2840.388807
48NANANA
49NANANA
50NANANA
51NANANA
52NANANA
53NANANA
54NANANA
55NANANA
56NANANA
57NANANA
58NANANA
59NANANA
60NANANA


Partial Autocorrelation Function
Time lag kPACF(k)T-STATP-value
10.1618741.12150.133828
20.1807181.25210.108309
30.4485053.10730.001584
4-0.095348-0.66060.256016
5-0.14425-0.99940.161307
6-0.052908-0.36660.35778
7-0.222081-1.53860.065232
8-0.047035-0.32590.372971
90.1301720.90190.185817
10-0.005442-0.03770.485041
11-0.195754-1.35620.090687
12-0.042826-0.29670.383985
130.0033840.02340.490695
140.0294610.20410.419564
150.0151310.10480.458473
16-0.100482-0.69620.244842
170.1327720.91990.18112
180.05560.38520.350892
190.0552810.3830.351706
200.05330.36930.356774
21-0.115953-0.80330.212867
22-0.152755-1.05830.147604
230.0709580.49160.312618
24-0.280149-1.94090.029076
250.078940.54690.293487
260.0247140.17120.432385
27-0.023052-0.15970.436889
28-0.213834-1.48150.072506
29-0.035723-0.24750.40279
30-0.012877-0.08920.46464
31-0.088194-0.6110.272033
32-0.063967-0.44320.329814
330.0176640.12240.451554
340.0292510.20270.420129
35-0.126926-0.87940.191792
360.0602770.41760.339048
370.0097930.06780.473095
38-0.029643-0.20540.419076
390.0428430.29680.383939
40-0.100161-0.69390.245533
410.0426620.29560.384417
42-0.012542-0.08690.465558
43-0.006088-0.04220.483264
44-0.036236-0.2510.401424
45-0.061105-0.42330.336966
46-0.071331-0.49420.311711
470.0494210.34240.366774
48NANANA
49NANANA
50NANANA
51NANANA
52NANANA
53NANANA
54NANANA
55NANANA
56NANANA
57NANANA
58NANANA
59NANANA
60NANANA

\begin{tabular}{lllllllll}
\hline
Partial Autocorrelation Function \tabularnewline
Time lag k & PACF(k) & T-STAT & P-value \tabularnewline
1 & 0.161874 & 1.1215 & 0.133828 \tabularnewline
2 & 0.180718 & 1.2521 & 0.108309 \tabularnewline
3 & 0.448505 & 3.1073 & 0.001584 \tabularnewline
4 & -0.095348 & -0.6606 & 0.256016 \tabularnewline
5 & -0.14425 & -0.9994 & 0.161307 \tabularnewline
6 & -0.052908 & -0.3666 & 0.35778 \tabularnewline
7 & -0.222081 & -1.5386 & 0.065232 \tabularnewline
8 & -0.047035 & -0.3259 & 0.372971 \tabularnewline
9 & 0.130172 & 0.9019 & 0.185817 \tabularnewline
10 & -0.005442 & -0.0377 & 0.485041 \tabularnewline
11 & -0.195754 & -1.3562 & 0.090687 \tabularnewline
12 & -0.042826 & -0.2967 & 0.383985 \tabularnewline
13 & 0.003384 & 0.0234 & 0.490695 \tabularnewline
14 & 0.029461 & 0.2041 & 0.419564 \tabularnewline
15 & 0.015131 & 0.1048 & 0.458473 \tabularnewline
16 & -0.100482 & -0.6962 & 0.244842 \tabularnewline
17 & 0.132772 & 0.9199 & 0.18112 \tabularnewline
18 & 0.0556 & 0.3852 & 0.350892 \tabularnewline
19 & 0.055281 & 0.383 & 0.351706 \tabularnewline
20 & 0.0533 & 0.3693 & 0.356774 \tabularnewline
21 & -0.115953 & -0.8033 & 0.212867 \tabularnewline
22 & -0.152755 & -1.0583 & 0.147604 \tabularnewline
23 & 0.070958 & 0.4916 & 0.312618 \tabularnewline
24 & -0.280149 & -1.9409 & 0.029076 \tabularnewline
25 & 0.07894 & 0.5469 & 0.293487 \tabularnewline
26 & 0.024714 & 0.1712 & 0.432385 \tabularnewline
27 & -0.023052 & -0.1597 & 0.436889 \tabularnewline
28 & -0.213834 & -1.4815 & 0.072506 \tabularnewline
29 & -0.035723 & -0.2475 & 0.40279 \tabularnewline
30 & -0.012877 & -0.0892 & 0.46464 \tabularnewline
31 & -0.088194 & -0.611 & 0.272033 \tabularnewline
32 & -0.063967 & -0.4432 & 0.329814 \tabularnewline
33 & 0.017664 & 0.1224 & 0.451554 \tabularnewline
34 & 0.029251 & 0.2027 & 0.420129 \tabularnewline
35 & -0.126926 & -0.8794 & 0.191792 \tabularnewline
36 & 0.060277 & 0.4176 & 0.339048 \tabularnewline
37 & 0.009793 & 0.0678 & 0.473095 \tabularnewline
38 & -0.029643 & -0.2054 & 0.419076 \tabularnewline
39 & 0.042843 & 0.2968 & 0.383939 \tabularnewline
40 & -0.100161 & -0.6939 & 0.245533 \tabularnewline
41 & 0.042662 & 0.2956 & 0.384417 \tabularnewline
42 & -0.012542 & -0.0869 & 0.465558 \tabularnewline
43 & -0.006088 & -0.0422 & 0.483264 \tabularnewline
44 & -0.036236 & -0.251 & 0.401424 \tabularnewline
45 & -0.061105 & -0.4233 & 0.336966 \tabularnewline
46 & -0.071331 & -0.4942 & 0.311711 \tabularnewline
47 & 0.049421 & 0.3424 & 0.366774 \tabularnewline
48 & NA & NA & NA \tabularnewline
49 & NA & NA & NA \tabularnewline
50 & NA & NA & NA \tabularnewline
51 & NA & NA & NA \tabularnewline
52 & NA & NA & NA \tabularnewline
53 & NA & NA & NA \tabularnewline
54 & NA & NA & NA \tabularnewline
55 & NA & NA & NA \tabularnewline
56 & NA & NA & NA \tabularnewline
57 & NA & NA & NA \tabularnewline
58 & NA & NA & NA \tabularnewline
59 & NA & NA & NA \tabularnewline
60 & NA & NA & NA \tabularnewline
\hline
\end{tabular}
%Source: https://freestatistics.org/blog/index.php?pk=30789&T=2

[TABLE]
[ROW][C]Partial Autocorrelation Function[/C][/ROW]
[ROW][C]Time lag k[/C][C]PACF(k)[/C][C]T-STAT[/C][C]P-value[/C][/ROW]
[ROW][C]1[/C][C]0.161874[/C][C]1.1215[/C][C]0.133828[/C][/ROW]
[ROW][C]2[/C][C]0.180718[/C][C]1.2521[/C][C]0.108309[/C][/ROW]
[ROW][C]3[/C][C]0.448505[/C][C]3.1073[/C][C]0.001584[/C][/ROW]
[ROW][C]4[/C][C]-0.095348[/C][C]-0.6606[/C][C]0.256016[/C][/ROW]
[ROW][C]5[/C][C]-0.14425[/C][C]-0.9994[/C][C]0.161307[/C][/ROW]
[ROW][C]6[/C][C]-0.052908[/C][C]-0.3666[/C][C]0.35778[/C][/ROW]
[ROW][C]7[/C][C]-0.222081[/C][C]-1.5386[/C][C]0.065232[/C][/ROW]
[ROW][C]8[/C][C]-0.047035[/C][C]-0.3259[/C][C]0.372971[/C][/ROW]
[ROW][C]9[/C][C]0.130172[/C][C]0.9019[/C][C]0.185817[/C][/ROW]
[ROW][C]10[/C][C]-0.005442[/C][C]-0.0377[/C][C]0.485041[/C][/ROW]
[ROW][C]11[/C][C]-0.195754[/C][C]-1.3562[/C][C]0.090687[/C][/ROW]
[ROW][C]12[/C][C]-0.042826[/C][C]-0.2967[/C][C]0.383985[/C][/ROW]
[ROW][C]13[/C][C]0.003384[/C][C]0.0234[/C][C]0.490695[/C][/ROW]
[ROW][C]14[/C][C]0.029461[/C][C]0.2041[/C][C]0.419564[/C][/ROW]
[ROW][C]15[/C][C]0.015131[/C][C]0.1048[/C][C]0.458473[/C][/ROW]
[ROW][C]16[/C][C]-0.100482[/C][C]-0.6962[/C][C]0.244842[/C][/ROW]
[ROW][C]17[/C][C]0.132772[/C][C]0.9199[/C][C]0.18112[/C][/ROW]
[ROW][C]18[/C][C]0.0556[/C][C]0.3852[/C][C]0.350892[/C][/ROW]
[ROW][C]19[/C][C]0.055281[/C][C]0.383[/C][C]0.351706[/C][/ROW]
[ROW][C]20[/C][C]0.0533[/C][C]0.3693[/C][C]0.356774[/C][/ROW]
[ROW][C]21[/C][C]-0.115953[/C][C]-0.8033[/C][C]0.212867[/C][/ROW]
[ROW][C]22[/C][C]-0.152755[/C][C]-1.0583[/C][C]0.147604[/C][/ROW]
[ROW][C]23[/C][C]0.070958[/C][C]0.4916[/C][C]0.312618[/C][/ROW]
[ROW][C]24[/C][C]-0.280149[/C][C]-1.9409[/C][C]0.029076[/C][/ROW]
[ROW][C]25[/C][C]0.07894[/C][C]0.5469[/C][C]0.293487[/C][/ROW]
[ROW][C]26[/C][C]0.024714[/C][C]0.1712[/C][C]0.432385[/C][/ROW]
[ROW][C]27[/C][C]-0.023052[/C][C]-0.1597[/C][C]0.436889[/C][/ROW]
[ROW][C]28[/C][C]-0.213834[/C][C]-1.4815[/C][C]0.072506[/C][/ROW]
[ROW][C]29[/C][C]-0.035723[/C][C]-0.2475[/C][C]0.40279[/C][/ROW]
[ROW][C]30[/C][C]-0.012877[/C][C]-0.0892[/C][C]0.46464[/C][/ROW]
[ROW][C]31[/C][C]-0.088194[/C][C]-0.611[/C][C]0.272033[/C][/ROW]
[ROW][C]32[/C][C]-0.063967[/C][C]-0.4432[/C][C]0.329814[/C][/ROW]
[ROW][C]33[/C][C]0.017664[/C][C]0.1224[/C][C]0.451554[/C][/ROW]
[ROW][C]34[/C][C]0.029251[/C][C]0.2027[/C][C]0.420129[/C][/ROW]
[ROW][C]35[/C][C]-0.126926[/C][C]-0.8794[/C][C]0.191792[/C][/ROW]
[ROW][C]36[/C][C]0.060277[/C][C]0.4176[/C][C]0.339048[/C][/ROW]
[ROW][C]37[/C][C]0.009793[/C][C]0.0678[/C][C]0.473095[/C][/ROW]
[ROW][C]38[/C][C]-0.029643[/C][C]-0.2054[/C][C]0.419076[/C][/ROW]
[ROW][C]39[/C][C]0.042843[/C][C]0.2968[/C][C]0.383939[/C][/ROW]
[ROW][C]40[/C][C]-0.100161[/C][C]-0.6939[/C][C]0.245533[/C][/ROW]
[ROW][C]41[/C][C]0.042662[/C][C]0.2956[/C][C]0.384417[/C][/ROW]
[ROW][C]42[/C][C]-0.012542[/C][C]-0.0869[/C][C]0.465558[/C][/ROW]
[ROW][C]43[/C][C]-0.006088[/C][C]-0.0422[/C][C]0.483264[/C][/ROW]
[ROW][C]44[/C][C]-0.036236[/C][C]-0.251[/C][C]0.401424[/C][/ROW]
[ROW][C]45[/C][C]-0.061105[/C][C]-0.4233[/C][C]0.336966[/C][/ROW]
[ROW][C]46[/C][C]-0.071331[/C][C]-0.4942[/C][C]0.311711[/C][/ROW]
[ROW][C]47[/C][C]0.049421[/C][C]0.3424[/C][C]0.366774[/C][/ROW]
[ROW][C]48[/C][C]NA[/C][C]NA[/C][C]NA[/C][/ROW]
[ROW][C]49[/C][C]NA[/C][C]NA[/C][C]NA[/C][/ROW]
[ROW][C]50[/C][C]NA[/C][C]NA[/C][C]NA[/C][/ROW]
[ROW][C]51[/C][C]NA[/C][C]NA[/C][C]NA[/C][/ROW]
[ROW][C]52[/C][C]NA[/C][C]NA[/C][C]NA[/C][/ROW]
[ROW][C]53[/C][C]NA[/C][C]NA[/C][C]NA[/C][/ROW]
[ROW][C]54[/C][C]NA[/C][C]NA[/C][C]NA[/C][/ROW]
[ROW][C]55[/C][C]NA[/C][C]NA[/C][C]NA[/C][/ROW]
[ROW][C]56[/C][C]NA[/C][C]NA[/C][C]NA[/C][/ROW]
[ROW][C]57[/C][C]NA[/C][C]NA[/C][C]NA[/C][/ROW]
[ROW][C]58[/C][C]NA[/C][C]NA[/C][C]NA[/C][/ROW]
[ROW][C]59[/C][C]NA[/C][C]NA[/C][C]NA[/C][/ROW]
[ROW][C]60[/C][C]NA[/C][C]NA[/C][C]NA[/C][/ROW]
[/TABLE]
Source: https://freestatistics.org/blog/index.php?pk=30789&T=2

Globally Unique Identifier (entire table): ba.freestatistics.org/blog/index.php?pk=30789&T=2

As an alternative you can also use a QR Code:  

The GUIDs for individual cells are displayed in the table below:

Partial Autocorrelation Function
Time lag kPACF(k)T-STATP-value
10.1618741.12150.133828
20.1807181.25210.108309
30.4485053.10730.001584
4-0.095348-0.66060.256016
5-0.14425-0.99940.161307
6-0.052908-0.36660.35778
7-0.222081-1.53860.065232
8-0.047035-0.32590.372971
90.1301720.90190.185817
10-0.005442-0.03770.485041
11-0.195754-1.35620.090687
12-0.042826-0.29670.383985
130.0033840.02340.490695
140.0294610.20410.419564
150.0151310.10480.458473
16-0.100482-0.69620.244842
170.1327720.91990.18112
180.05560.38520.350892
190.0552810.3830.351706
200.05330.36930.356774
21-0.115953-0.80330.212867
22-0.152755-1.05830.147604
230.0709580.49160.312618
24-0.280149-1.94090.029076
250.078940.54690.293487
260.0247140.17120.432385
27-0.023052-0.15970.436889
28-0.213834-1.48150.072506
29-0.035723-0.24750.40279
30-0.012877-0.08920.46464
31-0.088194-0.6110.272033
32-0.063967-0.44320.329814
330.0176640.12240.451554
340.0292510.20270.420129
35-0.126926-0.87940.191792
360.0602770.41760.339048
370.0097930.06780.473095
38-0.029643-0.20540.419076
390.0428430.29680.383939
40-0.100161-0.69390.245533
410.0426620.29560.384417
42-0.012542-0.08690.465558
43-0.006088-0.04220.483264
44-0.036236-0.2510.401424
45-0.061105-0.42330.336966
46-0.071331-0.49420.311711
470.0494210.34240.366774
48NANANA
49NANANA
50NANANA
51NANANA
52NANANA
53NANANA
54NANANA
55NANANA
56NANANA
57NANANA
58NANANA
59NANANA
60NANANA


Parameters (Session):
par1 = 60 ; par2 = 0.2 ; par3 = 0 ; par4 = 1 ; par5 = 12 ;
Parameters (R input):
par1 = 60 ; par2 = 0.2 ; par3 = 0 ; par4 = 1 ; par5 = 12 ;
R code (references can be found in the software module):
if (par1 == 'Default') {
par1 = 10*log10(length(x))
} else {
par1 <- as.numeric(par1)
}
par2 <- as.numeric(par2)
par3 <- as.numeric(par3)
par4 <- as.numeric(par4)
par5 <- as.numeric(par5)
if (par2 == 0) {
x <- log(x)
} else {
x <- (x ^ par2 - 1) / par2
}
if (par3 > 0) x <- diff(x,lag=1,difference=par3)
if (par4 > 0) x <- diff(x,lag=par5,difference=par4)
bitmap(file='pic1.png')
racf <- acf(x,par1,main='Autocorrelation',xlab='lags',ylab='ACF')
dev.off()
bitmap(file='pic2.png')
rpacf <- pacf(x,par1,main='Partial Autocorrelation',xlab='lags',ylab='PACF')
dev.off()
(myacf <- c(racf$acf))
(mypacf <- c(rpacf$acf))
lengthx <- length(x)
sqrtn <- sqrt(lengthx)
load(file='createtable')
a<-table.start()
a<-table.row.start(a)
a<-table.element(a,'Autocorrelation Function',4,TRUE)
a<-table.row.end(a)
a<-table.row.start(a)
a<-table.element(a,'Time lag k',header=TRUE)
a<-table.element(a,hyperlink('basics.htm','ACF(k)','click here for more information about the Autocorrelation Function'),header=TRUE)
a<-table.element(a,'T-STAT',header=TRUE)
a<-table.element(a,'P-value',header=TRUE)
a<-table.row.end(a)
for (i in 2:(par1+1)) {
a<-table.row.start(a)
a<-table.element(a,i-1,header=TRUE)
a<-table.element(a,round(myacf[i],6))
mytstat <- myacf[i]*sqrtn
a<-table.element(a,round(mytstat,4))
a<-table.element(a,round(1-pt(abs(mytstat),lengthx),6))
a<-table.row.end(a)
}
a<-table.end(a)
table.save(a,file='mytable.tab')
a<-table.start()
a<-table.row.start(a)
a<-table.element(a,'Partial Autocorrelation Function',4,TRUE)
a<-table.row.end(a)
a<-table.row.start(a)
a<-table.element(a,'Time lag k',header=TRUE)
a<-table.element(a,hyperlink('basics.htm','PACF(k)','click here for more information about the Partial Autocorrelation Function'),header=TRUE)
a<-table.element(a,'T-STAT',header=TRUE)
a<-table.element(a,'P-value',header=TRUE)
a<-table.row.end(a)
for (i in 1:par1) {
a<-table.row.start(a)
a<-table.element(a,i,header=TRUE)
a<-table.element(a,round(mypacf[i],6))
mytstat <- mypacf[i]*sqrtn
a<-table.element(a,round(mytstat,4))
a<-table.element(a,round(1-pt(abs(mytstat),lengthx),6))
a<-table.row.end(a)
}
a<-table.end(a)
table.save(a,file='mytable1.tab')