Free Statistics

of Irreproducible Research!

Author's title

Author*The author of this computation has been verified*
R Software Modulerwasp_autocorrelation.wasp
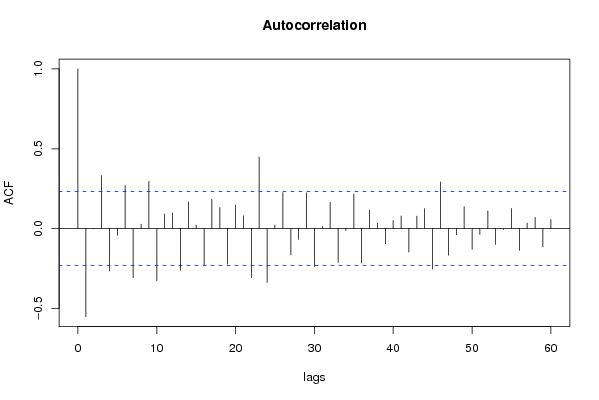
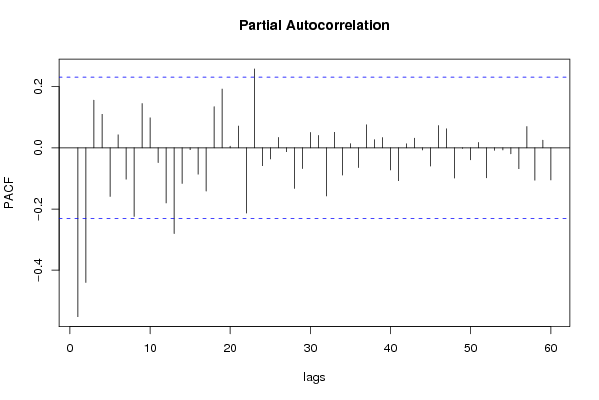
Title produced by software(Partial) Autocorrelation Function
Date of computationMon, 08 Dec 2008 12:22:58 -0700
Cite this page as followsStatistical Computations at FreeStatistics.org, Office for Research Development and Education, URL https://freestatistics.org/blog/index.php?v=date/2008/Dec/08/t1228764212v6lvcmf4d2zvbdw.htm/, Retrieved Thu, 16 May 2024 15:03:13 +0000
Statistical Computations at FreeStatistics.org, Office for Research Development and Education, URL https://freestatistics.org/blog/index.php?pk=30787, Retrieved Thu, 16 May 2024 15:03:13 +0000
QR Codes:

Original text written by user:
IsPrivate?No (this computation is public)
User-defined keywords
Estimated Impact155
Family? (F = Feedback message, R = changed R code, M = changed R Module, P = changed Parameters, D = changed Data)
-     [Univariate Data Series] [data set] [2008-12-01 19:54:57] [b98453cac15ba1066b407e146608df68]
F RMPD    [(Partial) Autocorrelation Function] [S3 - ACF] [2008-12-08 19:22:58] [5f3e73ccf1ddc75508eed47fa51813d3] [Current]
Feedback Forum
2008-12-14 12:55:48 [Jeroen Michel] [reply
Ook hier zien we een perfect model en met mooie conclusie. Hier zijn zowel trend als seizoenaliteit weg gefilterd en wordt uitgelegd hoe de interpretatie moet gebeuren.
2008-12-14 14:31:55 [Nathalie Koulouris] [reply
De student heeft deze vraag correct opgelost en een goede toelichting gegeven. Zowel de trend als de seizoenlaliteit werden weggewerkt.

Post a new message
Dataseries X:
14897
13063
12604
13630
14421
13978
12928
13430
13470
14786
14292
14309
14013
13241
12153
14290
15669
14170
14570
14469
14265
15321
14434
13692
14194
13519
11858
14616
15643
14077
14888
14160
14643
17193
15386
14287
17527
14497
14398
16630
16671
16615
16869
15664
16360
18448
16889
16505
18321
15052
15700
18135
16769
18883
19021
18102
17776
21490
17065
18690
18953
16399
16896
18553
19270
19422
17579
18637
18077
20439
18075
19563
19899
19228
17790
19221
22059
21231
19504
23913
23166
23574
25002
22604
23409


Summary of computational transaction
Raw Inputview raw input (R code)
Raw Outputview raw output of R engine
Computing time2 seconds
R Server'George Udny Yule' @ 72.249.76.132

\begin{tabular}{lllllllll}
\hline
Summary of computational transaction \tabularnewline
Raw Input & view raw input (R code)  \tabularnewline
Raw Output & view raw output of R engine  \tabularnewline
Computing time & 2 seconds \tabularnewline
R Server & 'George Udny Yule' @ 72.249.76.132 \tabularnewline
\hline
\end{tabular}
%Source: https://freestatistics.org/blog/index.php?pk=30787&T=0

[TABLE]
[ROW][C]Summary of computational transaction[/C][/ROW]
[ROW][C]Raw Input[/C][C]view raw input (R code) [/C][/ROW]
[ROW][C]Raw Output[/C][C]view raw output of R engine [/C][/ROW]
[ROW][C]Computing time[/C][C]2 seconds[/C][/ROW]
[ROW][C]R Server[/C][C]'George Udny Yule' @ 72.249.76.132[/C][/ROW]
[/TABLE]
Source: https://freestatistics.org/blog/index.php?pk=30787&T=0

Globally Unique Identifier (entire table): ba.freestatistics.org/blog/index.php?pk=30787&T=0

As an alternative you can also use a QR Code:  

The GUIDs for individual cells are displayed in the table below:

Summary of computational transaction
Raw Inputview raw input (R code)
Raw Outputview raw output of R engine
Computing time2 seconds
R Server'George Udny Yule' @ 72.249.76.132


Autocorrelation Function
Time lag kACF(k)T-STATP-value
1-0.551753-4.68187e-06
2-0.001542-0.01310.494799
30.3313312.81140.003175
4-0.266155-2.25840.013476
5-0.042136-0.35750.360869
60.2687772.28070.012765
7-0.308186-2.6150.00543
80.0272450.23120.408916
90.296072.51220.007119
10-0.325885-2.76520.00361
110.0914650.77610.220113
120.0977440.82940.204815
13-0.26177-2.22120.014742
140.1664591.41240.081063
150.0223720.18980.424987
16-0.229834-1.95020.027523
170.1822071.54610.063236
180.1320351.12040.133142
19-0.221369-1.87840.032189
200.1471071.24820.107992
210.0789130.66960.252628
22-0.307871-2.61240.005469
230.4483893.80470.000148
24-0.33775-2.86590.002724
250.0225280.19120.424469
260.2256851.9150.029733
27-0.165336-1.40290.082469
28-0.068357-0.580.281853
290.2248981.90830.030168
30-0.237676-2.01680.023726
310.0144240.12240.451465
320.1649741.39990.082926
33-0.211793-1.79710.038255
34-0.011376-0.09650.461684
350.2163581.83590.035254
36-0.21592-1.83210.035533
370.11550.98010.165171
380.0343550.29150.38575
39-0.095071-0.80670.211247
400.051050.43320.333091
410.0780920.66260.25484
42-0.147083-1.2480.10803
430.0773440.65630.256866
440.1247811.05880.146615
45-0.253161-2.14810.017534
460.2920182.47790.007782
47-0.16703-1.41730.080355
48-0.038656-0.3280.37193
490.1371891.16410.124117
50-0.129927-1.10250.136964
51-0.037111-0.31490.376876
520.1108440.94050.175041
53-0.099244-0.84210.201257
54-0.005006-0.04250.483119
550.1263741.07230.14358
56-0.137053-1.16290.124349
570.0342750.29080.386006
580.0694240.58910.278824
59-0.113273-0.96120.169845
600.0567690.48170.315739

\begin{tabular}{lllllllll}
\hline
Autocorrelation Function \tabularnewline
Time lag k & ACF(k) & T-STAT & P-value \tabularnewline
1 & -0.551753 & -4.6818 & 7e-06 \tabularnewline
2 & -0.001542 & -0.0131 & 0.494799 \tabularnewline
3 & 0.331331 & 2.8114 & 0.003175 \tabularnewline
4 & -0.266155 & -2.2584 & 0.013476 \tabularnewline
5 & -0.042136 & -0.3575 & 0.360869 \tabularnewline
6 & 0.268777 & 2.2807 & 0.012765 \tabularnewline
7 & -0.308186 & -2.615 & 0.00543 \tabularnewline
8 & 0.027245 & 0.2312 & 0.408916 \tabularnewline
9 & 0.29607 & 2.5122 & 0.007119 \tabularnewline
10 & -0.325885 & -2.7652 & 0.00361 \tabularnewline
11 & 0.091465 & 0.7761 & 0.220113 \tabularnewline
12 & 0.097744 & 0.8294 & 0.204815 \tabularnewline
13 & -0.26177 & -2.2212 & 0.014742 \tabularnewline
14 & 0.166459 & 1.4124 & 0.081063 \tabularnewline
15 & 0.022372 & 0.1898 & 0.424987 \tabularnewline
16 & -0.229834 & -1.9502 & 0.027523 \tabularnewline
17 & 0.182207 & 1.5461 & 0.063236 \tabularnewline
18 & 0.132035 & 1.1204 & 0.133142 \tabularnewline
19 & -0.221369 & -1.8784 & 0.032189 \tabularnewline
20 & 0.147107 & 1.2482 & 0.107992 \tabularnewline
21 & 0.078913 & 0.6696 & 0.252628 \tabularnewline
22 & -0.307871 & -2.6124 & 0.005469 \tabularnewline
23 & 0.448389 & 3.8047 & 0.000148 \tabularnewline
24 & -0.33775 & -2.8659 & 0.002724 \tabularnewline
25 & 0.022528 & 0.1912 & 0.424469 \tabularnewline
26 & 0.225685 & 1.915 & 0.029733 \tabularnewline
27 & -0.165336 & -1.4029 & 0.082469 \tabularnewline
28 & -0.068357 & -0.58 & 0.281853 \tabularnewline
29 & 0.224898 & 1.9083 & 0.030168 \tabularnewline
30 & -0.237676 & -2.0168 & 0.023726 \tabularnewline
31 & 0.014424 & 0.1224 & 0.451465 \tabularnewline
32 & 0.164974 & 1.3999 & 0.082926 \tabularnewline
33 & -0.211793 & -1.7971 & 0.038255 \tabularnewline
34 & -0.011376 & -0.0965 & 0.461684 \tabularnewline
35 & 0.216358 & 1.8359 & 0.035254 \tabularnewline
36 & -0.21592 & -1.8321 & 0.035533 \tabularnewline
37 & 0.1155 & 0.9801 & 0.165171 \tabularnewline
38 & 0.034355 & 0.2915 & 0.38575 \tabularnewline
39 & -0.095071 & -0.8067 & 0.211247 \tabularnewline
40 & 0.05105 & 0.4332 & 0.333091 \tabularnewline
41 & 0.078092 & 0.6626 & 0.25484 \tabularnewline
42 & -0.147083 & -1.248 & 0.10803 \tabularnewline
43 & 0.077344 & 0.6563 & 0.256866 \tabularnewline
44 & 0.124781 & 1.0588 & 0.146615 \tabularnewline
45 & -0.253161 & -2.1481 & 0.017534 \tabularnewline
46 & 0.292018 & 2.4779 & 0.007782 \tabularnewline
47 & -0.16703 & -1.4173 & 0.080355 \tabularnewline
48 & -0.038656 & -0.328 & 0.37193 \tabularnewline
49 & 0.137189 & 1.1641 & 0.124117 \tabularnewline
50 & -0.129927 & -1.1025 & 0.136964 \tabularnewline
51 & -0.037111 & -0.3149 & 0.376876 \tabularnewline
52 & 0.110844 & 0.9405 & 0.175041 \tabularnewline
53 & -0.099244 & -0.8421 & 0.201257 \tabularnewline
54 & -0.005006 & -0.0425 & 0.483119 \tabularnewline
55 & 0.126374 & 1.0723 & 0.14358 \tabularnewline
56 & -0.137053 & -1.1629 & 0.124349 \tabularnewline
57 & 0.034275 & 0.2908 & 0.386006 \tabularnewline
58 & 0.069424 & 0.5891 & 0.278824 \tabularnewline
59 & -0.113273 & -0.9612 & 0.169845 \tabularnewline
60 & 0.056769 & 0.4817 & 0.315739 \tabularnewline
\hline
\end{tabular}
%Source: https://freestatistics.org/blog/index.php?pk=30787&T=1

[TABLE]
[ROW][C]Autocorrelation Function[/C][/ROW]
[ROW][C]Time lag k[/C][C]ACF(k)[/C][C]T-STAT[/C][C]P-value[/C][/ROW]
[ROW][C]1[/C][C]-0.551753[/C][C]-4.6818[/C][C]7e-06[/C][/ROW]
[ROW][C]2[/C][C]-0.001542[/C][C]-0.0131[/C][C]0.494799[/C][/ROW]
[ROW][C]3[/C][C]0.331331[/C][C]2.8114[/C][C]0.003175[/C][/ROW]
[ROW][C]4[/C][C]-0.266155[/C][C]-2.2584[/C][C]0.013476[/C][/ROW]
[ROW][C]5[/C][C]-0.042136[/C][C]-0.3575[/C][C]0.360869[/C][/ROW]
[ROW][C]6[/C][C]0.268777[/C][C]2.2807[/C][C]0.012765[/C][/ROW]
[ROW][C]7[/C][C]-0.308186[/C][C]-2.615[/C][C]0.00543[/C][/ROW]
[ROW][C]8[/C][C]0.027245[/C][C]0.2312[/C][C]0.408916[/C][/ROW]
[ROW][C]9[/C][C]0.29607[/C][C]2.5122[/C][C]0.007119[/C][/ROW]
[ROW][C]10[/C][C]-0.325885[/C][C]-2.7652[/C][C]0.00361[/C][/ROW]
[ROW][C]11[/C][C]0.091465[/C][C]0.7761[/C][C]0.220113[/C][/ROW]
[ROW][C]12[/C][C]0.097744[/C][C]0.8294[/C][C]0.204815[/C][/ROW]
[ROW][C]13[/C][C]-0.26177[/C][C]-2.2212[/C][C]0.014742[/C][/ROW]
[ROW][C]14[/C][C]0.166459[/C][C]1.4124[/C][C]0.081063[/C][/ROW]
[ROW][C]15[/C][C]0.022372[/C][C]0.1898[/C][C]0.424987[/C][/ROW]
[ROW][C]16[/C][C]-0.229834[/C][C]-1.9502[/C][C]0.027523[/C][/ROW]
[ROW][C]17[/C][C]0.182207[/C][C]1.5461[/C][C]0.063236[/C][/ROW]
[ROW][C]18[/C][C]0.132035[/C][C]1.1204[/C][C]0.133142[/C][/ROW]
[ROW][C]19[/C][C]-0.221369[/C][C]-1.8784[/C][C]0.032189[/C][/ROW]
[ROW][C]20[/C][C]0.147107[/C][C]1.2482[/C][C]0.107992[/C][/ROW]
[ROW][C]21[/C][C]0.078913[/C][C]0.6696[/C][C]0.252628[/C][/ROW]
[ROW][C]22[/C][C]-0.307871[/C][C]-2.6124[/C][C]0.005469[/C][/ROW]
[ROW][C]23[/C][C]0.448389[/C][C]3.8047[/C][C]0.000148[/C][/ROW]
[ROW][C]24[/C][C]-0.33775[/C][C]-2.8659[/C][C]0.002724[/C][/ROW]
[ROW][C]25[/C][C]0.022528[/C][C]0.1912[/C][C]0.424469[/C][/ROW]
[ROW][C]26[/C][C]0.225685[/C][C]1.915[/C][C]0.029733[/C][/ROW]
[ROW][C]27[/C][C]-0.165336[/C][C]-1.4029[/C][C]0.082469[/C][/ROW]
[ROW][C]28[/C][C]-0.068357[/C][C]-0.58[/C][C]0.281853[/C][/ROW]
[ROW][C]29[/C][C]0.224898[/C][C]1.9083[/C][C]0.030168[/C][/ROW]
[ROW][C]30[/C][C]-0.237676[/C][C]-2.0168[/C][C]0.023726[/C][/ROW]
[ROW][C]31[/C][C]0.014424[/C][C]0.1224[/C][C]0.451465[/C][/ROW]
[ROW][C]32[/C][C]0.164974[/C][C]1.3999[/C][C]0.082926[/C][/ROW]
[ROW][C]33[/C][C]-0.211793[/C][C]-1.7971[/C][C]0.038255[/C][/ROW]
[ROW][C]34[/C][C]-0.011376[/C][C]-0.0965[/C][C]0.461684[/C][/ROW]
[ROW][C]35[/C][C]0.216358[/C][C]1.8359[/C][C]0.035254[/C][/ROW]
[ROW][C]36[/C][C]-0.21592[/C][C]-1.8321[/C][C]0.035533[/C][/ROW]
[ROW][C]37[/C][C]0.1155[/C][C]0.9801[/C][C]0.165171[/C][/ROW]
[ROW][C]38[/C][C]0.034355[/C][C]0.2915[/C][C]0.38575[/C][/ROW]
[ROW][C]39[/C][C]-0.095071[/C][C]-0.8067[/C][C]0.211247[/C][/ROW]
[ROW][C]40[/C][C]0.05105[/C][C]0.4332[/C][C]0.333091[/C][/ROW]
[ROW][C]41[/C][C]0.078092[/C][C]0.6626[/C][C]0.25484[/C][/ROW]
[ROW][C]42[/C][C]-0.147083[/C][C]-1.248[/C][C]0.10803[/C][/ROW]
[ROW][C]43[/C][C]0.077344[/C][C]0.6563[/C][C]0.256866[/C][/ROW]
[ROW][C]44[/C][C]0.124781[/C][C]1.0588[/C][C]0.146615[/C][/ROW]
[ROW][C]45[/C][C]-0.253161[/C][C]-2.1481[/C][C]0.017534[/C][/ROW]
[ROW][C]46[/C][C]0.292018[/C][C]2.4779[/C][C]0.007782[/C][/ROW]
[ROW][C]47[/C][C]-0.16703[/C][C]-1.4173[/C][C]0.080355[/C][/ROW]
[ROW][C]48[/C][C]-0.038656[/C][C]-0.328[/C][C]0.37193[/C][/ROW]
[ROW][C]49[/C][C]0.137189[/C][C]1.1641[/C][C]0.124117[/C][/ROW]
[ROW][C]50[/C][C]-0.129927[/C][C]-1.1025[/C][C]0.136964[/C][/ROW]
[ROW][C]51[/C][C]-0.037111[/C][C]-0.3149[/C][C]0.376876[/C][/ROW]
[ROW][C]52[/C][C]0.110844[/C][C]0.9405[/C][C]0.175041[/C][/ROW]
[ROW][C]53[/C][C]-0.099244[/C][C]-0.8421[/C][C]0.201257[/C][/ROW]
[ROW][C]54[/C][C]-0.005006[/C][C]-0.0425[/C][C]0.483119[/C][/ROW]
[ROW][C]55[/C][C]0.126374[/C][C]1.0723[/C][C]0.14358[/C][/ROW]
[ROW][C]56[/C][C]-0.137053[/C][C]-1.1629[/C][C]0.124349[/C][/ROW]
[ROW][C]57[/C][C]0.034275[/C][C]0.2908[/C][C]0.386006[/C][/ROW]
[ROW][C]58[/C][C]0.069424[/C][C]0.5891[/C][C]0.278824[/C][/ROW]
[ROW][C]59[/C][C]-0.113273[/C][C]-0.9612[/C][C]0.169845[/C][/ROW]
[ROW][C]60[/C][C]0.056769[/C][C]0.4817[/C][C]0.315739[/C][/ROW]
[/TABLE]
Source: https://freestatistics.org/blog/index.php?pk=30787&T=1

Globally Unique Identifier (entire table): ba.freestatistics.org/blog/index.php?pk=30787&T=1

As an alternative you can also use a QR Code:  

The GUIDs for individual cells are displayed in the table below:

Autocorrelation Function
Time lag kACF(k)T-STATP-value
1-0.551753-4.68187e-06
2-0.001542-0.01310.494799
30.3313312.81140.003175
4-0.266155-2.25840.013476
5-0.042136-0.35750.360869
60.2687772.28070.012765
7-0.308186-2.6150.00543
80.0272450.23120.408916
90.296072.51220.007119
10-0.325885-2.76520.00361
110.0914650.77610.220113
120.0977440.82940.204815
13-0.26177-2.22120.014742
140.1664591.41240.081063
150.0223720.18980.424987
16-0.229834-1.95020.027523
170.1822071.54610.063236
180.1320351.12040.133142
19-0.221369-1.87840.032189
200.1471071.24820.107992
210.0789130.66960.252628
22-0.307871-2.61240.005469
230.4483893.80470.000148
24-0.33775-2.86590.002724
250.0225280.19120.424469
260.2256851.9150.029733
27-0.165336-1.40290.082469
28-0.068357-0.580.281853
290.2248981.90830.030168
30-0.237676-2.01680.023726
310.0144240.12240.451465
320.1649741.39990.082926
33-0.211793-1.79710.038255
34-0.011376-0.09650.461684
350.2163581.83590.035254
36-0.21592-1.83210.035533
370.11550.98010.165171
380.0343550.29150.38575
39-0.095071-0.80670.211247
400.051050.43320.333091
410.0780920.66260.25484
42-0.147083-1.2480.10803
430.0773440.65630.256866
440.1247811.05880.146615
45-0.253161-2.14810.017534
460.2920182.47790.007782
47-0.16703-1.41730.080355
48-0.038656-0.3280.37193
490.1371891.16410.124117
50-0.129927-1.10250.136964
51-0.037111-0.31490.376876
520.1108440.94050.175041
53-0.099244-0.84210.201257
54-0.005006-0.04250.483119
550.1263741.07230.14358
56-0.137053-1.16290.124349
570.0342750.29080.386006
580.0694240.58910.278824
59-0.113273-0.96120.169845
600.0567690.48170.315739


Partial Autocorrelation Function
Time lag kPACF(k)T-STATP-value
1-0.551753-4.68187e-06
2-0.439888-3.73260.000188
30.1557951.3220.095183
40.1093260.92770.178341
5-0.158847-1.34790.090964
60.0425930.36140.359423
7-0.102603-0.87060.193429
8-0.224195-1.90240.030562
90.1446351.22730.111859
100.0979110.83080.204416
11-0.048322-0.410.341502
12-0.180043-1.52770.065482
13-0.280274-2.37820.010027
14-0.116543-0.98890.163011
15-0.00589-0.050.480138
16-0.086318-0.73240.233142
17-0.141348-1.19940.117157
180.1344411.14080.128873
190.1919181.62850.053895
200.0054270.0460.4817
210.0712950.6050.273555
22-0.213212-1.80920.0373
230.2577762.18730.015984
24-0.058571-0.4970.310355
25-0.036312-0.30810.379442
260.0339010.28770.387218
27-0.012537-0.10640.457789
28-0.132892-1.12760.131611
29-0.067755-0.57490.28357
300.050340.42720.335271
310.04060.34450.365738
32-0.157351-1.33520.093014
330.0507280.43040.334081
34-0.089212-0.7570.225764
350.0136540.11590.454045
36-0.064533-0.54760.292838
370.0752290.63830.26264
380.0266940.22650.410724
390.0333680.28310.388943
40-0.072277-0.61330.270809
41-0.107384-0.91120.182619
420.0129230.10970.456494
430.0315910.26810.394711
44-0.006909-0.05860.476707
45-0.05979-0.50730.306735
460.0727610.61740.269461
470.0620980.52690.299934
48-0.098916-0.83930.202031
49-0.002068-0.01750.493024
50-0.039166-0.33230.3703
510.0176820.150.440578
52-0.097973-0.83130.204268
53-0.008215-0.06970.472311
54-0.006732-0.05710.477302
55-0.019506-0.16550.434502
56-0.068301-0.57960.282012
570.0695310.590.278521
58-0.105975-0.89920.185764
590.0251190.21310.415911
60-0.104852-0.88970.188296

\begin{tabular}{lllllllll}
\hline
Partial Autocorrelation Function \tabularnewline
Time lag k & PACF(k) & T-STAT & P-value \tabularnewline
1 & -0.551753 & -4.6818 & 7e-06 \tabularnewline
2 & -0.439888 & -3.7326 & 0.000188 \tabularnewline
3 & 0.155795 & 1.322 & 0.095183 \tabularnewline
4 & 0.109326 & 0.9277 & 0.178341 \tabularnewline
5 & -0.158847 & -1.3479 & 0.090964 \tabularnewline
6 & 0.042593 & 0.3614 & 0.359423 \tabularnewline
7 & -0.102603 & -0.8706 & 0.193429 \tabularnewline
8 & -0.224195 & -1.9024 & 0.030562 \tabularnewline
9 & 0.144635 & 1.2273 & 0.111859 \tabularnewline
10 & 0.097911 & 0.8308 & 0.204416 \tabularnewline
11 & -0.048322 & -0.41 & 0.341502 \tabularnewline
12 & -0.180043 & -1.5277 & 0.065482 \tabularnewline
13 & -0.280274 & -2.3782 & 0.010027 \tabularnewline
14 & -0.116543 & -0.9889 & 0.163011 \tabularnewline
15 & -0.00589 & -0.05 & 0.480138 \tabularnewline
16 & -0.086318 & -0.7324 & 0.233142 \tabularnewline
17 & -0.141348 & -1.1994 & 0.117157 \tabularnewline
18 & 0.134441 & 1.1408 & 0.128873 \tabularnewline
19 & 0.191918 & 1.6285 & 0.053895 \tabularnewline
20 & 0.005427 & 0.046 & 0.4817 \tabularnewline
21 & 0.071295 & 0.605 & 0.273555 \tabularnewline
22 & -0.213212 & -1.8092 & 0.0373 \tabularnewline
23 & 0.257776 & 2.1873 & 0.015984 \tabularnewline
24 & -0.058571 & -0.497 & 0.310355 \tabularnewline
25 & -0.036312 & -0.3081 & 0.379442 \tabularnewline
26 & 0.033901 & 0.2877 & 0.387218 \tabularnewline
27 & -0.012537 & -0.1064 & 0.457789 \tabularnewline
28 & -0.132892 & -1.1276 & 0.131611 \tabularnewline
29 & -0.067755 & -0.5749 & 0.28357 \tabularnewline
30 & 0.05034 & 0.4272 & 0.335271 \tabularnewline
31 & 0.0406 & 0.3445 & 0.365738 \tabularnewline
32 & -0.157351 & -1.3352 & 0.093014 \tabularnewline
33 & 0.050728 & 0.4304 & 0.334081 \tabularnewline
34 & -0.089212 & -0.757 & 0.225764 \tabularnewline
35 & 0.013654 & 0.1159 & 0.454045 \tabularnewline
36 & -0.064533 & -0.5476 & 0.292838 \tabularnewline
37 & 0.075229 & 0.6383 & 0.26264 \tabularnewline
38 & 0.026694 & 0.2265 & 0.410724 \tabularnewline
39 & 0.033368 & 0.2831 & 0.388943 \tabularnewline
40 & -0.072277 & -0.6133 & 0.270809 \tabularnewline
41 & -0.107384 & -0.9112 & 0.182619 \tabularnewline
42 & 0.012923 & 0.1097 & 0.456494 \tabularnewline
43 & 0.031591 & 0.2681 & 0.394711 \tabularnewline
44 & -0.006909 & -0.0586 & 0.476707 \tabularnewline
45 & -0.05979 & -0.5073 & 0.306735 \tabularnewline
46 & 0.072761 & 0.6174 & 0.269461 \tabularnewline
47 & 0.062098 & 0.5269 & 0.299934 \tabularnewline
48 & -0.098916 & -0.8393 & 0.202031 \tabularnewline
49 & -0.002068 & -0.0175 & 0.493024 \tabularnewline
50 & -0.039166 & -0.3323 & 0.3703 \tabularnewline
51 & 0.017682 & 0.15 & 0.440578 \tabularnewline
52 & -0.097973 & -0.8313 & 0.204268 \tabularnewline
53 & -0.008215 & -0.0697 & 0.472311 \tabularnewline
54 & -0.006732 & -0.0571 & 0.477302 \tabularnewline
55 & -0.019506 & -0.1655 & 0.434502 \tabularnewline
56 & -0.068301 & -0.5796 & 0.282012 \tabularnewline
57 & 0.069531 & 0.59 & 0.278521 \tabularnewline
58 & -0.105975 & -0.8992 & 0.185764 \tabularnewline
59 & 0.025119 & 0.2131 & 0.415911 \tabularnewline
60 & -0.104852 & -0.8897 & 0.188296 \tabularnewline
\hline
\end{tabular}
%Source: https://freestatistics.org/blog/index.php?pk=30787&T=2

[TABLE]
[ROW][C]Partial Autocorrelation Function[/C][/ROW]
[ROW][C]Time lag k[/C][C]PACF(k)[/C][C]T-STAT[/C][C]P-value[/C][/ROW]
[ROW][C]1[/C][C]-0.551753[/C][C]-4.6818[/C][C]7e-06[/C][/ROW]
[ROW][C]2[/C][C]-0.439888[/C][C]-3.7326[/C][C]0.000188[/C][/ROW]
[ROW][C]3[/C][C]0.155795[/C][C]1.322[/C][C]0.095183[/C][/ROW]
[ROW][C]4[/C][C]0.109326[/C][C]0.9277[/C][C]0.178341[/C][/ROW]
[ROW][C]5[/C][C]-0.158847[/C][C]-1.3479[/C][C]0.090964[/C][/ROW]
[ROW][C]6[/C][C]0.042593[/C][C]0.3614[/C][C]0.359423[/C][/ROW]
[ROW][C]7[/C][C]-0.102603[/C][C]-0.8706[/C][C]0.193429[/C][/ROW]
[ROW][C]8[/C][C]-0.224195[/C][C]-1.9024[/C][C]0.030562[/C][/ROW]
[ROW][C]9[/C][C]0.144635[/C][C]1.2273[/C][C]0.111859[/C][/ROW]
[ROW][C]10[/C][C]0.097911[/C][C]0.8308[/C][C]0.204416[/C][/ROW]
[ROW][C]11[/C][C]-0.048322[/C][C]-0.41[/C][C]0.341502[/C][/ROW]
[ROW][C]12[/C][C]-0.180043[/C][C]-1.5277[/C][C]0.065482[/C][/ROW]
[ROW][C]13[/C][C]-0.280274[/C][C]-2.3782[/C][C]0.010027[/C][/ROW]
[ROW][C]14[/C][C]-0.116543[/C][C]-0.9889[/C][C]0.163011[/C][/ROW]
[ROW][C]15[/C][C]-0.00589[/C][C]-0.05[/C][C]0.480138[/C][/ROW]
[ROW][C]16[/C][C]-0.086318[/C][C]-0.7324[/C][C]0.233142[/C][/ROW]
[ROW][C]17[/C][C]-0.141348[/C][C]-1.1994[/C][C]0.117157[/C][/ROW]
[ROW][C]18[/C][C]0.134441[/C][C]1.1408[/C][C]0.128873[/C][/ROW]
[ROW][C]19[/C][C]0.191918[/C][C]1.6285[/C][C]0.053895[/C][/ROW]
[ROW][C]20[/C][C]0.005427[/C][C]0.046[/C][C]0.4817[/C][/ROW]
[ROW][C]21[/C][C]0.071295[/C][C]0.605[/C][C]0.273555[/C][/ROW]
[ROW][C]22[/C][C]-0.213212[/C][C]-1.8092[/C][C]0.0373[/C][/ROW]
[ROW][C]23[/C][C]0.257776[/C][C]2.1873[/C][C]0.015984[/C][/ROW]
[ROW][C]24[/C][C]-0.058571[/C][C]-0.497[/C][C]0.310355[/C][/ROW]
[ROW][C]25[/C][C]-0.036312[/C][C]-0.3081[/C][C]0.379442[/C][/ROW]
[ROW][C]26[/C][C]0.033901[/C][C]0.2877[/C][C]0.387218[/C][/ROW]
[ROW][C]27[/C][C]-0.012537[/C][C]-0.1064[/C][C]0.457789[/C][/ROW]
[ROW][C]28[/C][C]-0.132892[/C][C]-1.1276[/C][C]0.131611[/C][/ROW]
[ROW][C]29[/C][C]-0.067755[/C][C]-0.5749[/C][C]0.28357[/C][/ROW]
[ROW][C]30[/C][C]0.05034[/C][C]0.4272[/C][C]0.335271[/C][/ROW]
[ROW][C]31[/C][C]0.0406[/C][C]0.3445[/C][C]0.365738[/C][/ROW]
[ROW][C]32[/C][C]-0.157351[/C][C]-1.3352[/C][C]0.093014[/C][/ROW]
[ROW][C]33[/C][C]0.050728[/C][C]0.4304[/C][C]0.334081[/C][/ROW]
[ROW][C]34[/C][C]-0.089212[/C][C]-0.757[/C][C]0.225764[/C][/ROW]
[ROW][C]35[/C][C]0.013654[/C][C]0.1159[/C][C]0.454045[/C][/ROW]
[ROW][C]36[/C][C]-0.064533[/C][C]-0.5476[/C][C]0.292838[/C][/ROW]
[ROW][C]37[/C][C]0.075229[/C][C]0.6383[/C][C]0.26264[/C][/ROW]
[ROW][C]38[/C][C]0.026694[/C][C]0.2265[/C][C]0.410724[/C][/ROW]
[ROW][C]39[/C][C]0.033368[/C][C]0.2831[/C][C]0.388943[/C][/ROW]
[ROW][C]40[/C][C]-0.072277[/C][C]-0.6133[/C][C]0.270809[/C][/ROW]
[ROW][C]41[/C][C]-0.107384[/C][C]-0.9112[/C][C]0.182619[/C][/ROW]
[ROW][C]42[/C][C]0.012923[/C][C]0.1097[/C][C]0.456494[/C][/ROW]
[ROW][C]43[/C][C]0.031591[/C][C]0.2681[/C][C]0.394711[/C][/ROW]
[ROW][C]44[/C][C]-0.006909[/C][C]-0.0586[/C][C]0.476707[/C][/ROW]
[ROW][C]45[/C][C]-0.05979[/C][C]-0.5073[/C][C]0.306735[/C][/ROW]
[ROW][C]46[/C][C]0.072761[/C][C]0.6174[/C][C]0.269461[/C][/ROW]
[ROW][C]47[/C][C]0.062098[/C][C]0.5269[/C][C]0.299934[/C][/ROW]
[ROW][C]48[/C][C]-0.098916[/C][C]-0.8393[/C][C]0.202031[/C][/ROW]
[ROW][C]49[/C][C]-0.002068[/C][C]-0.0175[/C][C]0.493024[/C][/ROW]
[ROW][C]50[/C][C]-0.039166[/C][C]-0.3323[/C][C]0.3703[/C][/ROW]
[ROW][C]51[/C][C]0.017682[/C][C]0.15[/C][C]0.440578[/C][/ROW]
[ROW][C]52[/C][C]-0.097973[/C][C]-0.8313[/C][C]0.204268[/C][/ROW]
[ROW][C]53[/C][C]-0.008215[/C][C]-0.0697[/C][C]0.472311[/C][/ROW]
[ROW][C]54[/C][C]-0.006732[/C][C]-0.0571[/C][C]0.477302[/C][/ROW]
[ROW][C]55[/C][C]-0.019506[/C][C]-0.1655[/C][C]0.434502[/C][/ROW]
[ROW][C]56[/C][C]-0.068301[/C][C]-0.5796[/C][C]0.282012[/C][/ROW]
[ROW][C]57[/C][C]0.069531[/C][C]0.59[/C][C]0.278521[/C][/ROW]
[ROW][C]58[/C][C]-0.105975[/C][C]-0.8992[/C][C]0.185764[/C][/ROW]
[ROW][C]59[/C][C]0.025119[/C][C]0.2131[/C][C]0.415911[/C][/ROW]
[ROW][C]60[/C][C]-0.104852[/C][C]-0.8897[/C][C]0.188296[/C][/ROW]
[/TABLE]
Source: https://freestatistics.org/blog/index.php?pk=30787&T=2

Globally Unique Identifier (entire table): ba.freestatistics.org/blog/index.php?pk=30787&T=2

As an alternative you can also use a QR Code:  

The GUIDs for individual cells are displayed in the table below:

Partial Autocorrelation Function
Time lag kPACF(k)T-STATP-value
1-0.551753-4.68187e-06
2-0.439888-3.73260.000188
30.1557951.3220.095183
40.1093260.92770.178341
5-0.158847-1.34790.090964
60.0425930.36140.359423
7-0.102603-0.87060.193429
8-0.224195-1.90240.030562
90.1446351.22730.111859
100.0979110.83080.204416
11-0.048322-0.410.341502
12-0.180043-1.52770.065482
13-0.280274-2.37820.010027
14-0.116543-0.98890.163011
15-0.00589-0.050.480138
16-0.086318-0.73240.233142
17-0.141348-1.19940.117157
180.1344411.14080.128873
190.1919181.62850.053895
200.0054270.0460.4817
210.0712950.6050.273555
22-0.213212-1.80920.0373
230.2577762.18730.015984
24-0.058571-0.4970.310355
25-0.036312-0.30810.379442
260.0339010.28770.387218
27-0.012537-0.10640.457789
28-0.132892-1.12760.131611
29-0.067755-0.57490.28357
300.050340.42720.335271
310.04060.34450.365738
32-0.157351-1.33520.093014
330.0507280.43040.334081
34-0.089212-0.7570.225764
350.0136540.11590.454045
36-0.064533-0.54760.292838
370.0752290.63830.26264
380.0266940.22650.410724
390.0333680.28310.388943
40-0.072277-0.61330.270809
41-0.107384-0.91120.182619
420.0129230.10970.456494
430.0315910.26810.394711
44-0.006909-0.05860.476707
45-0.05979-0.50730.306735
460.0727610.61740.269461
470.0620980.52690.299934
48-0.098916-0.83930.202031
49-0.002068-0.01750.493024
50-0.039166-0.33230.3703
510.0176820.150.440578
52-0.097973-0.83130.204268
53-0.008215-0.06970.472311
54-0.006732-0.05710.477302
55-0.019506-0.16550.434502
56-0.068301-0.57960.282012
570.0695310.590.278521
58-0.105975-0.89920.185764
590.0251190.21310.415911
60-0.104852-0.88970.188296


Parameters (Session):
par1 = 60 ; par2 = -1.0 ; par3 = 1 ; par4 = 1 ; par5 = 12 ;
Parameters (R input):
par1 = 60 ; par2 = -1.0 ; par3 = 1 ; par4 = 1 ; par5 = 12 ;
R code (references can be found in the software module):
if (par1 == 'Default') {
par1 = 10*log10(length(x))
} else {
par1 <- as.numeric(par1)
}
par2 <- as.numeric(par2)
par3 <- as.numeric(par3)
par4 <- as.numeric(par4)
par5 <- as.numeric(par5)
if (par2 == 0) {
x <- log(x)
} else {
x <- (x ^ par2 - 1) / par2
}
if (par3 > 0) x <- diff(x,lag=1,difference=par3)
if (par4 > 0) x <- diff(x,lag=par5,difference=par4)
bitmap(file='pic1.png')
racf <- acf(x,par1,main='Autocorrelation',xlab='lags',ylab='ACF')
dev.off()
bitmap(file='pic2.png')
rpacf <- pacf(x,par1,main='Partial Autocorrelation',xlab='lags',ylab='PACF')
dev.off()
(myacf <- c(racf$acf))
(mypacf <- c(rpacf$acf))
lengthx <- length(x)
sqrtn <- sqrt(lengthx)
load(file='createtable')
a<-table.start()
a<-table.row.start(a)
a<-table.element(a,'Autocorrelation Function',4,TRUE)
a<-table.row.end(a)
a<-table.row.start(a)
a<-table.element(a,'Time lag k',header=TRUE)
a<-table.element(a,hyperlink('basics.htm','ACF(k)','click here for more information about the Autocorrelation Function'),header=TRUE)
a<-table.element(a,'T-STAT',header=TRUE)
a<-table.element(a,'P-value',header=TRUE)
a<-table.row.end(a)
for (i in 2:(par1+1)) {
a<-table.row.start(a)
a<-table.element(a,i-1,header=TRUE)
a<-table.element(a,round(myacf[i],6))
mytstat <- myacf[i]*sqrtn
a<-table.element(a,round(mytstat,4))
a<-table.element(a,round(1-pt(abs(mytstat),lengthx),6))
a<-table.row.end(a)
}
a<-table.end(a)
table.save(a,file='mytable.tab')
a<-table.start()
a<-table.row.start(a)
a<-table.element(a,'Partial Autocorrelation Function',4,TRUE)
a<-table.row.end(a)
a<-table.row.start(a)
a<-table.element(a,'Time lag k',header=TRUE)
a<-table.element(a,hyperlink('basics.htm','PACF(k)','click here for more information about the Partial Autocorrelation Function'),header=TRUE)
a<-table.element(a,'T-STAT',header=TRUE)
a<-table.element(a,'P-value',header=TRUE)
a<-table.row.end(a)
for (i in 1:par1) {
a<-table.row.start(a)
a<-table.element(a,i,header=TRUE)
a<-table.element(a,round(mypacf[i],6))
mytstat <- mypacf[i]*sqrtn
a<-table.element(a,round(mytstat,4))
a<-table.element(a,round(1-pt(abs(mytstat),lengthx),6))
a<-table.row.end(a)
}
a<-table.end(a)
table.save(a,file='mytable1.tab')