Free Statistics

of Irreproducible Research!

Author's title

Author*The author of this computation has been verified*
R Software Modulerwasp_spectrum.wasp
Title produced by softwareSpectral Analysis
Date of computationMon, 08 Dec 2008 12:05:17 -0700
Cite this page as followsStatistical Computations at FreeStatistics.org, Office for Research Development and Education, URL https://freestatistics.org/blog/index.php?v=date/2008/Dec/08/t1228763158czcv23hgme3lp8l.htm/, Retrieved Thu, 16 May 2024 13:25:01 +0000
Statistical Computations at FreeStatistics.org, Office for Research Development and Education, URL https://freestatistics.org/blog/index.php?pk=30736, Retrieved Thu, 16 May 2024 13:25:01 +0000
QR Codes:

Original text written by user:
IsPrivate?No (this computation is public)
User-defined keywords
Estimated Impact156
Family? (F = Feedback message, R = changed R code, M = changed R Module, P = changed Parameters, D = changed Data)
-     [Univariate Data Series] [data set] [2008-12-01 19:54:57] [b98453cac15ba1066b407e146608df68]
F RMPD    [Spectral Analysis] [S2 - SA] [2008-12-08 19:05:17] [5f3e73ccf1ddc75508eed47fa51813d3] [Current]
Feedback Forum
2008-12-14 12:54:24 [Jeroen Michel] [reply
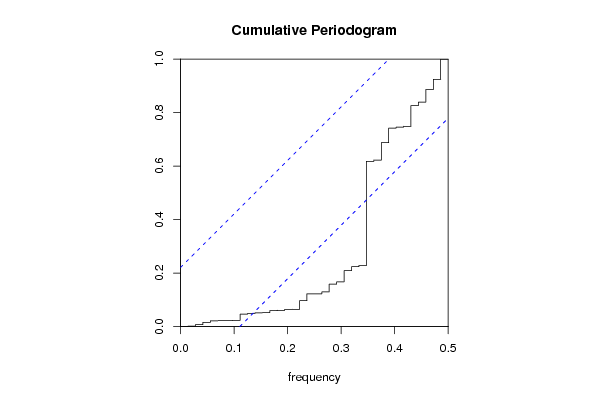
Zoals de student stelt is er met voorgaande grafiek/berekening wel een gelijkaardig patroon op te tekenen, maar de LT-trend en seizoenaliteit zijn eruit gefilterd waardoor we kleinere treden opmerken op de grafiek.
2008-12-14 14:27:45 [Nathalie Koulouris] [reply
De student heeft deze vraag opnieuw correct opgelost en geeft telkens een goede toelichting.

Post a new message
Dataseries X:
14897
13063
12604
13630
14421
13978
12928
13430
13470
14786
14292
14309
14013
13241
12153
14290
15669
14170
14570
14469
14265
15321
14434
13692
14194
13519
11858
14616
15643
14077
14888
14160
14643
17193
15386
14287
17527
14497
14398
16630
16671
16615
16869
15664
16360
18448
16889
16505
18321
15052
15700
18135
16769
18883
19021
18102
17776
21490
17065
18690
18953
16399
16896
18553
19270
19422
17579
18637
18077
20439
18075
19563
19899
19228
17790
19221
22059
21231
19504
23913
23166
23574
25002
22604
23409


Summary of computational transaction
Raw Inputview raw input (R code)
Raw Outputview raw output of R engine
Computing time3 seconds
R Server'Herman Ole Andreas Wold' @ 193.190.124.10:1001

\begin{tabular}{lllllllll}
\hline
Summary of computational transaction \tabularnewline
Raw Input & view raw input (R code)  \tabularnewline
Raw Output & view raw output of R engine  \tabularnewline
Computing time & 3 seconds \tabularnewline
R Server & 'Herman Ole Andreas Wold' @ 193.190.124.10:1001 \tabularnewline
\hline
\end{tabular}
%Source: https://freestatistics.org/blog/index.php?pk=30736&T=0

[TABLE]
[ROW][C]Summary of computational transaction[/C][/ROW]
[ROW][C]Raw Input[/C][C]view raw input (R code) [/C][/ROW]
[ROW][C]Raw Output[/C][C]view raw output of R engine [/C][/ROW]
[ROW][C]Computing time[/C][C]3 seconds[/C][/ROW]
[ROW][C]R Server[/C][C]'Herman Ole Andreas Wold' @ 193.190.124.10:1001[/C][/ROW]
[/TABLE]
Source: https://freestatistics.org/blog/index.php?pk=30736&T=0

Globally Unique Identifier (entire table): ba.freestatistics.org/blog/index.php?pk=30736&T=0

As an alternative you can also use a QR Code:  

The GUIDs for individual cells are displayed in the table below:

Summary of computational transaction
Raw Inputview raw input (R code)
Raw Outputview raw output of R engine
Computing time3 seconds
R Server'Herman Ole Andreas Wold' @ 193.190.124.10:1001


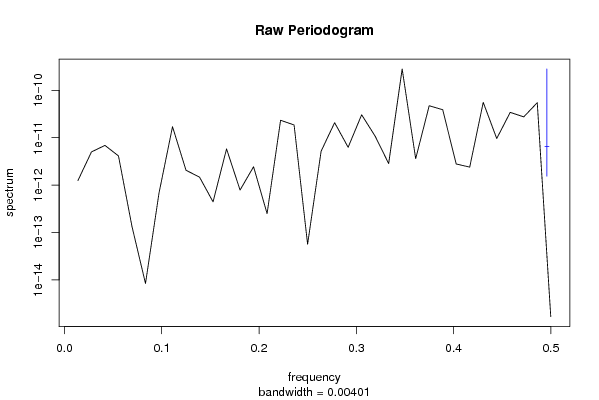
Raw Periodogram
ParameterValue
Box-Cox transformation parameter (lambda)-1
Degree of non-seasonal differencing (d)1
Degree of seasonal differencing (D)1
Seasonal Period (s)12
Frequency (Period)Spectrum
0.0139 (72)0
0.0278 (36)0
0.0417 (24)0
0.0556 (18)0
0.0694 (14.4)0
0.0833 (12)0
0.0972 (10.2857)0
0.1111 (9)0
0.125 (8)0
0.1389 (7.2)0
0.1528 (6.5455)0
0.1667 (6)0
0.1806 (5.5385)0
0.1944 (5.1429)0
0.2083 (4.8)0
0.2222 (4.5)0
0.2361 (4.2353)0
0.25 (4)0
0.2639 (3.7895)0
0.2778 (3.6)0
0.2917 (3.4286)0
0.3056 (3.2727)0
0.3194 (3.1304)0
0.3333 (3)0
0.3472 (2.88)0
0.3611 (2.7692)0
0.375 (2.6667)0
0.3889 (2.5714)0
0.4028 (2.4828)0
0.4167 (2.4)0
0.4306 (2.3226)0
0.4444 (2.25)0
0.4583 (2.1818)0
0.4722 (2.1176)0
0.4861 (2.0571)0
0.5 (2)0

\begin{tabular}{lllllllll}
\hline
Raw Periodogram \tabularnewline
Parameter & Value \tabularnewline
Box-Cox transformation parameter (lambda) & -1 \tabularnewline
Degree of non-seasonal differencing (d) & 1 \tabularnewline
Degree of seasonal differencing (D) & 1 \tabularnewline
Seasonal Period (s) & 12 \tabularnewline
Frequency (Period) & Spectrum \tabularnewline
0.0139 (72) & 0 \tabularnewline
0.0278 (36) & 0 \tabularnewline
0.0417 (24) & 0 \tabularnewline
0.0556 (18) & 0 \tabularnewline
0.0694 (14.4) & 0 \tabularnewline
0.0833 (12) & 0 \tabularnewline
0.0972 (10.2857) & 0 \tabularnewline
0.1111 (9) & 0 \tabularnewline
0.125 (8) & 0 \tabularnewline
0.1389 (7.2) & 0 \tabularnewline
0.1528 (6.5455) & 0 \tabularnewline
0.1667 (6) & 0 \tabularnewline
0.1806 (5.5385) & 0 \tabularnewline
0.1944 (5.1429) & 0 \tabularnewline
0.2083 (4.8) & 0 \tabularnewline
0.2222 (4.5) & 0 \tabularnewline
0.2361 (4.2353) & 0 \tabularnewline
0.25 (4) & 0 \tabularnewline
0.2639 (3.7895) & 0 \tabularnewline
0.2778 (3.6) & 0 \tabularnewline
0.2917 (3.4286) & 0 \tabularnewline
0.3056 (3.2727) & 0 \tabularnewline
0.3194 (3.1304) & 0 \tabularnewline
0.3333 (3) & 0 \tabularnewline
0.3472 (2.88) & 0 \tabularnewline
0.3611 (2.7692) & 0 \tabularnewline
0.375 (2.6667) & 0 \tabularnewline
0.3889 (2.5714) & 0 \tabularnewline
0.4028 (2.4828) & 0 \tabularnewline
0.4167 (2.4) & 0 \tabularnewline
0.4306 (2.3226) & 0 \tabularnewline
0.4444 (2.25) & 0 \tabularnewline
0.4583 (2.1818) & 0 \tabularnewline
0.4722 (2.1176) & 0 \tabularnewline
0.4861 (2.0571) & 0 \tabularnewline
0.5 (2) & 0 \tabularnewline
\hline
\end{tabular}
%Source: https://freestatistics.org/blog/index.php?pk=30736&T=1

[TABLE]
[ROW][C]Raw Periodogram[/C][/ROW]
[ROW][C]Parameter[/C][C]Value[/C][/ROW]
[ROW][C]Box-Cox transformation parameter (lambda)[/C][C]-1[/C][/ROW]
[ROW][C]Degree of non-seasonal differencing (d)[/C][C]1[/C][/ROW]
[ROW][C]Degree of seasonal differencing (D)[/C][C]1[/C][/ROW]
[ROW][C]Seasonal Period (s)[/C][C]12[/C][/ROW]
[ROW][C]Frequency (Period)[/C][C]Spectrum[/C][/ROW]
[ROW][C]0.0139 (72)[/C][C]0[/C][/ROW]
[ROW][C]0.0278 (36)[/C][C]0[/C][/ROW]
[ROW][C]0.0417 (24)[/C][C]0[/C][/ROW]
[ROW][C]0.0556 (18)[/C][C]0[/C][/ROW]
[ROW][C]0.0694 (14.4)[/C][C]0[/C][/ROW]
[ROW][C]0.0833 (12)[/C][C]0[/C][/ROW]
[ROW][C]0.0972 (10.2857)[/C][C]0[/C][/ROW]
[ROW][C]0.1111 (9)[/C][C]0[/C][/ROW]
[ROW][C]0.125 (8)[/C][C]0[/C][/ROW]
[ROW][C]0.1389 (7.2)[/C][C]0[/C][/ROW]
[ROW][C]0.1528 (6.5455)[/C][C]0[/C][/ROW]
[ROW][C]0.1667 (6)[/C][C]0[/C][/ROW]
[ROW][C]0.1806 (5.5385)[/C][C]0[/C][/ROW]
[ROW][C]0.1944 (5.1429)[/C][C]0[/C][/ROW]
[ROW][C]0.2083 (4.8)[/C][C]0[/C][/ROW]
[ROW][C]0.2222 (4.5)[/C][C]0[/C][/ROW]
[ROW][C]0.2361 (4.2353)[/C][C]0[/C][/ROW]
[ROW][C]0.25 (4)[/C][C]0[/C][/ROW]
[ROW][C]0.2639 (3.7895)[/C][C]0[/C][/ROW]
[ROW][C]0.2778 (3.6)[/C][C]0[/C][/ROW]
[ROW][C]0.2917 (3.4286)[/C][C]0[/C][/ROW]
[ROW][C]0.3056 (3.2727)[/C][C]0[/C][/ROW]
[ROW][C]0.3194 (3.1304)[/C][C]0[/C][/ROW]
[ROW][C]0.3333 (3)[/C][C]0[/C][/ROW]
[ROW][C]0.3472 (2.88)[/C][C]0[/C][/ROW]
[ROW][C]0.3611 (2.7692)[/C][C]0[/C][/ROW]
[ROW][C]0.375 (2.6667)[/C][C]0[/C][/ROW]
[ROW][C]0.3889 (2.5714)[/C][C]0[/C][/ROW]
[ROW][C]0.4028 (2.4828)[/C][C]0[/C][/ROW]
[ROW][C]0.4167 (2.4)[/C][C]0[/C][/ROW]
[ROW][C]0.4306 (2.3226)[/C][C]0[/C][/ROW]
[ROW][C]0.4444 (2.25)[/C][C]0[/C][/ROW]
[ROW][C]0.4583 (2.1818)[/C][C]0[/C][/ROW]
[ROW][C]0.4722 (2.1176)[/C][C]0[/C][/ROW]
[ROW][C]0.4861 (2.0571)[/C][C]0[/C][/ROW]
[ROW][C]0.5 (2)[/C][C]0[/C][/ROW]
[/TABLE]
Source: https://freestatistics.org/blog/index.php?pk=30736&T=1

Globally Unique Identifier (entire table): ba.freestatistics.org/blog/index.php?pk=30736&T=1

As an alternative you can also use a QR Code:  

The GUIDs for individual cells are displayed in the table below:

Raw Periodogram
ParameterValue
Box-Cox transformation parameter (lambda)-1
Degree of non-seasonal differencing (d)1
Degree of seasonal differencing (D)1
Seasonal Period (s)12
Frequency (Period)Spectrum
0.0139 (72)0
0.0278 (36)0
0.0417 (24)0
0.0556 (18)0
0.0694 (14.4)0
0.0833 (12)0
0.0972 (10.2857)0
0.1111 (9)0
0.125 (8)0
0.1389 (7.2)0
0.1528 (6.5455)0
0.1667 (6)0
0.1806 (5.5385)0
0.1944 (5.1429)0
0.2083 (4.8)0
0.2222 (4.5)0
0.2361 (4.2353)0
0.25 (4)0
0.2639 (3.7895)0
0.2778 (3.6)0
0.2917 (3.4286)0
0.3056 (3.2727)0
0.3194 (3.1304)0
0.3333 (3)0
0.3472 (2.88)0
0.3611 (2.7692)0
0.375 (2.6667)0
0.3889 (2.5714)0
0.4028 (2.4828)0
0.4167 (2.4)0
0.4306 (2.3226)0
0.4444 (2.25)0
0.4583 (2.1818)0
0.4722 (2.1176)0
0.4861 (2.0571)0
0.5 (2)0


Parameters (Session):
par1 = -1.0 ; par2 = 1 ; par3 = 1 ; par4 = 12 ;
Parameters (R input):
par1 = -1.0 ; par2 = 1 ; par3 = 1 ; par4 = 12 ;
R code (references can be found in the software module):
par1 <- as.numeric(par1)
par2 <- as.numeric(par2)
par3 <- as.numeric(par3)
par4 <- as.numeric(par4)
if (par1 == 0) {
x <- log(x)
} else {
x <- (x ^ par1 - 1) / par1
}
if (par2 > 0) x <- diff(x,lag=1,difference=par2)
if (par3 > 0) x <- diff(x,lag=par4,difference=par3)
bitmap(file='test1.png')
r <- spectrum(x,main='Raw Periodogram')
dev.off()
bitmap(file='test2.png')
cpgram(x,main='Cumulative Periodogram')
dev.off()
load(file='createtable')
a<-table.start()
a<-table.row.start(a)
a<-table.element(a,'Raw Periodogram',2,TRUE)
a<-table.row.end(a)
a<-table.row.start(a)
a<-table.element(a,'Parameter',header=TRUE)
a<-table.element(a,'Value',header=TRUE)
a<-table.row.end(a)
a<-table.row.start(a)
a<-table.element(a,'Box-Cox transformation parameter (lambda)',header=TRUE)
a<-table.element(a,par1)
a<-table.row.end(a)
a<-table.row.start(a)
a<-table.element(a,'Degree of non-seasonal differencing (d)',header=TRUE)
a<-table.element(a,par2)
a<-table.row.end(a)
a<-table.row.start(a)
a<-table.element(a,'Degree of seasonal differencing (D)',header=TRUE)
a<-table.element(a,par3)
a<-table.row.end(a)
a<-table.row.start(a)
a<-table.element(a,'Seasonal Period (s)',header=TRUE)
a<-table.element(a,par4)
a<-table.row.end(a)
a<-table.row.start(a)
a<-table.element(a,'Frequency (Period)',header=TRUE)
a<-table.element(a,'Spectrum',header=TRUE)
a<-table.row.end(a)
for (i in 1:length(r$freq)) {
a<-table.row.start(a)
mylab <- round(r$freq[i],4)
mylab <- paste(mylab,' (',sep='')
mylab <- paste(mylab,round(1/r$freq[i],4),sep='')
mylab <- paste(mylab,')',sep='')
a<-table.element(a,mylab,header=TRUE)
a<-table.element(a,round(r$spec[i],6))
a<-table.row.end(a)
}
a<-table.end(a)
table.save(a,file='mytable.tab')