Free Statistics

of Irreproducible Research!

Author's title

Author*The author of this computation has been verified*
R Software Modulerwasp_autocorrelation.wasp
Title produced by software(Partial) Autocorrelation Function
Date of computationMon, 08 Dec 2008 12:00:39 -0700
Cite this page as followsStatistical Computations at FreeStatistics.org, Office for Research Development and Education, URL https://freestatistics.org/blog/index.php?v=date/2008/Dec/08/t1228762908lxv0dwi6iqojpbo.htm/, Retrieved Thu, 16 May 2024 03:54:52 +0000
Statistical Computations at FreeStatistics.org, Office for Research Development and Education, URL https://freestatistics.org/blog/index.php?pk=30726, Retrieved Thu, 16 May 2024 03:54:52 +0000
QR Codes:

Original text written by user:
IsPrivate?No (this computation is public)
User-defined keywords
Estimated Impact192
Family? (F = Feedback message, R = changed R code, M = changed R Module, P = changed Parameters, D = changed Data)
F     [(Partial) Autocorrelation Function] [Unemployment - St...] [2008-12-08 17:24:07] [57850c80fd59ccfb28f882be994e814e]
F         [(Partial) Autocorrelation Function] [STEP 2 5] [2008-12-08 19:00:39] [e11d930c9e2984715c66c796cf63ef19] [Current]
Feedback Forum
2008-12-11 13:46:52 [72e979bcc364082694890d2eccc1a66f] [reply
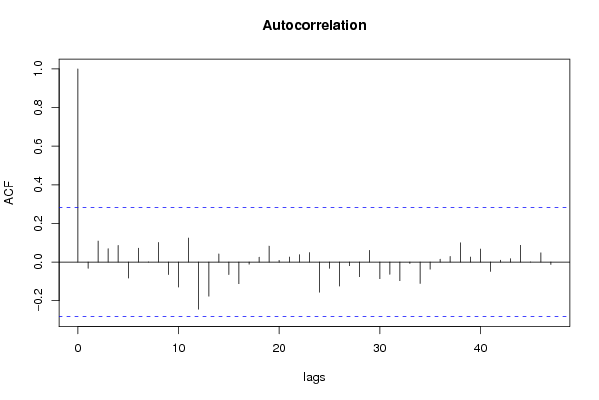
Ik denk dat hieruit af te leiden valt dat er helemaal geen MA proces is maar wel een AR proces. Namelijk als we bij de Autocorrelation Function aan het staafje op lag 1 trekken bekomen we een herkenbare figuur van een AR proces. Het staafje op lag 0 mogen we buiten beschouwing laten.
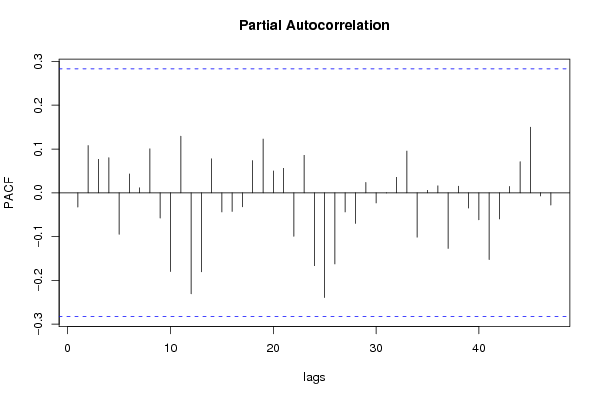
In de Partiële autocorrelatie functie vind ik niet onmiddellijk een herkenbare figuur voor een MA proces.
2008-12-13 21:56:41 [Li Tang Hu] [reply
hoe heb je je processen gevonden??? vergeet niet te kijken naar de theoretische patronen om processen te identificeren...
2008-12-14 10:55:01 [94a54c888ac7f7d6874c3108eb0e1808] [reply
Om een AR proces te herkennen, moet gekeken worden naar de autocorrelation. Daar moet een dalend patroon in te herkennen zijn. Dat hier niet aanwezig is.
Het is een ar 2 proces. Nu moet er alleen nog gezocht worden het type AR proces. Hiervoor moet gekeken worden naar PACF en moet het aantal significante streepjes gesteld worden. Men mag aan het eerste streepje trekken zodat men een AR 1 proces heeft. Met andere woorden, p=1. Gezien er geen seizonaliteit meer is, mogen we P gelijkstellen aan 0.
2008-12-14 11:35:53 [Matthieu Blondeau] [reply
Ik vind het vrij moeilijk om op deze grafieken een proces te identificeren. Vooral als men naar de ARIMA Backward kijkt, blijkbaar is de P=2 terwijl dit moeilijk te zien is op de grafiek.
2008-12-14 14:17:38 [Stéphanie Claes] [reply
We gaan kijken naar de eerste 5 coefficienten (de allereerste wordt steeds buiten beschouwing gelaten) van de autocorrelatie grafiek om te bepalen of we te maken hebben met een AR proces. Als we de eerste coefficient iets langer maken dan zien we dat we een patroon kunnen herkennen dat overeenstemt met het model van een AR proces. Om de orde van dit proces te bepalen gaan we naar de Partiele autocorrelatie functie kijken. We zien hierbij dat geen enkele van de coefficienten significant is, dus p = 0.

We onderzoeken of er een seizonaal AR proces aanwezig is, we kijken hiervoor naar de autocorrelatie en we kijken naar de coefficienten 12, 24 en 36. Geen enkele van deze vallen buiten het betrouwbaarheidsinterval. Dus we kunnen besluiten dat er geen sprake is van seizonaliteit. Bijgevolg: P = 0

We herkennen wel een patroon van een MA proces (we bekijken de eerste 4-5 coefficienten van de partial autocorrelatie) proces maar geen enkele coefficient is significant (er steekt niks boven het betrouwbaarheidsinterval) waardoor er geen orde kan bepaald worden en bijgevolg q = 0.

Tenslotte bekijken we lag 12, 24, 36,.. van de partial autocorrelatie om te kijken of er een seizonaal MA proces aanwezig is. We zien deze 12, 24, 36 allen negatief zijn, maar er is geen enkele coefficient significant waardoor we dus geen orde kunnen toekennen. Q = 0
2008-12-15 12:57:59 [Toon Wouters] [reply
Bij deze stap was het de bedoeling om de berekende autocorrelatie grafieken te vergelijken met de theoretische autocorrelatie grafieken om patronen van AR, MA, SAR en SMA-processen vast te stellen.
2008-12-16 13:32:08 [Roel Geudens] [reply
verkeerd begrepen van de student. Je moest alles vergelijken met de theorie. De patronen die we gebruikt hebben voor ARMA processen staan op de site en had je dus moeten gebruiken.

Post a new message
Dataseries X:
569323
579714
577992
565464
547344
554788
562325
560854
555332
543599
536662
542722
593530
610763
612613
611324
594167
595454
590865
589379
584428
573100
567456
569028
620735
628884
628232
612117
595404
597141
593408
590072
579799
574205
572775
572942
619567
625809
619916
587625
565742
557274
560576
548854
531673
525919
511038
498662
555362
564591
541657
527070
509846
514258
516922
507561
492622
490243
469357
477580
528379


Summary of computational transaction
Raw Inputview raw input (R code)
Raw Outputview raw output of R engine
Computing time3 seconds
R Server'Herman Ole Andreas Wold' @ 193.190.124.10:1001

\begin{tabular}{lllllllll}
\hline
Summary of computational transaction \tabularnewline
Raw Input & view raw input (R code)  \tabularnewline
Raw Output & view raw output of R engine  \tabularnewline
Computing time & 3 seconds \tabularnewline
R Server & 'Herman Ole Andreas Wold' @ 193.190.124.10:1001 \tabularnewline
\hline
\end{tabular}
%Source: https://freestatistics.org/blog/index.php?pk=30726&T=0

[TABLE]
[ROW][C]Summary of computational transaction[/C][/ROW]
[ROW][C]Raw Input[/C][C]view raw input (R code) [/C][/ROW]
[ROW][C]Raw Output[/C][C]view raw output of R engine [/C][/ROW]
[ROW][C]Computing time[/C][C]3 seconds[/C][/ROW]
[ROW][C]R Server[/C][C]'Herman Ole Andreas Wold' @ 193.190.124.10:1001[/C][/ROW]
[/TABLE]
Source: https://freestatistics.org/blog/index.php?pk=30726&T=0

Globally Unique Identifier (entire table): ba.freestatistics.org/blog/index.php?pk=30726&T=0

As an alternative you can also use a QR Code:  

The GUIDs for individual cells are displayed in the table below:

Summary of computational transaction
Raw Inputview raw input (R code)
Raw Outputview raw output of R engine
Computing time3 seconds
R Server'Herman Ole Andreas Wold' @ 193.190.124.10:1001


Autocorrelation Function
Time lag kACF(k)T-STATP-value
1-0.032649-0.22620.411003
20.1088690.75430.227187
30.0689410.47760.317537
40.085670.59350.277805
5-0.083167-0.57620.283587
60.0714790.49520.311353
70.0004760.00330.498691
80.1014370.70280.242794
9-0.065158-0.45140.326857
10-0.129362-0.89620.187297
110.1243070.86120.196698
12-0.244521-1.69410.048364
13-0.176681-1.22410.113448
140.0417180.2890.386901
15-0.064746-0.44860.327878
16-0.111943-0.77560.220905
17-0.011344-0.07860.468841
180.0249620.17290.431711
190.0824210.5710.285321
200.0085790.05940.476426
210.0257290.17830.429636
220.0378750.26240.397067
230.0490270.33970.367793
24-0.156029-1.0810.14255
25-0.032462-0.22490.411505
26-0.12445-0.86220.196428
27-0.018942-0.13120.44807
28-0.076081-0.52710.300275
290.0603970.41840.338745
30-0.086405-0.59860.276116
31-0.063762-0.44180.330325
32-0.096929-0.67150.252547
33-0.007116-0.04930.480442
34-0.110626-0.76640.223584
35-0.037085-0.25690.399164
360.0145050.10050.460186
370.0291230.20180.420473
380.0998710.69190.246159
390.025540.17690.430149
400.0669150.46360.322514
41-0.048419-0.33550.36937
420.0097340.06740.473257
430.0175530.12160.451857
440.0865230.59950.275846
450.0006260.00430.498278
460.0478970.33180.370728
47-0.012297-0.08520.466229
48NANANA
49NANANA
50NANANA
51NANANA
52NANANA
53NANANA
54NANANA
55NANANA
56NANANA
57NANANA
58NANANA
59NANANA
60NANANA

\begin{tabular}{lllllllll}
\hline
Autocorrelation Function \tabularnewline
Time lag k & ACF(k) & T-STAT & P-value \tabularnewline
1 & -0.032649 & -0.2262 & 0.411003 \tabularnewline
2 & 0.108869 & 0.7543 & 0.227187 \tabularnewline
3 & 0.068941 & 0.4776 & 0.317537 \tabularnewline
4 & 0.08567 & 0.5935 & 0.277805 \tabularnewline
5 & -0.083167 & -0.5762 & 0.283587 \tabularnewline
6 & 0.071479 & 0.4952 & 0.311353 \tabularnewline
7 & 0.000476 & 0.0033 & 0.498691 \tabularnewline
8 & 0.101437 & 0.7028 & 0.242794 \tabularnewline
9 & -0.065158 & -0.4514 & 0.326857 \tabularnewline
10 & -0.129362 & -0.8962 & 0.187297 \tabularnewline
11 & 0.124307 & 0.8612 & 0.196698 \tabularnewline
12 & -0.244521 & -1.6941 & 0.048364 \tabularnewline
13 & -0.176681 & -1.2241 & 0.113448 \tabularnewline
14 & 0.041718 & 0.289 & 0.386901 \tabularnewline
15 & -0.064746 & -0.4486 & 0.327878 \tabularnewline
16 & -0.111943 & -0.7756 & 0.220905 \tabularnewline
17 & -0.011344 & -0.0786 & 0.468841 \tabularnewline
18 & 0.024962 & 0.1729 & 0.431711 \tabularnewline
19 & 0.082421 & 0.571 & 0.285321 \tabularnewline
20 & 0.008579 & 0.0594 & 0.476426 \tabularnewline
21 & 0.025729 & 0.1783 & 0.429636 \tabularnewline
22 & 0.037875 & 0.2624 & 0.397067 \tabularnewline
23 & 0.049027 & 0.3397 & 0.367793 \tabularnewline
24 & -0.156029 & -1.081 & 0.14255 \tabularnewline
25 & -0.032462 & -0.2249 & 0.411505 \tabularnewline
26 & -0.12445 & -0.8622 & 0.196428 \tabularnewline
27 & -0.018942 & -0.1312 & 0.44807 \tabularnewline
28 & -0.076081 & -0.5271 & 0.300275 \tabularnewline
29 & 0.060397 & 0.4184 & 0.338745 \tabularnewline
30 & -0.086405 & -0.5986 & 0.276116 \tabularnewline
31 & -0.063762 & -0.4418 & 0.330325 \tabularnewline
32 & -0.096929 & -0.6715 & 0.252547 \tabularnewline
33 & -0.007116 & -0.0493 & 0.480442 \tabularnewline
34 & -0.110626 & -0.7664 & 0.223584 \tabularnewline
35 & -0.037085 & -0.2569 & 0.399164 \tabularnewline
36 & 0.014505 & 0.1005 & 0.460186 \tabularnewline
37 & 0.029123 & 0.2018 & 0.420473 \tabularnewline
38 & 0.099871 & 0.6919 & 0.246159 \tabularnewline
39 & 0.02554 & 0.1769 & 0.430149 \tabularnewline
40 & 0.066915 & 0.4636 & 0.322514 \tabularnewline
41 & -0.048419 & -0.3355 & 0.36937 \tabularnewline
42 & 0.009734 & 0.0674 & 0.473257 \tabularnewline
43 & 0.017553 & 0.1216 & 0.451857 \tabularnewline
44 & 0.086523 & 0.5995 & 0.275846 \tabularnewline
45 & 0.000626 & 0.0043 & 0.498278 \tabularnewline
46 & 0.047897 & 0.3318 & 0.370728 \tabularnewline
47 & -0.012297 & -0.0852 & 0.466229 \tabularnewline
48 & NA & NA & NA \tabularnewline
49 & NA & NA & NA \tabularnewline
50 & NA & NA & NA \tabularnewline
51 & NA & NA & NA \tabularnewline
52 & NA & NA & NA \tabularnewline
53 & NA & NA & NA \tabularnewline
54 & NA & NA & NA \tabularnewline
55 & NA & NA & NA \tabularnewline
56 & NA & NA & NA \tabularnewline
57 & NA & NA & NA \tabularnewline
58 & NA & NA & NA \tabularnewline
59 & NA & NA & NA \tabularnewline
60 & NA & NA & NA \tabularnewline
\hline
\end{tabular}
%Source: https://freestatistics.org/blog/index.php?pk=30726&T=1

[TABLE]
[ROW][C]Autocorrelation Function[/C][/ROW]
[ROW][C]Time lag k[/C][C]ACF(k)[/C][C]T-STAT[/C][C]P-value[/C][/ROW]
[ROW][C]1[/C][C]-0.032649[/C][C]-0.2262[/C][C]0.411003[/C][/ROW]
[ROW][C]2[/C][C]0.108869[/C][C]0.7543[/C][C]0.227187[/C][/ROW]
[ROW][C]3[/C][C]0.068941[/C][C]0.4776[/C][C]0.317537[/C][/ROW]
[ROW][C]4[/C][C]0.08567[/C][C]0.5935[/C][C]0.277805[/C][/ROW]
[ROW][C]5[/C][C]-0.083167[/C][C]-0.5762[/C][C]0.283587[/C][/ROW]
[ROW][C]6[/C][C]0.071479[/C][C]0.4952[/C][C]0.311353[/C][/ROW]
[ROW][C]7[/C][C]0.000476[/C][C]0.0033[/C][C]0.498691[/C][/ROW]
[ROW][C]8[/C][C]0.101437[/C][C]0.7028[/C][C]0.242794[/C][/ROW]
[ROW][C]9[/C][C]-0.065158[/C][C]-0.4514[/C][C]0.326857[/C][/ROW]
[ROW][C]10[/C][C]-0.129362[/C][C]-0.8962[/C][C]0.187297[/C][/ROW]
[ROW][C]11[/C][C]0.124307[/C][C]0.8612[/C][C]0.196698[/C][/ROW]
[ROW][C]12[/C][C]-0.244521[/C][C]-1.6941[/C][C]0.048364[/C][/ROW]
[ROW][C]13[/C][C]-0.176681[/C][C]-1.2241[/C][C]0.113448[/C][/ROW]
[ROW][C]14[/C][C]0.041718[/C][C]0.289[/C][C]0.386901[/C][/ROW]
[ROW][C]15[/C][C]-0.064746[/C][C]-0.4486[/C][C]0.327878[/C][/ROW]
[ROW][C]16[/C][C]-0.111943[/C][C]-0.7756[/C][C]0.220905[/C][/ROW]
[ROW][C]17[/C][C]-0.011344[/C][C]-0.0786[/C][C]0.468841[/C][/ROW]
[ROW][C]18[/C][C]0.024962[/C][C]0.1729[/C][C]0.431711[/C][/ROW]
[ROW][C]19[/C][C]0.082421[/C][C]0.571[/C][C]0.285321[/C][/ROW]
[ROW][C]20[/C][C]0.008579[/C][C]0.0594[/C][C]0.476426[/C][/ROW]
[ROW][C]21[/C][C]0.025729[/C][C]0.1783[/C][C]0.429636[/C][/ROW]
[ROW][C]22[/C][C]0.037875[/C][C]0.2624[/C][C]0.397067[/C][/ROW]
[ROW][C]23[/C][C]0.049027[/C][C]0.3397[/C][C]0.367793[/C][/ROW]
[ROW][C]24[/C][C]-0.156029[/C][C]-1.081[/C][C]0.14255[/C][/ROW]
[ROW][C]25[/C][C]-0.032462[/C][C]-0.2249[/C][C]0.411505[/C][/ROW]
[ROW][C]26[/C][C]-0.12445[/C][C]-0.8622[/C][C]0.196428[/C][/ROW]
[ROW][C]27[/C][C]-0.018942[/C][C]-0.1312[/C][C]0.44807[/C][/ROW]
[ROW][C]28[/C][C]-0.076081[/C][C]-0.5271[/C][C]0.300275[/C][/ROW]
[ROW][C]29[/C][C]0.060397[/C][C]0.4184[/C][C]0.338745[/C][/ROW]
[ROW][C]30[/C][C]-0.086405[/C][C]-0.5986[/C][C]0.276116[/C][/ROW]
[ROW][C]31[/C][C]-0.063762[/C][C]-0.4418[/C][C]0.330325[/C][/ROW]
[ROW][C]32[/C][C]-0.096929[/C][C]-0.6715[/C][C]0.252547[/C][/ROW]
[ROW][C]33[/C][C]-0.007116[/C][C]-0.0493[/C][C]0.480442[/C][/ROW]
[ROW][C]34[/C][C]-0.110626[/C][C]-0.7664[/C][C]0.223584[/C][/ROW]
[ROW][C]35[/C][C]-0.037085[/C][C]-0.2569[/C][C]0.399164[/C][/ROW]
[ROW][C]36[/C][C]0.014505[/C][C]0.1005[/C][C]0.460186[/C][/ROW]
[ROW][C]37[/C][C]0.029123[/C][C]0.2018[/C][C]0.420473[/C][/ROW]
[ROW][C]38[/C][C]0.099871[/C][C]0.6919[/C][C]0.246159[/C][/ROW]
[ROW][C]39[/C][C]0.02554[/C][C]0.1769[/C][C]0.430149[/C][/ROW]
[ROW][C]40[/C][C]0.066915[/C][C]0.4636[/C][C]0.322514[/C][/ROW]
[ROW][C]41[/C][C]-0.048419[/C][C]-0.3355[/C][C]0.36937[/C][/ROW]
[ROW][C]42[/C][C]0.009734[/C][C]0.0674[/C][C]0.473257[/C][/ROW]
[ROW][C]43[/C][C]0.017553[/C][C]0.1216[/C][C]0.451857[/C][/ROW]
[ROW][C]44[/C][C]0.086523[/C][C]0.5995[/C][C]0.275846[/C][/ROW]
[ROW][C]45[/C][C]0.000626[/C][C]0.0043[/C][C]0.498278[/C][/ROW]
[ROW][C]46[/C][C]0.047897[/C][C]0.3318[/C][C]0.370728[/C][/ROW]
[ROW][C]47[/C][C]-0.012297[/C][C]-0.0852[/C][C]0.466229[/C][/ROW]
[ROW][C]48[/C][C]NA[/C][C]NA[/C][C]NA[/C][/ROW]
[ROW][C]49[/C][C]NA[/C][C]NA[/C][C]NA[/C][/ROW]
[ROW][C]50[/C][C]NA[/C][C]NA[/C][C]NA[/C][/ROW]
[ROW][C]51[/C][C]NA[/C][C]NA[/C][C]NA[/C][/ROW]
[ROW][C]52[/C][C]NA[/C][C]NA[/C][C]NA[/C][/ROW]
[ROW][C]53[/C][C]NA[/C][C]NA[/C][C]NA[/C][/ROW]
[ROW][C]54[/C][C]NA[/C][C]NA[/C][C]NA[/C][/ROW]
[ROW][C]55[/C][C]NA[/C][C]NA[/C][C]NA[/C][/ROW]
[ROW][C]56[/C][C]NA[/C][C]NA[/C][C]NA[/C][/ROW]
[ROW][C]57[/C][C]NA[/C][C]NA[/C][C]NA[/C][/ROW]
[ROW][C]58[/C][C]NA[/C][C]NA[/C][C]NA[/C][/ROW]
[ROW][C]59[/C][C]NA[/C][C]NA[/C][C]NA[/C][/ROW]
[ROW][C]60[/C][C]NA[/C][C]NA[/C][C]NA[/C][/ROW]
[/TABLE]
Source: https://freestatistics.org/blog/index.php?pk=30726&T=1

Globally Unique Identifier (entire table): ba.freestatistics.org/blog/index.php?pk=30726&T=1

As an alternative you can also use a QR Code:  

The GUIDs for individual cells are displayed in the table below:

Autocorrelation Function
Time lag kACF(k)T-STATP-value
1-0.032649-0.22620.411003
20.1088690.75430.227187
30.0689410.47760.317537
40.085670.59350.277805
5-0.083167-0.57620.283587
60.0714790.49520.311353
70.0004760.00330.498691
80.1014370.70280.242794
9-0.065158-0.45140.326857
10-0.129362-0.89620.187297
110.1243070.86120.196698
12-0.244521-1.69410.048364
13-0.176681-1.22410.113448
140.0417180.2890.386901
15-0.064746-0.44860.327878
16-0.111943-0.77560.220905
17-0.011344-0.07860.468841
180.0249620.17290.431711
190.0824210.5710.285321
200.0085790.05940.476426
210.0257290.17830.429636
220.0378750.26240.397067
230.0490270.33970.367793
24-0.156029-1.0810.14255
25-0.032462-0.22490.411505
26-0.12445-0.86220.196428
27-0.018942-0.13120.44807
28-0.076081-0.52710.300275
290.0603970.41840.338745
30-0.086405-0.59860.276116
31-0.063762-0.44180.330325
32-0.096929-0.67150.252547
33-0.007116-0.04930.480442
34-0.110626-0.76640.223584
35-0.037085-0.25690.399164
360.0145050.10050.460186
370.0291230.20180.420473
380.0998710.69190.246159
390.025540.17690.430149
400.0669150.46360.322514
41-0.048419-0.33550.36937
420.0097340.06740.473257
430.0175530.12160.451857
440.0865230.59950.275846
450.0006260.00430.498278
460.0478970.33180.370728
47-0.012297-0.08520.466229
48NANANA
49NANANA
50NANANA
51NANANA
52NANANA
53NANANA
54NANANA
55NANANA
56NANANA
57NANANA
58NANANA
59NANANA
60NANANA


Partial Autocorrelation Function
Time lag kPACF(k)T-STATP-value
1-0.032649-0.22620.411003
20.1079180.74770.229151
30.0766090.53080.299016
40.0802410.55590.290422
5-0.094821-0.65690.257178
60.0430780.29850.383322
70.0112550.0780.469086
80.1005480.69660.244702
9-0.057603-0.39910.345801
10-0.180042-1.24740.109157
110.129420.89660.18719
12-0.230675-1.59820.058285
13-0.180375-1.24970.108739
140.0777830.53890.296225
15-0.043663-0.30250.381788
16-0.042599-0.29510.384582
17-0.03208-0.22230.412529
180.073510.50930.306441
190.1228450.85110.199471
200.0499330.34590.365449
210.0559330.38750.350043
22-0.099469-0.68910.247027
230.0856440.59340.277863
24-0.166417-1.1530.127316
25-0.239277-1.65780.051944
26-0.162507-1.12590.132906
27-0.043742-0.30310.381581
28-0.069949-0.48460.315076
290.0235540.16320.435528
30-0.023114-0.16010.436722
31-0.000188-0.00130.499483
320.0353850.24520.403691
330.0954530.66130.255785
34-0.101352-0.70220.242977
350.0057160.03960.484287
360.0160580.11130.45594
37-0.127025-0.88010.191607
380.0151180.10470.458509
39-0.034978-0.24230.404777
40-0.061777-0.4280.335282
41-0.152455-1.05620.148073
42-0.059722-0.41380.340443
430.014550.10080.460063
440.0709960.49190.312524
450.1498861.03840.152133
46-0.007089-0.04910.480515
47-0.027885-0.19320.423811
48NANANA
49NANANA
50NANANA
51NANANA
52NANANA
53NANANA
54NANANA
55NANANA
56NANANA
57NANANA
58NANANA
59NANANA
60NANANA

\begin{tabular}{lllllllll}
\hline
Partial Autocorrelation Function \tabularnewline
Time lag k & PACF(k) & T-STAT & P-value \tabularnewline
1 & -0.032649 & -0.2262 & 0.411003 \tabularnewline
2 & 0.107918 & 0.7477 & 0.229151 \tabularnewline
3 & 0.076609 & 0.5308 & 0.299016 \tabularnewline
4 & 0.080241 & 0.5559 & 0.290422 \tabularnewline
5 & -0.094821 & -0.6569 & 0.257178 \tabularnewline
6 & 0.043078 & 0.2985 & 0.383322 \tabularnewline
7 & 0.011255 & 0.078 & 0.469086 \tabularnewline
8 & 0.100548 & 0.6966 & 0.244702 \tabularnewline
9 & -0.057603 & -0.3991 & 0.345801 \tabularnewline
10 & -0.180042 & -1.2474 & 0.109157 \tabularnewline
11 & 0.12942 & 0.8966 & 0.18719 \tabularnewline
12 & -0.230675 & -1.5982 & 0.058285 \tabularnewline
13 & -0.180375 & -1.2497 & 0.108739 \tabularnewline
14 & 0.077783 & 0.5389 & 0.296225 \tabularnewline
15 & -0.043663 & -0.3025 & 0.381788 \tabularnewline
16 & -0.042599 & -0.2951 & 0.384582 \tabularnewline
17 & -0.03208 & -0.2223 & 0.412529 \tabularnewline
18 & 0.07351 & 0.5093 & 0.306441 \tabularnewline
19 & 0.122845 & 0.8511 & 0.199471 \tabularnewline
20 & 0.049933 & 0.3459 & 0.365449 \tabularnewline
21 & 0.055933 & 0.3875 & 0.350043 \tabularnewline
22 & -0.099469 & -0.6891 & 0.247027 \tabularnewline
23 & 0.085644 & 0.5934 & 0.277863 \tabularnewline
24 & -0.166417 & -1.153 & 0.127316 \tabularnewline
25 & -0.239277 & -1.6578 & 0.051944 \tabularnewline
26 & -0.162507 & -1.1259 & 0.132906 \tabularnewline
27 & -0.043742 & -0.3031 & 0.381581 \tabularnewline
28 & -0.069949 & -0.4846 & 0.315076 \tabularnewline
29 & 0.023554 & 0.1632 & 0.435528 \tabularnewline
30 & -0.023114 & -0.1601 & 0.436722 \tabularnewline
31 & -0.000188 & -0.0013 & 0.499483 \tabularnewline
32 & 0.035385 & 0.2452 & 0.403691 \tabularnewline
33 & 0.095453 & 0.6613 & 0.255785 \tabularnewline
34 & -0.101352 & -0.7022 & 0.242977 \tabularnewline
35 & 0.005716 & 0.0396 & 0.484287 \tabularnewline
36 & 0.016058 & 0.1113 & 0.45594 \tabularnewline
37 & -0.127025 & -0.8801 & 0.191607 \tabularnewline
38 & 0.015118 & 0.1047 & 0.458509 \tabularnewline
39 & -0.034978 & -0.2423 & 0.404777 \tabularnewline
40 & -0.061777 & -0.428 & 0.335282 \tabularnewline
41 & -0.152455 & -1.0562 & 0.148073 \tabularnewline
42 & -0.059722 & -0.4138 & 0.340443 \tabularnewline
43 & 0.01455 & 0.1008 & 0.460063 \tabularnewline
44 & 0.070996 & 0.4919 & 0.312524 \tabularnewline
45 & 0.149886 & 1.0384 & 0.152133 \tabularnewline
46 & -0.007089 & -0.0491 & 0.480515 \tabularnewline
47 & -0.027885 & -0.1932 & 0.423811 \tabularnewline
48 & NA & NA & NA \tabularnewline
49 & NA & NA & NA \tabularnewline
50 & NA & NA & NA \tabularnewline
51 & NA & NA & NA \tabularnewline
52 & NA & NA & NA \tabularnewline
53 & NA & NA & NA \tabularnewline
54 & NA & NA & NA \tabularnewline
55 & NA & NA & NA \tabularnewline
56 & NA & NA & NA \tabularnewline
57 & NA & NA & NA \tabularnewline
58 & NA & NA & NA \tabularnewline
59 & NA & NA & NA \tabularnewline
60 & NA & NA & NA \tabularnewline
\hline
\end{tabular}
%Source: https://freestatistics.org/blog/index.php?pk=30726&T=2

[TABLE]
[ROW][C]Partial Autocorrelation Function[/C][/ROW]
[ROW][C]Time lag k[/C][C]PACF(k)[/C][C]T-STAT[/C][C]P-value[/C][/ROW]
[ROW][C]1[/C][C]-0.032649[/C][C]-0.2262[/C][C]0.411003[/C][/ROW]
[ROW][C]2[/C][C]0.107918[/C][C]0.7477[/C][C]0.229151[/C][/ROW]
[ROW][C]3[/C][C]0.076609[/C][C]0.5308[/C][C]0.299016[/C][/ROW]
[ROW][C]4[/C][C]0.080241[/C][C]0.5559[/C][C]0.290422[/C][/ROW]
[ROW][C]5[/C][C]-0.094821[/C][C]-0.6569[/C][C]0.257178[/C][/ROW]
[ROW][C]6[/C][C]0.043078[/C][C]0.2985[/C][C]0.383322[/C][/ROW]
[ROW][C]7[/C][C]0.011255[/C][C]0.078[/C][C]0.469086[/C][/ROW]
[ROW][C]8[/C][C]0.100548[/C][C]0.6966[/C][C]0.244702[/C][/ROW]
[ROW][C]9[/C][C]-0.057603[/C][C]-0.3991[/C][C]0.345801[/C][/ROW]
[ROW][C]10[/C][C]-0.180042[/C][C]-1.2474[/C][C]0.109157[/C][/ROW]
[ROW][C]11[/C][C]0.12942[/C][C]0.8966[/C][C]0.18719[/C][/ROW]
[ROW][C]12[/C][C]-0.230675[/C][C]-1.5982[/C][C]0.058285[/C][/ROW]
[ROW][C]13[/C][C]-0.180375[/C][C]-1.2497[/C][C]0.108739[/C][/ROW]
[ROW][C]14[/C][C]0.077783[/C][C]0.5389[/C][C]0.296225[/C][/ROW]
[ROW][C]15[/C][C]-0.043663[/C][C]-0.3025[/C][C]0.381788[/C][/ROW]
[ROW][C]16[/C][C]-0.042599[/C][C]-0.2951[/C][C]0.384582[/C][/ROW]
[ROW][C]17[/C][C]-0.03208[/C][C]-0.2223[/C][C]0.412529[/C][/ROW]
[ROW][C]18[/C][C]0.07351[/C][C]0.5093[/C][C]0.306441[/C][/ROW]
[ROW][C]19[/C][C]0.122845[/C][C]0.8511[/C][C]0.199471[/C][/ROW]
[ROW][C]20[/C][C]0.049933[/C][C]0.3459[/C][C]0.365449[/C][/ROW]
[ROW][C]21[/C][C]0.055933[/C][C]0.3875[/C][C]0.350043[/C][/ROW]
[ROW][C]22[/C][C]-0.099469[/C][C]-0.6891[/C][C]0.247027[/C][/ROW]
[ROW][C]23[/C][C]0.085644[/C][C]0.5934[/C][C]0.277863[/C][/ROW]
[ROW][C]24[/C][C]-0.166417[/C][C]-1.153[/C][C]0.127316[/C][/ROW]
[ROW][C]25[/C][C]-0.239277[/C][C]-1.6578[/C][C]0.051944[/C][/ROW]
[ROW][C]26[/C][C]-0.162507[/C][C]-1.1259[/C][C]0.132906[/C][/ROW]
[ROW][C]27[/C][C]-0.043742[/C][C]-0.3031[/C][C]0.381581[/C][/ROW]
[ROW][C]28[/C][C]-0.069949[/C][C]-0.4846[/C][C]0.315076[/C][/ROW]
[ROW][C]29[/C][C]0.023554[/C][C]0.1632[/C][C]0.435528[/C][/ROW]
[ROW][C]30[/C][C]-0.023114[/C][C]-0.1601[/C][C]0.436722[/C][/ROW]
[ROW][C]31[/C][C]-0.000188[/C][C]-0.0013[/C][C]0.499483[/C][/ROW]
[ROW][C]32[/C][C]0.035385[/C][C]0.2452[/C][C]0.403691[/C][/ROW]
[ROW][C]33[/C][C]0.095453[/C][C]0.6613[/C][C]0.255785[/C][/ROW]
[ROW][C]34[/C][C]-0.101352[/C][C]-0.7022[/C][C]0.242977[/C][/ROW]
[ROW][C]35[/C][C]0.005716[/C][C]0.0396[/C][C]0.484287[/C][/ROW]
[ROW][C]36[/C][C]0.016058[/C][C]0.1113[/C][C]0.45594[/C][/ROW]
[ROW][C]37[/C][C]-0.127025[/C][C]-0.8801[/C][C]0.191607[/C][/ROW]
[ROW][C]38[/C][C]0.015118[/C][C]0.1047[/C][C]0.458509[/C][/ROW]
[ROW][C]39[/C][C]-0.034978[/C][C]-0.2423[/C][C]0.404777[/C][/ROW]
[ROW][C]40[/C][C]-0.061777[/C][C]-0.428[/C][C]0.335282[/C][/ROW]
[ROW][C]41[/C][C]-0.152455[/C][C]-1.0562[/C][C]0.148073[/C][/ROW]
[ROW][C]42[/C][C]-0.059722[/C][C]-0.4138[/C][C]0.340443[/C][/ROW]
[ROW][C]43[/C][C]0.01455[/C][C]0.1008[/C][C]0.460063[/C][/ROW]
[ROW][C]44[/C][C]0.070996[/C][C]0.4919[/C][C]0.312524[/C][/ROW]
[ROW][C]45[/C][C]0.149886[/C][C]1.0384[/C][C]0.152133[/C][/ROW]
[ROW][C]46[/C][C]-0.007089[/C][C]-0.0491[/C][C]0.480515[/C][/ROW]
[ROW][C]47[/C][C]-0.027885[/C][C]-0.1932[/C][C]0.423811[/C][/ROW]
[ROW][C]48[/C][C]NA[/C][C]NA[/C][C]NA[/C][/ROW]
[ROW][C]49[/C][C]NA[/C][C]NA[/C][C]NA[/C][/ROW]
[ROW][C]50[/C][C]NA[/C][C]NA[/C][C]NA[/C][/ROW]
[ROW][C]51[/C][C]NA[/C][C]NA[/C][C]NA[/C][/ROW]
[ROW][C]52[/C][C]NA[/C][C]NA[/C][C]NA[/C][/ROW]
[ROW][C]53[/C][C]NA[/C][C]NA[/C][C]NA[/C][/ROW]
[ROW][C]54[/C][C]NA[/C][C]NA[/C][C]NA[/C][/ROW]
[ROW][C]55[/C][C]NA[/C][C]NA[/C][C]NA[/C][/ROW]
[ROW][C]56[/C][C]NA[/C][C]NA[/C][C]NA[/C][/ROW]
[ROW][C]57[/C][C]NA[/C][C]NA[/C][C]NA[/C][/ROW]
[ROW][C]58[/C][C]NA[/C][C]NA[/C][C]NA[/C][/ROW]
[ROW][C]59[/C][C]NA[/C][C]NA[/C][C]NA[/C][/ROW]
[ROW][C]60[/C][C]NA[/C][C]NA[/C][C]NA[/C][/ROW]
[/TABLE]
Source: https://freestatistics.org/blog/index.php?pk=30726&T=2

Globally Unique Identifier (entire table): ba.freestatistics.org/blog/index.php?pk=30726&T=2

As an alternative you can also use a QR Code:  

The GUIDs for individual cells are displayed in the table below:

Partial Autocorrelation Function
Time lag kPACF(k)T-STATP-value
1-0.032649-0.22620.411003
20.1079180.74770.229151
30.0766090.53080.299016
40.0802410.55590.290422
5-0.094821-0.65690.257178
60.0430780.29850.383322
70.0112550.0780.469086
80.1005480.69660.244702
9-0.057603-0.39910.345801
10-0.180042-1.24740.109157
110.129420.89660.18719
12-0.230675-1.59820.058285
13-0.180375-1.24970.108739
140.0777830.53890.296225
15-0.043663-0.30250.381788
16-0.042599-0.29510.384582
17-0.03208-0.22230.412529
180.073510.50930.306441
190.1228450.85110.199471
200.0499330.34590.365449
210.0559330.38750.350043
22-0.099469-0.68910.247027
230.0856440.59340.277863
24-0.166417-1.1530.127316
25-0.239277-1.65780.051944
26-0.162507-1.12590.132906
27-0.043742-0.30310.381581
28-0.069949-0.48460.315076
290.0235540.16320.435528
30-0.023114-0.16010.436722
31-0.000188-0.00130.499483
320.0353850.24520.403691
330.0954530.66130.255785
34-0.101352-0.70220.242977
350.0057160.03960.484287
360.0160580.11130.45594
37-0.127025-0.88010.191607
380.0151180.10470.458509
39-0.034978-0.24230.404777
40-0.061777-0.4280.335282
41-0.152455-1.05620.148073
42-0.059722-0.41380.340443
430.014550.10080.460063
440.0709960.49190.312524
450.1498861.03840.152133
46-0.007089-0.04910.480515
47-0.027885-0.19320.423811
48NANANA
49NANANA
50NANANA
51NANANA
52NANANA
53NANANA
54NANANA
55NANANA
56NANANA
57NANANA
58NANANA
59NANANA
60NANANA


Parameters (Session):
par1 = 60 ; par2 = 1 ; par3 = 1 ; par4 = 1 ; par5 = 12 ;
Parameters (R input):
par1 = 60 ; par2 = 1 ; par3 = 1 ; par4 = 1 ; par5 = 12 ; par6 = ; par7 = ; par8 = ; par9 = ; par10 = ; par11 = ; par12 = ; par13 = ; par14 = ; par15 = ; par16 = ; par17 = ; par18 = ; par19 = ; par20 = ;
R code (references can be found in the software module):
if (par1 == 'Default') {
par1 = 10*log10(length(x))
} else {
par1 <- as.numeric(par1)
}
par2 <- as.numeric(par2)
par3 <- as.numeric(par3)
par4 <- as.numeric(par4)
par5 <- as.numeric(par5)
if (par2 == 0) {
x <- log(x)
} else {
x <- (x ^ par2 - 1) / par2
}
if (par3 > 0) x <- diff(x,lag=1,difference=par3)
if (par4 > 0) x <- diff(x,lag=par5,difference=par4)
bitmap(file='pic1.png')
racf <- acf(x,par1,main='Autocorrelation',xlab='lags',ylab='ACF')
dev.off()
bitmap(file='pic2.png')
rpacf <- pacf(x,par1,main='Partial Autocorrelation',xlab='lags',ylab='PACF')
dev.off()
(myacf <- c(racf$acf))
(mypacf <- c(rpacf$acf))
lengthx <- length(x)
sqrtn <- sqrt(lengthx)
load(file='createtable')
a<-table.start()
a<-table.row.start(a)
a<-table.element(a,'Autocorrelation Function',4,TRUE)
a<-table.row.end(a)
a<-table.row.start(a)
a<-table.element(a,'Time lag k',header=TRUE)
a<-table.element(a,hyperlink('basics.htm','ACF(k)','click here for more information about the Autocorrelation Function'),header=TRUE)
a<-table.element(a,'T-STAT',header=TRUE)
a<-table.element(a,'P-value',header=TRUE)
a<-table.row.end(a)
for (i in 2:(par1+1)) {
a<-table.row.start(a)
a<-table.element(a,i-1,header=TRUE)
a<-table.element(a,round(myacf[i],6))
mytstat <- myacf[i]*sqrtn
a<-table.element(a,round(mytstat,4))
a<-table.element(a,round(1-pt(abs(mytstat),lengthx),6))
a<-table.row.end(a)
}
a<-table.end(a)
table.save(a,file='mytable.tab')
a<-table.start()
a<-table.row.start(a)
a<-table.element(a,'Partial Autocorrelation Function',4,TRUE)
a<-table.row.end(a)
a<-table.row.start(a)
a<-table.element(a,'Time lag k',header=TRUE)
a<-table.element(a,hyperlink('basics.htm','PACF(k)','click here for more information about the Partial Autocorrelation Function'),header=TRUE)
a<-table.element(a,'T-STAT',header=TRUE)
a<-table.element(a,'P-value',header=TRUE)
a<-table.row.end(a)
for (i in 1:par1) {
a<-table.row.start(a)
a<-table.element(a,i,header=TRUE)
a<-table.element(a,round(mypacf[i],6))
mytstat <- mypacf[i]*sqrtn
a<-table.element(a,round(mytstat,4))
a<-table.element(a,round(1-pt(abs(mytstat),lengthx),6))
a<-table.row.end(a)
}
a<-table.end(a)
table.save(a,file='mytable1.tab')