Free Statistics

of Irreproducible Research!

Author's title

Author*The author of this computation has been verified*
R Software Modulerwasp_autocorrelation.wasp
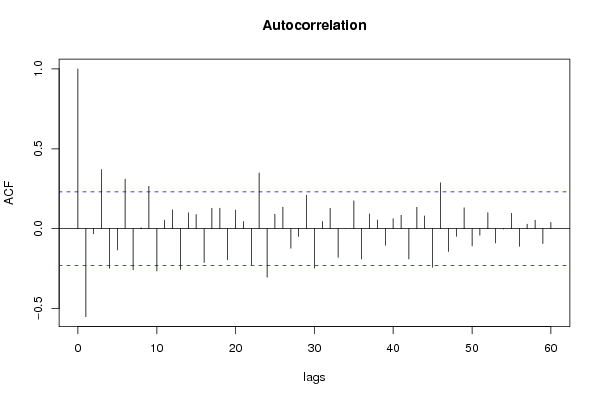
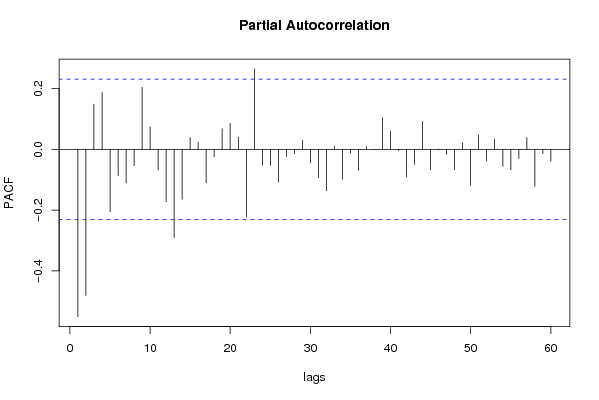
Title produced by software(Partial) Autocorrelation Function
Date of computationMon, 08 Dec 2008 11:59:57 -0700
Cite this page as followsStatistical Computations at FreeStatistics.org, Office for Research Development and Education, URL https://freestatistics.org/blog/index.php?v=date/2008/Dec/08/t12287628634wt4zocurjqb5r0.htm/, Retrieved Thu, 16 May 2024 04:47:02 +0000
Statistical Computations at FreeStatistics.org, Office for Research Development and Education, URL https://freestatistics.org/blog/index.php?pk=30723, Retrieved Thu, 16 May 2024 04:47:02 +0000
QR Codes:

Original text written by user:
IsPrivate?No (this computation is public)
User-defined keywords
Estimated Impact188
Family? (F = Feedback message, R = changed R code, M = changed R Module, P = changed Parameters, D = changed Data)
-     [Univariate Data Series] [data set] [2008-12-01 19:54:57] [b98453cac15ba1066b407e146608df68]
F RMPD    [(Partial) Autocorrelation Function] [S2 - ACF - d1D1] [2008-12-08 18:59:57] [5f3e73ccf1ddc75508eed47fa51813d3] [Current]
Feedback Forum
2008-12-14 12:53:33 [Jeroen Michel] [reply
Ook hier zien we een perfect model en met mooie conclusie. Hier zijn zowel trend als seizoenaliteit weg gefilterd en wordt uitgelegd hoe de interpretatie moet gebeuren.

Post a new message
Dataseries X:
14897
13063
12604
13630
14421
13978
12928
13430
13470
14786
14292
14309
14013
13241
12153
14290
15669
14170
14570
14469
14265
15321
14434
13692
14194
13519
11858
14616
15643
14077
14888
14160
14643
17193
15386
14287
17527
14497
14398
16630
16671
16615
16869
15664
16360
18448
16889
16505
18321
15052
15700
18135
16769
18883
19021
18102
17776
21490
17065
18690
18953
16399
16896
18553
19270
19422
17579
18637
18077
20439
18075
19563
19899
19228
17790
19221
22059
21231
19504
23913
23166
23574
25002
22604
23409


Summary of computational transaction
Raw Inputview raw input (R code)
Raw Outputview raw output of R engine
Computing time1 seconds
R Server'Gwilym Jenkins' @ 72.249.127.135

\begin{tabular}{lllllllll}
\hline
Summary of computational transaction \tabularnewline
Raw Input & view raw input (R code)  \tabularnewline
Raw Output & view raw output of R engine  \tabularnewline
Computing time & 1 seconds \tabularnewline
R Server & 'Gwilym Jenkins' @ 72.249.127.135 \tabularnewline
\hline
\end{tabular}
%Source: https://freestatistics.org/blog/index.php?pk=30723&T=0

[TABLE]
[ROW][C]Summary of computational transaction[/C][/ROW]
[ROW][C]Raw Input[/C][C]view raw input (R code) [/C][/ROW]
[ROW][C]Raw Output[/C][C]view raw output of R engine [/C][/ROW]
[ROW][C]Computing time[/C][C]1 seconds[/C][/ROW]
[ROW][C]R Server[/C][C]'Gwilym Jenkins' @ 72.249.127.135[/C][/ROW]
[/TABLE]
Source: https://freestatistics.org/blog/index.php?pk=30723&T=0

Globally Unique Identifier (entire table): ba.freestatistics.org/blog/index.php?pk=30723&T=0

As an alternative you can also use a QR Code:  

The GUIDs for individual cells are displayed in the table below:

Summary of computational transaction
Raw Inputview raw input (R code)
Raw Outputview raw output of R engine
Computing time1 seconds
R Server'Gwilym Jenkins' @ 72.249.127.135


Autocorrelation Function
Time lag kACF(k)T-STATP-value
1-0.550623-4.67227e-06
2-0.031987-0.27140.393424
30.3705363.14410.00121
4-0.248246-2.10640.019326
5-0.132678-1.12580.131992
60.3098812.62940.005225
7-0.257675-2.18640.016017
80.0052790.04480.482198
90.2651322.24970.013762
10-0.264129-2.24120.014048
110.0536770.45550.325072
120.1183051.00390.159406
13-0.254902-2.16290.016935
140.0992840.84250.201162
150.0883350.74960.227984
16-0.211654-1.79590.038349
170.1278431.08480.140818
180.128251.08820.140061
19-0.194803-1.6530.051346
200.1162810.98670.163553
210.0455370.38640.350172
22-0.227109-1.92710.028958
230.3491082.96230.002068
24-0.303857-2.57830.005987
250.0905930.76870.22229
260.1345091.14140.128753
27-0.121884-1.03420.152247
28-0.0483-0.40980.341571
290.2095421.7780.039811
30-0.246411-2.09090.020035
310.0448210.38030.352415
320.1275171.0820.141428
33-0.179463-1.52280.066095
34-0.001049-0.00890.496462
350.1745461.48110.071475
36-0.18949-1.60790.05612
370.0926720.78640.217121
380.054280.46060.323244
39-0.103255-0.87610.191932
400.0624790.53020.298818
410.0837350.71050.23984
42-0.189351-1.60670.056249
430.1339481.13660.129741
440.0800640.67940.249541
45-0.241861-2.05230.021891
460.2869312.43470.008692
47-0.143046-1.21380.114397
48-0.047912-0.40650.342773
490.1306631.10870.135621
50-0.107861-0.91520.181564
51-0.040401-0.34280.366367
520.0999660.84820.199557
53-0.089428-0.75880.225217
54-0.002576-0.02190.491311
550.096630.81990.207481
56-0.10998-0.93320.176914
570.0278940.23670.406786
580.0532590.45190.326342
59-0.093155-0.79040.215932
600.0394460.33470.36941

\begin{tabular}{lllllllll}
\hline
Autocorrelation Function \tabularnewline
Time lag k & ACF(k) & T-STAT & P-value \tabularnewline
1 & -0.550623 & -4.6722 & 7e-06 \tabularnewline
2 & -0.031987 & -0.2714 & 0.393424 \tabularnewline
3 & 0.370536 & 3.1441 & 0.00121 \tabularnewline
4 & -0.248246 & -2.1064 & 0.019326 \tabularnewline
5 & -0.132678 & -1.1258 & 0.131992 \tabularnewline
6 & 0.309881 & 2.6294 & 0.005225 \tabularnewline
7 & -0.257675 & -2.1864 & 0.016017 \tabularnewline
8 & 0.005279 & 0.0448 & 0.482198 \tabularnewline
9 & 0.265132 & 2.2497 & 0.013762 \tabularnewline
10 & -0.264129 & -2.2412 & 0.014048 \tabularnewline
11 & 0.053677 & 0.4555 & 0.325072 \tabularnewline
12 & 0.118305 & 1.0039 & 0.159406 \tabularnewline
13 & -0.254902 & -2.1629 & 0.016935 \tabularnewline
14 & 0.099284 & 0.8425 & 0.201162 \tabularnewline
15 & 0.088335 & 0.7496 & 0.227984 \tabularnewline
16 & -0.211654 & -1.7959 & 0.038349 \tabularnewline
17 & 0.127843 & 1.0848 & 0.140818 \tabularnewline
18 & 0.12825 & 1.0882 & 0.140061 \tabularnewline
19 & -0.194803 & -1.653 & 0.051346 \tabularnewline
20 & 0.116281 & 0.9867 & 0.163553 \tabularnewline
21 & 0.045537 & 0.3864 & 0.350172 \tabularnewline
22 & -0.227109 & -1.9271 & 0.028958 \tabularnewline
23 & 0.349108 & 2.9623 & 0.002068 \tabularnewline
24 & -0.303857 & -2.5783 & 0.005987 \tabularnewline
25 & 0.090593 & 0.7687 & 0.22229 \tabularnewline
26 & 0.134509 & 1.1414 & 0.128753 \tabularnewline
27 & -0.121884 & -1.0342 & 0.152247 \tabularnewline
28 & -0.0483 & -0.4098 & 0.341571 \tabularnewline
29 & 0.209542 & 1.778 & 0.039811 \tabularnewline
30 & -0.246411 & -2.0909 & 0.020035 \tabularnewline
31 & 0.044821 & 0.3803 & 0.352415 \tabularnewline
32 & 0.127517 & 1.082 & 0.141428 \tabularnewline
33 & -0.179463 & -1.5228 & 0.066095 \tabularnewline
34 & -0.001049 & -0.0089 & 0.496462 \tabularnewline
35 & 0.174546 & 1.4811 & 0.071475 \tabularnewline
36 & -0.18949 & -1.6079 & 0.05612 \tabularnewline
37 & 0.092672 & 0.7864 & 0.217121 \tabularnewline
38 & 0.05428 & 0.4606 & 0.323244 \tabularnewline
39 & -0.103255 & -0.8761 & 0.191932 \tabularnewline
40 & 0.062479 & 0.5302 & 0.298818 \tabularnewline
41 & 0.083735 & 0.7105 & 0.23984 \tabularnewline
42 & -0.189351 & -1.6067 & 0.056249 \tabularnewline
43 & 0.133948 & 1.1366 & 0.129741 \tabularnewline
44 & 0.080064 & 0.6794 & 0.249541 \tabularnewline
45 & -0.241861 & -2.0523 & 0.021891 \tabularnewline
46 & 0.286931 & 2.4347 & 0.008692 \tabularnewline
47 & -0.143046 & -1.2138 & 0.114397 \tabularnewline
48 & -0.047912 & -0.4065 & 0.342773 \tabularnewline
49 & 0.130663 & 1.1087 & 0.135621 \tabularnewline
50 & -0.107861 & -0.9152 & 0.181564 \tabularnewline
51 & -0.040401 & -0.3428 & 0.366367 \tabularnewline
52 & 0.099966 & 0.8482 & 0.199557 \tabularnewline
53 & -0.089428 & -0.7588 & 0.225217 \tabularnewline
54 & -0.002576 & -0.0219 & 0.491311 \tabularnewline
55 & 0.09663 & 0.8199 & 0.207481 \tabularnewline
56 & -0.10998 & -0.9332 & 0.176914 \tabularnewline
57 & 0.027894 & 0.2367 & 0.406786 \tabularnewline
58 & 0.053259 & 0.4519 & 0.326342 \tabularnewline
59 & -0.093155 & -0.7904 & 0.215932 \tabularnewline
60 & 0.039446 & 0.3347 & 0.36941 \tabularnewline
\hline
\end{tabular}
%Source: https://freestatistics.org/blog/index.php?pk=30723&T=1

[TABLE]
[ROW][C]Autocorrelation Function[/C][/ROW]
[ROW][C]Time lag k[/C][C]ACF(k)[/C][C]T-STAT[/C][C]P-value[/C][/ROW]
[ROW][C]1[/C][C]-0.550623[/C][C]-4.6722[/C][C]7e-06[/C][/ROW]
[ROW][C]2[/C][C]-0.031987[/C][C]-0.2714[/C][C]0.393424[/C][/ROW]
[ROW][C]3[/C][C]0.370536[/C][C]3.1441[/C][C]0.00121[/C][/ROW]
[ROW][C]4[/C][C]-0.248246[/C][C]-2.1064[/C][C]0.019326[/C][/ROW]
[ROW][C]5[/C][C]-0.132678[/C][C]-1.1258[/C][C]0.131992[/C][/ROW]
[ROW][C]6[/C][C]0.309881[/C][C]2.6294[/C][C]0.005225[/C][/ROW]
[ROW][C]7[/C][C]-0.257675[/C][C]-2.1864[/C][C]0.016017[/C][/ROW]
[ROW][C]8[/C][C]0.005279[/C][C]0.0448[/C][C]0.482198[/C][/ROW]
[ROW][C]9[/C][C]0.265132[/C][C]2.2497[/C][C]0.013762[/C][/ROW]
[ROW][C]10[/C][C]-0.264129[/C][C]-2.2412[/C][C]0.014048[/C][/ROW]
[ROW][C]11[/C][C]0.053677[/C][C]0.4555[/C][C]0.325072[/C][/ROW]
[ROW][C]12[/C][C]0.118305[/C][C]1.0039[/C][C]0.159406[/C][/ROW]
[ROW][C]13[/C][C]-0.254902[/C][C]-2.1629[/C][C]0.016935[/C][/ROW]
[ROW][C]14[/C][C]0.099284[/C][C]0.8425[/C][C]0.201162[/C][/ROW]
[ROW][C]15[/C][C]0.088335[/C][C]0.7496[/C][C]0.227984[/C][/ROW]
[ROW][C]16[/C][C]-0.211654[/C][C]-1.7959[/C][C]0.038349[/C][/ROW]
[ROW][C]17[/C][C]0.127843[/C][C]1.0848[/C][C]0.140818[/C][/ROW]
[ROW][C]18[/C][C]0.12825[/C][C]1.0882[/C][C]0.140061[/C][/ROW]
[ROW][C]19[/C][C]-0.194803[/C][C]-1.653[/C][C]0.051346[/C][/ROW]
[ROW][C]20[/C][C]0.116281[/C][C]0.9867[/C][C]0.163553[/C][/ROW]
[ROW][C]21[/C][C]0.045537[/C][C]0.3864[/C][C]0.350172[/C][/ROW]
[ROW][C]22[/C][C]-0.227109[/C][C]-1.9271[/C][C]0.028958[/C][/ROW]
[ROW][C]23[/C][C]0.349108[/C][C]2.9623[/C][C]0.002068[/C][/ROW]
[ROW][C]24[/C][C]-0.303857[/C][C]-2.5783[/C][C]0.005987[/C][/ROW]
[ROW][C]25[/C][C]0.090593[/C][C]0.7687[/C][C]0.22229[/C][/ROW]
[ROW][C]26[/C][C]0.134509[/C][C]1.1414[/C][C]0.128753[/C][/ROW]
[ROW][C]27[/C][C]-0.121884[/C][C]-1.0342[/C][C]0.152247[/C][/ROW]
[ROW][C]28[/C][C]-0.0483[/C][C]-0.4098[/C][C]0.341571[/C][/ROW]
[ROW][C]29[/C][C]0.209542[/C][C]1.778[/C][C]0.039811[/C][/ROW]
[ROW][C]30[/C][C]-0.246411[/C][C]-2.0909[/C][C]0.020035[/C][/ROW]
[ROW][C]31[/C][C]0.044821[/C][C]0.3803[/C][C]0.352415[/C][/ROW]
[ROW][C]32[/C][C]0.127517[/C][C]1.082[/C][C]0.141428[/C][/ROW]
[ROW][C]33[/C][C]-0.179463[/C][C]-1.5228[/C][C]0.066095[/C][/ROW]
[ROW][C]34[/C][C]-0.001049[/C][C]-0.0089[/C][C]0.496462[/C][/ROW]
[ROW][C]35[/C][C]0.174546[/C][C]1.4811[/C][C]0.071475[/C][/ROW]
[ROW][C]36[/C][C]-0.18949[/C][C]-1.6079[/C][C]0.05612[/C][/ROW]
[ROW][C]37[/C][C]0.092672[/C][C]0.7864[/C][C]0.217121[/C][/ROW]
[ROW][C]38[/C][C]0.05428[/C][C]0.4606[/C][C]0.323244[/C][/ROW]
[ROW][C]39[/C][C]-0.103255[/C][C]-0.8761[/C][C]0.191932[/C][/ROW]
[ROW][C]40[/C][C]0.062479[/C][C]0.5302[/C][C]0.298818[/C][/ROW]
[ROW][C]41[/C][C]0.083735[/C][C]0.7105[/C][C]0.23984[/C][/ROW]
[ROW][C]42[/C][C]-0.189351[/C][C]-1.6067[/C][C]0.056249[/C][/ROW]
[ROW][C]43[/C][C]0.133948[/C][C]1.1366[/C][C]0.129741[/C][/ROW]
[ROW][C]44[/C][C]0.080064[/C][C]0.6794[/C][C]0.249541[/C][/ROW]
[ROW][C]45[/C][C]-0.241861[/C][C]-2.0523[/C][C]0.021891[/C][/ROW]
[ROW][C]46[/C][C]0.286931[/C][C]2.4347[/C][C]0.008692[/C][/ROW]
[ROW][C]47[/C][C]-0.143046[/C][C]-1.2138[/C][C]0.114397[/C][/ROW]
[ROW][C]48[/C][C]-0.047912[/C][C]-0.4065[/C][C]0.342773[/C][/ROW]
[ROW][C]49[/C][C]0.130663[/C][C]1.1087[/C][C]0.135621[/C][/ROW]
[ROW][C]50[/C][C]-0.107861[/C][C]-0.9152[/C][C]0.181564[/C][/ROW]
[ROW][C]51[/C][C]-0.040401[/C][C]-0.3428[/C][C]0.366367[/C][/ROW]
[ROW][C]52[/C][C]0.099966[/C][C]0.8482[/C][C]0.199557[/C][/ROW]
[ROW][C]53[/C][C]-0.089428[/C][C]-0.7588[/C][C]0.225217[/C][/ROW]
[ROW][C]54[/C][C]-0.002576[/C][C]-0.0219[/C][C]0.491311[/C][/ROW]
[ROW][C]55[/C][C]0.09663[/C][C]0.8199[/C][C]0.207481[/C][/ROW]
[ROW][C]56[/C][C]-0.10998[/C][C]-0.9332[/C][C]0.176914[/C][/ROW]
[ROW][C]57[/C][C]0.027894[/C][C]0.2367[/C][C]0.406786[/C][/ROW]
[ROW][C]58[/C][C]0.053259[/C][C]0.4519[/C][C]0.326342[/C][/ROW]
[ROW][C]59[/C][C]-0.093155[/C][C]-0.7904[/C][C]0.215932[/C][/ROW]
[ROW][C]60[/C][C]0.039446[/C][C]0.3347[/C][C]0.36941[/C][/ROW]
[/TABLE]
Source: https://freestatistics.org/blog/index.php?pk=30723&T=1

Globally Unique Identifier (entire table): ba.freestatistics.org/blog/index.php?pk=30723&T=1

As an alternative you can also use a QR Code:  

The GUIDs for individual cells are displayed in the table below:

Autocorrelation Function
Time lag kACF(k)T-STATP-value
1-0.550623-4.67227e-06
2-0.031987-0.27140.393424
30.3705363.14410.00121
4-0.248246-2.10640.019326
5-0.132678-1.12580.131992
60.3098812.62940.005225
7-0.257675-2.18640.016017
80.0052790.04480.482198
90.2651322.24970.013762
10-0.264129-2.24120.014048
110.0536770.45550.325072
120.1183051.00390.159406
13-0.254902-2.16290.016935
140.0992840.84250.201162
150.0883350.74960.227984
16-0.211654-1.79590.038349
170.1278431.08480.140818
180.128251.08820.140061
19-0.194803-1.6530.051346
200.1162810.98670.163553
210.0455370.38640.350172
22-0.227109-1.92710.028958
230.3491082.96230.002068
24-0.303857-2.57830.005987
250.0905930.76870.22229
260.1345091.14140.128753
27-0.121884-1.03420.152247
28-0.0483-0.40980.341571
290.2095421.7780.039811
30-0.246411-2.09090.020035
310.0448210.38030.352415
320.1275171.0820.141428
33-0.179463-1.52280.066095
34-0.001049-0.00890.496462
350.1745461.48110.071475
36-0.18949-1.60790.05612
370.0926720.78640.217121
380.054280.46060.323244
39-0.103255-0.87610.191932
400.0624790.53020.298818
410.0837350.71050.23984
42-0.189351-1.60670.056249
430.1339481.13660.129741
440.0800640.67940.249541
45-0.241861-2.05230.021891
460.2869312.43470.008692
47-0.143046-1.21380.114397
48-0.047912-0.40650.342773
490.1306631.10870.135621
50-0.107861-0.91520.181564
51-0.040401-0.34280.366367
520.0999660.84820.199557
53-0.089428-0.75880.225217
54-0.002576-0.02190.491311
550.096630.81990.207481
56-0.10998-0.93320.176914
570.0278940.23670.406786
580.0532590.45190.326342
59-0.093155-0.79040.215932
600.0394460.33470.36941


Partial Autocorrelation Function
Time lag kPACF(k)T-STATP-value
1-0.550623-4.67227e-06
2-0.481006-4.08155.7e-05
30.1486171.26110.105679
40.1866321.58360.058831
5-0.205444-1.74320.04278
6-0.086488-0.73390.232704
7-0.111127-0.94290.174432
8-0.054097-0.4590.323798
90.2036311.72790.04415
100.073510.62380.267381
11-0.067693-0.57440.283746
12-0.172389-1.46280.073942
13-0.290556-2.46540.008034
14-0.164467-1.39550.08357
150.0388150.32940.371422
160.0235010.19940.421252
17-0.110625-0.93870.175516
18-0.024132-0.20480.419166
190.0679640.57670.282971
200.0852490.72340.235902
210.040450.34320.366212
22-0.222572-1.88860.031488
230.2644042.24350.013969
24-0.051718-0.43880.331046
25-0.053378-0.45290.325981
26-0.107868-0.91530.181548
27-0.023845-0.20230.420114
28-0.015019-0.12740.449472
290.0290440.24640.403018
30-0.044518-0.37770.353365
31-0.093609-0.79430.214817
32-0.136135-1.15510.125925
330.0097410.08270.467176
34-0.098254-0.83370.203599
35-0.012686-0.10760.457287
36-0.06887-0.58440.280396
370.008970.07610.469769
38-0.000679-0.00580.497708
390.1042910.88490.189567
400.0601970.51080.305532
41-0.004206-0.03570.485814
42-0.090988-0.77210.221302
43-0.049572-0.42060.337639
440.0917990.77890.219284
45-0.06712-0.56950.285383
460.0010040.00850.496613
47-0.016175-0.13720.445608
48-0.067356-0.57150.28471
490.0217350.18440.427099
50-0.119011-1.00980.157976
510.0474420.40260.344234
52-0.038318-0.32510.373009
530.0339120.28780.38718
54-0.056105-0.47610.317735
55-0.066989-0.56840.28576
56-0.030211-0.25640.399206
570.0389820.33080.370888
58-0.121633-1.03210.152742
59-0.01473-0.1250.450442
60-0.039123-0.3320.370439

\begin{tabular}{lllllllll}
\hline
Partial Autocorrelation Function \tabularnewline
Time lag k & PACF(k) & T-STAT & P-value \tabularnewline
1 & -0.550623 & -4.6722 & 7e-06 \tabularnewline
2 & -0.481006 & -4.0815 & 5.7e-05 \tabularnewline
3 & 0.148617 & 1.2611 & 0.105679 \tabularnewline
4 & 0.186632 & 1.5836 & 0.058831 \tabularnewline
5 & -0.205444 & -1.7432 & 0.04278 \tabularnewline
6 & -0.086488 & -0.7339 & 0.232704 \tabularnewline
7 & -0.111127 & -0.9429 & 0.174432 \tabularnewline
8 & -0.054097 & -0.459 & 0.323798 \tabularnewline
9 & 0.203631 & 1.7279 & 0.04415 \tabularnewline
10 & 0.07351 & 0.6238 & 0.267381 \tabularnewline
11 & -0.067693 & -0.5744 & 0.283746 \tabularnewline
12 & -0.172389 & -1.4628 & 0.073942 \tabularnewline
13 & -0.290556 & -2.4654 & 0.008034 \tabularnewline
14 & -0.164467 & -1.3955 & 0.08357 \tabularnewline
15 & 0.038815 & 0.3294 & 0.371422 \tabularnewline
16 & 0.023501 & 0.1994 & 0.421252 \tabularnewline
17 & -0.110625 & -0.9387 & 0.175516 \tabularnewline
18 & -0.024132 & -0.2048 & 0.419166 \tabularnewline
19 & 0.067964 & 0.5767 & 0.282971 \tabularnewline
20 & 0.085249 & 0.7234 & 0.235902 \tabularnewline
21 & 0.04045 & 0.3432 & 0.366212 \tabularnewline
22 & -0.222572 & -1.8886 & 0.031488 \tabularnewline
23 & 0.264404 & 2.2435 & 0.013969 \tabularnewline
24 & -0.051718 & -0.4388 & 0.331046 \tabularnewline
25 & -0.053378 & -0.4529 & 0.325981 \tabularnewline
26 & -0.107868 & -0.9153 & 0.181548 \tabularnewline
27 & -0.023845 & -0.2023 & 0.420114 \tabularnewline
28 & -0.015019 & -0.1274 & 0.449472 \tabularnewline
29 & 0.029044 & 0.2464 & 0.403018 \tabularnewline
30 & -0.044518 & -0.3777 & 0.353365 \tabularnewline
31 & -0.093609 & -0.7943 & 0.214817 \tabularnewline
32 & -0.136135 & -1.1551 & 0.125925 \tabularnewline
33 & 0.009741 & 0.0827 & 0.467176 \tabularnewline
34 & -0.098254 & -0.8337 & 0.203599 \tabularnewline
35 & -0.012686 & -0.1076 & 0.457287 \tabularnewline
36 & -0.06887 & -0.5844 & 0.280396 \tabularnewline
37 & 0.00897 & 0.0761 & 0.469769 \tabularnewline
38 & -0.000679 & -0.0058 & 0.497708 \tabularnewline
39 & 0.104291 & 0.8849 & 0.189567 \tabularnewline
40 & 0.060197 & 0.5108 & 0.305532 \tabularnewline
41 & -0.004206 & -0.0357 & 0.485814 \tabularnewline
42 & -0.090988 & -0.7721 & 0.221302 \tabularnewline
43 & -0.049572 & -0.4206 & 0.337639 \tabularnewline
44 & 0.091799 & 0.7789 & 0.219284 \tabularnewline
45 & -0.06712 & -0.5695 & 0.285383 \tabularnewline
46 & 0.001004 & 0.0085 & 0.496613 \tabularnewline
47 & -0.016175 & -0.1372 & 0.445608 \tabularnewline
48 & -0.067356 & -0.5715 & 0.28471 \tabularnewline
49 & 0.021735 & 0.1844 & 0.427099 \tabularnewline
50 & -0.119011 & -1.0098 & 0.157976 \tabularnewline
51 & 0.047442 & 0.4026 & 0.344234 \tabularnewline
52 & -0.038318 & -0.3251 & 0.373009 \tabularnewline
53 & 0.033912 & 0.2878 & 0.38718 \tabularnewline
54 & -0.056105 & -0.4761 & 0.317735 \tabularnewline
55 & -0.066989 & -0.5684 & 0.28576 \tabularnewline
56 & -0.030211 & -0.2564 & 0.399206 \tabularnewline
57 & 0.038982 & 0.3308 & 0.370888 \tabularnewline
58 & -0.121633 & -1.0321 & 0.152742 \tabularnewline
59 & -0.01473 & -0.125 & 0.450442 \tabularnewline
60 & -0.039123 & -0.332 & 0.370439 \tabularnewline
\hline
\end{tabular}
%Source: https://freestatistics.org/blog/index.php?pk=30723&T=2

[TABLE]
[ROW][C]Partial Autocorrelation Function[/C][/ROW]
[ROW][C]Time lag k[/C][C]PACF(k)[/C][C]T-STAT[/C][C]P-value[/C][/ROW]
[ROW][C]1[/C][C]-0.550623[/C][C]-4.6722[/C][C]7e-06[/C][/ROW]
[ROW][C]2[/C][C]-0.481006[/C][C]-4.0815[/C][C]5.7e-05[/C][/ROW]
[ROW][C]3[/C][C]0.148617[/C][C]1.2611[/C][C]0.105679[/C][/ROW]
[ROW][C]4[/C][C]0.186632[/C][C]1.5836[/C][C]0.058831[/C][/ROW]
[ROW][C]5[/C][C]-0.205444[/C][C]-1.7432[/C][C]0.04278[/C][/ROW]
[ROW][C]6[/C][C]-0.086488[/C][C]-0.7339[/C][C]0.232704[/C][/ROW]
[ROW][C]7[/C][C]-0.111127[/C][C]-0.9429[/C][C]0.174432[/C][/ROW]
[ROW][C]8[/C][C]-0.054097[/C][C]-0.459[/C][C]0.323798[/C][/ROW]
[ROW][C]9[/C][C]0.203631[/C][C]1.7279[/C][C]0.04415[/C][/ROW]
[ROW][C]10[/C][C]0.07351[/C][C]0.6238[/C][C]0.267381[/C][/ROW]
[ROW][C]11[/C][C]-0.067693[/C][C]-0.5744[/C][C]0.283746[/C][/ROW]
[ROW][C]12[/C][C]-0.172389[/C][C]-1.4628[/C][C]0.073942[/C][/ROW]
[ROW][C]13[/C][C]-0.290556[/C][C]-2.4654[/C][C]0.008034[/C][/ROW]
[ROW][C]14[/C][C]-0.164467[/C][C]-1.3955[/C][C]0.08357[/C][/ROW]
[ROW][C]15[/C][C]0.038815[/C][C]0.3294[/C][C]0.371422[/C][/ROW]
[ROW][C]16[/C][C]0.023501[/C][C]0.1994[/C][C]0.421252[/C][/ROW]
[ROW][C]17[/C][C]-0.110625[/C][C]-0.9387[/C][C]0.175516[/C][/ROW]
[ROW][C]18[/C][C]-0.024132[/C][C]-0.2048[/C][C]0.419166[/C][/ROW]
[ROW][C]19[/C][C]0.067964[/C][C]0.5767[/C][C]0.282971[/C][/ROW]
[ROW][C]20[/C][C]0.085249[/C][C]0.7234[/C][C]0.235902[/C][/ROW]
[ROW][C]21[/C][C]0.04045[/C][C]0.3432[/C][C]0.366212[/C][/ROW]
[ROW][C]22[/C][C]-0.222572[/C][C]-1.8886[/C][C]0.031488[/C][/ROW]
[ROW][C]23[/C][C]0.264404[/C][C]2.2435[/C][C]0.013969[/C][/ROW]
[ROW][C]24[/C][C]-0.051718[/C][C]-0.4388[/C][C]0.331046[/C][/ROW]
[ROW][C]25[/C][C]-0.053378[/C][C]-0.4529[/C][C]0.325981[/C][/ROW]
[ROW][C]26[/C][C]-0.107868[/C][C]-0.9153[/C][C]0.181548[/C][/ROW]
[ROW][C]27[/C][C]-0.023845[/C][C]-0.2023[/C][C]0.420114[/C][/ROW]
[ROW][C]28[/C][C]-0.015019[/C][C]-0.1274[/C][C]0.449472[/C][/ROW]
[ROW][C]29[/C][C]0.029044[/C][C]0.2464[/C][C]0.403018[/C][/ROW]
[ROW][C]30[/C][C]-0.044518[/C][C]-0.3777[/C][C]0.353365[/C][/ROW]
[ROW][C]31[/C][C]-0.093609[/C][C]-0.7943[/C][C]0.214817[/C][/ROW]
[ROW][C]32[/C][C]-0.136135[/C][C]-1.1551[/C][C]0.125925[/C][/ROW]
[ROW][C]33[/C][C]0.009741[/C][C]0.0827[/C][C]0.467176[/C][/ROW]
[ROW][C]34[/C][C]-0.098254[/C][C]-0.8337[/C][C]0.203599[/C][/ROW]
[ROW][C]35[/C][C]-0.012686[/C][C]-0.1076[/C][C]0.457287[/C][/ROW]
[ROW][C]36[/C][C]-0.06887[/C][C]-0.5844[/C][C]0.280396[/C][/ROW]
[ROW][C]37[/C][C]0.00897[/C][C]0.0761[/C][C]0.469769[/C][/ROW]
[ROW][C]38[/C][C]-0.000679[/C][C]-0.0058[/C][C]0.497708[/C][/ROW]
[ROW][C]39[/C][C]0.104291[/C][C]0.8849[/C][C]0.189567[/C][/ROW]
[ROW][C]40[/C][C]0.060197[/C][C]0.5108[/C][C]0.305532[/C][/ROW]
[ROW][C]41[/C][C]-0.004206[/C][C]-0.0357[/C][C]0.485814[/C][/ROW]
[ROW][C]42[/C][C]-0.090988[/C][C]-0.7721[/C][C]0.221302[/C][/ROW]
[ROW][C]43[/C][C]-0.049572[/C][C]-0.4206[/C][C]0.337639[/C][/ROW]
[ROW][C]44[/C][C]0.091799[/C][C]0.7789[/C][C]0.219284[/C][/ROW]
[ROW][C]45[/C][C]-0.06712[/C][C]-0.5695[/C][C]0.285383[/C][/ROW]
[ROW][C]46[/C][C]0.001004[/C][C]0.0085[/C][C]0.496613[/C][/ROW]
[ROW][C]47[/C][C]-0.016175[/C][C]-0.1372[/C][C]0.445608[/C][/ROW]
[ROW][C]48[/C][C]-0.067356[/C][C]-0.5715[/C][C]0.28471[/C][/ROW]
[ROW][C]49[/C][C]0.021735[/C][C]0.1844[/C][C]0.427099[/C][/ROW]
[ROW][C]50[/C][C]-0.119011[/C][C]-1.0098[/C][C]0.157976[/C][/ROW]
[ROW][C]51[/C][C]0.047442[/C][C]0.4026[/C][C]0.344234[/C][/ROW]
[ROW][C]52[/C][C]-0.038318[/C][C]-0.3251[/C][C]0.373009[/C][/ROW]
[ROW][C]53[/C][C]0.033912[/C][C]0.2878[/C][C]0.38718[/C][/ROW]
[ROW][C]54[/C][C]-0.056105[/C][C]-0.4761[/C][C]0.317735[/C][/ROW]
[ROW][C]55[/C][C]-0.066989[/C][C]-0.5684[/C][C]0.28576[/C][/ROW]
[ROW][C]56[/C][C]-0.030211[/C][C]-0.2564[/C][C]0.399206[/C][/ROW]
[ROW][C]57[/C][C]0.038982[/C][C]0.3308[/C][C]0.370888[/C][/ROW]
[ROW][C]58[/C][C]-0.121633[/C][C]-1.0321[/C][C]0.152742[/C][/ROW]
[ROW][C]59[/C][C]-0.01473[/C][C]-0.125[/C][C]0.450442[/C][/ROW]
[ROW][C]60[/C][C]-0.039123[/C][C]-0.332[/C][C]0.370439[/C][/ROW]
[/TABLE]
Source: https://freestatistics.org/blog/index.php?pk=30723&T=2

Globally Unique Identifier (entire table): ba.freestatistics.org/blog/index.php?pk=30723&T=2

As an alternative you can also use a QR Code:  

The GUIDs for individual cells are displayed in the table below:

Partial Autocorrelation Function
Time lag kPACF(k)T-STATP-value
1-0.550623-4.67227e-06
2-0.481006-4.08155.7e-05
30.1486171.26110.105679
40.1866321.58360.058831
5-0.205444-1.74320.04278
6-0.086488-0.73390.232704
7-0.111127-0.94290.174432
8-0.054097-0.4590.323798
90.2036311.72790.04415
100.073510.62380.267381
11-0.067693-0.57440.283746
12-0.172389-1.46280.073942
13-0.290556-2.46540.008034
14-0.164467-1.39550.08357
150.0388150.32940.371422
160.0235010.19940.421252
17-0.110625-0.93870.175516
18-0.024132-0.20480.419166
190.0679640.57670.282971
200.0852490.72340.235902
210.040450.34320.366212
22-0.222572-1.88860.031488
230.2644042.24350.013969
24-0.051718-0.43880.331046
25-0.053378-0.45290.325981
26-0.107868-0.91530.181548
27-0.023845-0.20230.420114
28-0.015019-0.12740.449472
290.0290440.24640.403018
30-0.044518-0.37770.353365
31-0.093609-0.79430.214817
32-0.136135-1.15510.125925
330.0097410.08270.467176
34-0.098254-0.83370.203599
35-0.012686-0.10760.457287
36-0.06887-0.58440.280396
370.008970.07610.469769
38-0.000679-0.00580.497708
390.1042910.88490.189567
400.0601970.51080.305532
41-0.004206-0.03570.485814
42-0.090988-0.77210.221302
43-0.049572-0.42060.337639
440.0917990.77890.219284
45-0.06712-0.56950.285383
460.0010040.00850.496613
47-0.016175-0.13720.445608
48-0.067356-0.57150.28471
490.0217350.18440.427099
50-0.119011-1.00980.157976
510.0474420.40260.344234
52-0.038318-0.32510.373009
530.0339120.28780.38718
54-0.056105-0.47610.317735
55-0.066989-0.56840.28576
56-0.030211-0.25640.399206
570.0389820.33080.370888
58-0.121633-1.03210.152742
59-0.01473-0.1250.450442
60-0.039123-0.3320.370439


Parameters (Session):
par1 = 60 ; par2 = 1 ; par3 = 1 ; par4 = 1 ; par5 = 12 ;
Parameters (R input):
par1 = 60 ; par2 = 1 ; par3 = 1 ; par4 = 1 ; par5 = 12 ;
R code (references can be found in the software module):
if (par1 == 'Default') {
par1 = 10*log10(length(x))
} else {
par1 <- as.numeric(par1)
}
par2 <- as.numeric(par2)
par3 <- as.numeric(par3)
par4 <- as.numeric(par4)
par5 <- as.numeric(par5)
if (par2 == 0) {
x <- log(x)
} else {
x <- (x ^ par2 - 1) / par2
}
if (par3 > 0) x <- diff(x,lag=1,difference=par3)
if (par4 > 0) x <- diff(x,lag=par5,difference=par4)
bitmap(file='pic1.png')
racf <- acf(x,par1,main='Autocorrelation',xlab='lags',ylab='ACF')
dev.off()
bitmap(file='pic2.png')
rpacf <- pacf(x,par1,main='Partial Autocorrelation',xlab='lags',ylab='PACF')
dev.off()
(myacf <- c(racf$acf))
(mypacf <- c(rpacf$acf))
lengthx <- length(x)
sqrtn <- sqrt(lengthx)
load(file='createtable')
a<-table.start()
a<-table.row.start(a)
a<-table.element(a,'Autocorrelation Function',4,TRUE)
a<-table.row.end(a)
a<-table.row.start(a)
a<-table.element(a,'Time lag k',header=TRUE)
a<-table.element(a,hyperlink('basics.htm','ACF(k)','click here for more information about the Autocorrelation Function'),header=TRUE)
a<-table.element(a,'T-STAT',header=TRUE)
a<-table.element(a,'P-value',header=TRUE)
a<-table.row.end(a)
for (i in 2:(par1+1)) {
a<-table.row.start(a)
a<-table.element(a,i-1,header=TRUE)
a<-table.element(a,round(myacf[i],6))
mytstat <- myacf[i]*sqrtn
a<-table.element(a,round(mytstat,4))
a<-table.element(a,round(1-pt(abs(mytstat),lengthx),6))
a<-table.row.end(a)
}
a<-table.end(a)
table.save(a,file='mytable.tab')
a<-table.start()
a<-table.row.start(a)
a<-table.element(a,'Partial Autocorrelation Function',4,TRUE)
a<-table.row.end(a)
a<-table.row.start(a)
a<-table.element(a,'Time lag k',header=TRUE)
a<-table.element(a,hyperlink('basics.htm','PACF(k)','click here for more information about the Partial Autocorrelation Function'),header=TRUE)
a<-table.element(a,'T-STAT',header=TRUE)
a<-table.element(a,'P-value',header=TRUE)
a<-table.row.end(a)
for (i in 1:par1) {
a<-table.row.start(a)
a<-table.element(a,i,header=TRUE)
a<-table.element(a,round(mypacf[i],6))
mytstat <- mypacf[i]*sqrtn
a<-table.element(a,round(mytstat,4))
a<-table.element(a,round(1-pt(abs(mytstat),lengthx),6))
a<-table.row.end(a)
}
a<-table.end(a)
table.save(a,file='mytable1.tab')