Free Statistics

of Irreproducible Research!

Author's title

Author*The author of this computation has been verified*
R Software Modulerwasp_autocorrelation.wasp
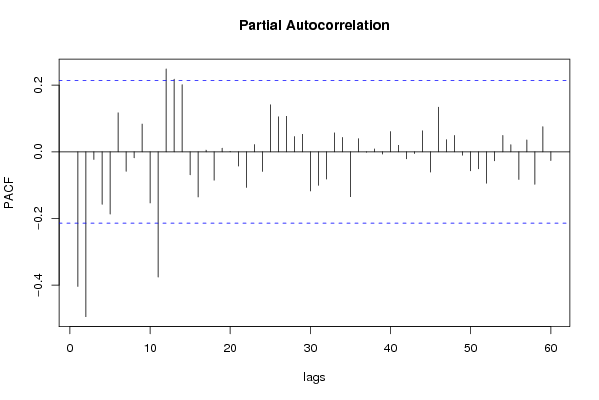
Title produced by software(Partial) Autocorrelation Function
Date of computationMon, 08 Dec 2008 11:57:28 -0700
Cite this page as followsStatistical Computations at FreeStatistics.org, Office for Research Development and Education, URL https://freestatistics.org/blog/index.php?v=date/2008/Dec/08/t1228762713ia140kfdfoy8azh.htm/, Retrieved Thu, 16 May 2024 12:42:16 +0000
Statistical Computations at FreeStatistics.org, Office for Research Development and Education, URL https://freestatistics.org/blog/index.php?pk=30714, Retrieved Thu, 16 May 2024 12:42:16 +0000
QR Codes:

Original text written by user:
IsPrivate?No (this computation is public)
User-defined keywords
Estimated Impact155
Family? (F = Feedback message, R = changed R code, M = changed R Module, P = changed Parameters, D = changed Data)
-     [Univariate Data Series] [data set] [2008-12-01 19:54:57] [b98453cac15ba1066b407e146608df68]
F RMPD    [(Partial) Autocorrelation Function] [] [2008-12-08 18:57:28] [5f3e73ccf1ddc75508eed47fa51813d3] [Current]
Feedback Forum
2008-12-14 12:52:57 [Jeroen Michel] [reply
Hier is er inderdaad sprake van een seizoensinvloed op de lags 12 en 24. Deze beïnvloeden duidelijk de geselecteerde reeks. De student haalt duidelijk aan dat door een nieuwe berekening de invloeden kunnen worden weggewerkt.

Post a new message
Dataseries X:
14897
13063
12604
13630
14421
13978
12928
13430
13470
14786
14292
14309
14013
13241
12153
14290
15669
14170
14570
14469
14265
15321
14434
13692
14194
13519
11858
14616
15643
14077
14888
14160
14643
17193
15386
14287
17527
14497
14398
16630
16671
16615
16869
15664
16360
18448
16889
16505
18321
15052
15700
18135
16769
18883
19021
18102
17776
21490
17065
18690
18953
16399
16896
18553
19270
19422
17579
18637
18077
20439
18075
19563
19899
19228
17790
19221
22059
21231
19504
23913
23166
23574
25002
22604
23409


Summary of computational transaction
Raw Inputview raw input (R code)
Raw Outputview raw output of R engine
Computing time1 seconds
R Server'Gwilym Jenkins' @ 72.249.127.135

\begin{tabular}{lllllllll}
\hline
Summary of computational transaction \tabularnewline
Raw Input & view raw input (R code)  \tabularnewline
Raw Output & view raw output of R engine  \tabularnewline
Computing time & 1 seconds \tabularnewline
R Server & 'Gwilym Jenkins' @ 72.249.127.135 \tabularnewline
\hline
\end{tabular}
%Source: https://freestatistics.org/blog/index.php?pk=30714&T=0

[TABLE]
[ROW][C]Summary of computational transaction[/C][/ROW]
[ROW][C]Raw Input[/C][C]view raw input (R code) [/C][/ROW]
[ROW][C]Raw Output[/C][C]view raw output of R engine [/C][/ROW]
[ROW][C]Computing time[/C][C]1 seconds[/C][/ROW]
[ROW][C]R Server[/C][C]'Gwilym Jenkins' @ 72.249.127.135[/C][/ROW]
[/TABLE]
Source: https://freestatistics.org/blog/index.php?pk=30714&T=0

Globally Unique Identifier (entire table): ba.freestatistics.org/blog/index.php?pk=30714&T=0

As an alternative you can also use a QR Code:  

The GUIDs for individual cells are displayed in the table below:

Summary of computational transaction
Raw Inputview raw input (R code)
Raw Outputview raw output of R engine
Computing time1 seconds
R Server'Gwilym Jenkins' @ 72.249.127.135


Autocorrelation Function
Time lag kACF(k)T-STATP-value
1-0.404446-3.70680.000188
2-0.250422-2.29520.012109
30.3370233.08890.001362
4-0.170477-1.56240.060971
5-0.114105-1.04580.149329
60.3144472.8820.002508
7-0.218417-2.00180.024265
8-0.043523-0.39890.345492
90.2333562.13870.01768
10-0.273471-2.50640.007062
11-0.1267-1.16120.124419
120.5523255.06211e-06
13-0.259793-2.3810.009763
14-0.123421-1.13120.130602
150.1610181.47580.071874
16-0.157658-1.4450.076095
170.0490150.44920.327211
180.1299871.19140.118435
19-0.14953-1.37050.087097
200.0324810.29770.383337
210.0751320.68860.246488
22-0.210471-1.9290.028554
230.0689050.63150.264707
240.2043851.87320.032258
25-0.057962-0.53120.298332
26-0.058553-0.53660.296466
270.0109980.10080.459976
28-0.067318-0.6170.269458
290.1143181.04770.148882
30-0.062035-0.56860.285586
31-0.019104-0.17510.430715
320.0436820.40040.344956
33-0.014809-0.13570.446181
34-0.116626-1.06890.14409
350.0358980.3290.371482
360.1464531.34230.091563
37-0.001575-0.01440.494258
38-0.082187-0.75330.2267
39-0.015641-0.14340.443176
400.014320.13120.447946
410.040410.37040.356022
42-0.056741-0.520.302203
430.035810.32820.371788
440.029450.26990.393943
45-0.077134-0.70690.240779
460.0364720.33430.369504
47-0.077644-0.71160.239335
480.1397131.28050.101949
490.0464340.42560.335754
50-0.123452-1.13150.130541
51-0.011099-0.10170.459609
520.0532680.48820.313336
53-0.038896-0.35650.361185
540.0273250.25040.401432
550.0004480.00410.498366
56-0.035768-0.32780.371932
570.0153270.14050.44431
58-0.018115-0.1660.434266
59-0.051259-0.46980.319859
600.1089270.99830.160493

\begin{tabular}{lllllllll}
\hline
Autocorrelation Function \tabularnewline
Time lag k & ACF(k) & T-STAT & P-value \tabularnewline
1 & -0.404446 & -3.7068 & 0.000188 \tabularnewline
2 & -0.250422 & -2.2952 & 0.012109 \tabularnewline
3 & 0.337023 & 3.0889 & 0.001362 \tabularnewline
4 & -0.170477 & -1.5624 & 0.060971 \tabularnewline
5 & -0.114105 & -1.0458 & 0.149329 \tabularnewline
6 & 0.314447 & 2.882 & 0.002508 \tabularnewline
7 & -0.218417 & -2.0018 & 0.024265 \tabularnewline
8 & -0.043523 & -0.3989 & 0.345492 \tabularnewline
9 & 0.233356 & 2.1387 & 0.01768 \tabularnewline
10 & -0.273471 & -2.5064 & 0.007062 \tabularnewline
11 & -0.1267 & -1.1612 & 0.124419 \tabularnewline
12 & 0.552325 & 5.0621 & 1e-06 \tabularnewline
13 & -0.259793 & -2.381 & 0.009763 \tabularnewline
14 & -0.123421 & -1.1312 & 0.130602 \tabularnewline
15 & 0.161018 & 1.4758 & 0.071874 \tabularnewline
16 & -0.157658 & -1.445 & 0.076095 \tabularnewline
17 & 0.049015 & 0.4492 & 0.327211 \tabularnewline
18 & 0.129987 & 1.1914 & 0.118435 \tabularnewline
19 & -0.14953 & -1.3705 & 0.087097 \tabularnewline
20 & 0.032481 & 0.2977 & 0.383337 \tabularnewline
21 & 0.075132 & 0.6886 & 0.246488 \tabularnewline
22 & -0.210471 & -1.929 & 0.028554 \tabularnewline
23 & 0.068905 & 0.6315 & 0.264707 \tabularnewline
24 & 0.204385 & 1.8732 & 0.032258 \tabularnewline
25 & -0.057962 & -0.5312 & 0.298332 \tabularnewline
26 & -0.058553 & -0.5366 & 0.296466 \tabularnewline
27 & 0.010998 & 0.1008 & 0.459976 \tabularnewline
28 & -0.067318 & -0.617 & 0.269458 \tabularnewline
29 & 0.114318 & 1.0477 & 0.148882 \tabularnewline
30 & -0.062035 & -0.5686 & 0.285586 \tabularnewline
31 & -0.019104 & -0.1751 & 0.430715 \tabularnewline
32 & 0.043682 & 0.4004 & 0.344956 \tabularnewline
33 & -0.014809 & -0.1357 & 0.446181 \tabularnewline
34 & -0.116626 & -1.0689 & 0.14409 \tabularnewline
35 & 0.035898 & 0.329 & 0.371482 \tabularnewline
36 & 0.146453 & 1.3423 & 0.091563 \tabularnewline
37 & -0.001575 & -0.0144 & 0.494258 \tabularnewline
38 & -0.082187 & -0.7533 & 0.2267 \tabularnewline
39 & -0.015641 & -0.1434 & 0.443176 \tabularnewline
40 & 0.01432 & 0.1312 & 0.447946 \tabularnewline
41 & 0.04041 & 0.3704 & 0.356022 \tabularnewline
42 & -0.056741 & -0.52 & 0.302203 \tabularnewline
43 & 0.03581 & 0.3282 & 0.371788 \tabularnewline
44 & 0.02945 & 0.2699 & 0.393943 \tabularnewline
45 & -0.077134 & -0.7069 & 0.240779 \tabularnewline
46 & 0.036472 & 0.3343 & 0.369504 \tabularnewline
47 & -0.077644 & -0.7116 & 0.239335 \tabularnewline
48 & 0.139713 & 1.2805 & 0.101949 \tabularnewline
49 & 0.046434 & 0.4256 & 0.335754 \tabularnewline
50 & -0.123452 & -1.1315 & 0.130541 \tabularnewline
51 & -0.011099 & -0.1017 & 0.459609 \tabularnewline
52 & 0.053268 & 0.4882 & 0.313336 \tabularnewline
53 & -0.038896 & -0.3565 & 0.361185 \tabularnewline
54 & 0.027325 & 0.2504 & 0.401432 \tabularnewline
55 & 0.000448 & 0.0041 & 0.498366 \tabularnewline
56 & -0.035768 & -0.3278 & 0.371932 \tabularnewline
57 & 0.015327 & 0.1405 & 0.44431 \tabularnewline
58 & -0.018115 & -0.166 & 0.434266 \tabularnewline
59 & -0.051259 & -0.4698 & 0.319859 \tabularnewline
60 & 0.108927 & 0.9983 & 0.160493 \tabularnewline
\hline
\end{tabular}
%Source: https://freestatistics.org/blog/index.php?pk=30714&T=1

[TABLE]
[ROW][C]Autocorrelation Function[/C][/ROW]
[ROW][C]Time lag k[/C][C]ACF(k)[/C][C]T-STAT[/C][C]P-value[/C][/ROW]
[ROW][C]1[/C][C]-0.404446[/C][C]-3.7068[/C][C]0.000188[/C][/ROW]
[ROW][C]2[/C][C]-0.250422[/C][C]-2.2952[/C][C]0.012109[/C][/ROW]
[ROW][C]3[/C][C]0.337023[/C][C]3.0889[/C][C]0.001362[/C][/ROW]
[ROW][C]4[/C][C]-0.170477[/C][C]-1.5624[/C][C]0.060971[/C][/ROW]
[ROW][C]5[/C][C]-0.114105[/C][C]-1.0458[/C][C]0.149329[/C][/ROW]
[ROW][C]6[/C][C]0.314447[/C][C]2.882[/C][C]0.002508[/C][/ROW]
[ROW][C]7[/C][C]-0.218417[/C][C]-2.0018[/C][C]0.024265[/C][/ROW]
[ROW][C]8[/C][C]-0.043523[/C][C]-0.3989[/C][C]0.345492[/C][/ROW]
[ROW][C]9[/C][C]0.233356[/C][C]2.1387[/C][C]0.01768[/C][/ROW]
[ROW][C]10[/C][C]-0.273471[/C][C]-2.5064[/C][C]0.007062[/C][/ROW]
[ROW][C]11[/C][C]-0.1267[/C][C]-1.1612[/C][C]0.124419[/C][/ROW]
[ROW][C]12[/C][C]0.552325[/C][C]5.0621[/C][C]1e-06[/C][/ROW]
[ROW][C]13[/C][C]-0.259793[/C][C]-2.381[/C][C]0.009763[/C][/ROW]
[ROW][C]14[/C][C]-0.123421[/C][C]-1.1312[/C][C]0.130602[/C][/ROW]
[ROW][C]15[/C][C]0.161018[/C][C]1.4758[/C][C]0.071874[/C][/ROW]
[ROW][C]16[/C][C]-0.157658[/C][C]-1.445[/C][C]0.076095[/C][/ROW]
[ROW][C]17[/C][C]0.049015[/C][C]0.4492[/C][C]0.327211[/C][/ROW]
[ROW][C]18[/C][C]0.129987[/C][C]1.1914[/C][C]0.118435[/C][/ROW]
[ROW][C]19[/C][C]-0.14953[/C][C]-1.3705[/C][C]0.087097[/C][/ROW]
[ROW][C]20[/C][C]0.032481[/C][C]0.2977[/C][C]0.383337[/C][/ROW]
[ROW][C]21[/C][C]0.075132[/C][C]0.6886[/C][C]0.246488[/C][/ROW]
[ROW][C]22[/C][C]-0.210471[/C][C]-1.929[/C][C]0.028554[/C][/ROW]
[ROW][C]23[/C][C]0.068905[/C][C]0.6315[/C][C]0.264707[/C][/ROW]
[ROW][C]24[/C][C]0.204385[/C][C]1.8732[/C][C]0.032258[/C][/ROW]
[ROW][C]25[/C][C]-0.057962[/C][C]-0.5312[/C][C]0.298332[/C][/ROW]
[ROW][C]26[/C][C]-0.058553[/C][C]-0.5366[/C][C]0.296466[/C][/ROW]
[ROW][C]27[/C][C]0.010998[/C][C]0.1008[/C][C]0.459976[/C][/ROW]
[ROW][C]28[/C][C]-0.067318[/C][C]-0.617[/C][C]0.269458[/C][/ROW]
[ROW][C]29[/C][C]0.114318[/C][C]1.0477[/C][C]0.148882[/C][/ROW]
[ROW][C]30[/C][C]-0.062035[/C][C]-0.5686[/C][C]0.285586[/C][/ROW]
[ROW][C]31[/C][C]-0.019104[/C][C]-0.1751[/C][C]0.430715[/C][/ROW]
[ROW][C]32[/C][C]0.043682[/C][C]0.4004[/C][C]0.344956[/C][/ROW]
[ROW][C]33[/C][C]-0.014809[/C][C]-0.1357[/C][C]0.446181[/C][/ROW]
[ROW][C]34[/C][C]-0.116626[/C][C]-1.0689[/C][C]0.14409[/C][/ROW]
[ROW][C]35[/C][C]0.035898[/C][C]0.329[/C][C]0.371482[/C][/ROW]
[ROW][C]36[/C][C]0.146453[/C][C]1.3423[/C][C]0.091563[/C][/ROW]
[ROW][C]37[/C][C]-0.001575[/C][C]-0.0144[/C][C]0.494258[/C][/ROW]
[ROW][C]38[/C][C]-0.082187[/C][C]-0.7533[/C][C]0.2267[/C][/ROW]
[ROW][C]39[/C][C]-0.015641[/C][C]-0.1434[/C][C]0.443176[/C][/ROW]
[ROW][C]40[/C][C]0.01432[/C][C]0.1312[/C][C]0.447946[/C][/ROW]
[ROW][C]41[/C][C]0.04041[/C][C]0.3704[/C][C]0.356022[/C][/ROW]
[ROW][C]42[/C][C]-0.056741[/C][C]-0.52[/C][C]0.302203[/C][/ROW]
[ROW][C]43[/C][C]0.03581[/C][C]0.3282[/C][C]0.371788[/C][/ROW]
[ROW][C]44[/C][C]0.02945[/C][C]0.2699[/C][C]0.393943[/C][/ROW]
[ROW][C]45[/C][C]-0.077134[/C][C]-0.7069[/C][C]0.240779[/C][/ROW]
[ROW][C]46[/C][C]0.036472[/C][C]0.3343[/C][C]0.369504[/C][/ROW]
[ROW][C]47[/C][C]-0.077644[/C][C]-0.7116[/C][C]0.239335[/C][/ROW]
[ROW][C]48[/C][C]0.139713[/C][C]1.2805[/C][C]0.101949[/C][/ROW]
[ROW][C]49[/C][C]0.046434[/C][C]0.4256[/C][C]0.335754[/C][/ROW]
[ROW][C]50[/C][C]-0.123452[/C][C]-1.1315[/C][C]0.130541[/C][/ROW]
[ROW][C]51[/C][C]-0.011099[/C][C]-0.1017[/C][C]0.459609[/C][/ROW]
[ROW][C]52[/C][C]0.053268[/C][C]0.4882[/C][C]0.313336[/C][/ROW]
[ROW][C]53[/C][C]-0.038896[/C][C]-0.3565[/C][C]0.361185[/C][/ROW]
[ROW][C]54[/C][C]0.027325[/C][C]0.2504[/C][C]0.401432[/C][/ROW]
[ROW][C]55[/C][C]0.000448[/C][C]0.0041[/C][C]0.498366[/C][/ROW]
[ROW][C]56[/C][C]-0.035768[/C][C]-0.3278[/C][C]0.371932[/C][/ROW]
[ROW][C]57[/C][C]0.015327[/C][C]0.1405[/C][C]0.44431[/C][/ROW]
[ROW][C]58[/C][C]-0.018115[/C][C]-0.166[/C][C]0.434266[/C][/ROW]
[ROW][C]59[/C][C]-0.051259[/C][C]-0.4698[/C][C]0.319859[/C][/ROW]
[ROW][C]60[/C][C]0.108927[/C][C]0.9983[/C][C]0.160493[/C][/ROW]
[/TABLE]
Source: https://freestatistics.org/blog/index.php?pk=30714&T=1

Globally Unique Identifier (entire table): ba.freestatistics.org/blog/index.php?pk=30714&T=1

As an alternative you can also use a QR Code:  

The GUIDs for individual cells are displayed in the table below:

Autocorrelation Function
Time lag kACF(k)T-STATP-value
1-0.404446-3.70680.000188
2-0.250422-2.29520.012109
30.3370233.08890.001362
4-0.170477-1.56240.060971
5-0.114105-1.04580.149329
60.3144472.8820.002508
7-0.218417-2.00180.024265
8-0.043523-0.39890.345492
90.2333562.13870.01768
10-0.273471-2.50640.007062
11-0.1267-1.16120.124419
120.5523255.06211e-06
13-0.259793-2.3810.009763
14-0.123421-1.13120.130602
150.1610181.47580.071874
16-0.157658-1.4450.076095
170.0490150.44920.327211
180.1299871.19140.118435
19-0.14953-1.37050.087097
200.0324810.29770.383337
210.0751320.68860.246488
22-0.210471-1.9290.028554
230.0689050.63150.264707
240.2043851.87320.032258
25-0.057962-0.53120.298332
26-0.058553-0.53660.296466
270.0109980.10080.459976
28-0.067318-0.6170.269458
290.1143181.04770.148882
30-0.062035-0.56860.285586
31-0.019104-0.17510.430715
320.0436820.40040.344956
33-0.014809-0.13570.446181
34-0.116626-1.06890.14409
350.0358980.3290.371482
360.1464531.34230.091563
37-0.001575-0.01440.494258
38-0.082187-0.75330.2267
39-0.015641-0.14340.443176
400.014320.13120.447946
410.040410.37040.356022
42-0.056741-0.520.302203
430.035810.32820.371788
440.029450.26990.393943
45-0.077134-0.70690.240779
460.0364720.33430.369504
47-0.077644-0.71160.239335
480.1397131.28050.101949
490.0464340.42560.335754
50-0.123452-1.13150.130541
51-0.011099-0.10170.459609
520.0532680.48820.313336
53-0.038896-0.35650.361185
540.0273250.25040.401432
550.0004480.00410.498366
56-0.035768-0.32780.371932
570.0153270.14050.44431
58-0.018115-0.1660.434266
59-0.051259-0.46980.319859
600.1089270.99830.160493


Partial Autocorrelation Function
Time lag kPACF(k)T-STATP-value
1-0.404446-3.70680.000188
2-0.494962-4.53649e-06
3-0.02308-0.21150.416491
4-0.157851-1.44670.075847
5-0.187072-1.71450.045058
60.1171181.07340.143081
7-0.058594-0.5370.296337
8-0.017965-0.16460.434808
90.0833290.76370.223587
10-0.153427-1.40620.081679
11-0.375956-3.44570.000446
120.2486812.27920.012596
130.2177791.9960.024588
140.2016021.84770.034082
15-0.069038-0.63270.264309
16-0.135389-1.24090.109055
170.0049960.04580.481794
18-0.085098-0.77990.218811
190.0109070.10.460305
200.0009380.00860.496582
21-0.043028-0.39440.347158
22-0.106908-0.97980.164992
230.0217840.19970.421116
24-0.058969-0.54050.295156
250.1410341.29260.099847
260.1050730.9630.169154
270.1065260.97630.165852
280.0456540.41840.338351
290.0523660.47990.316258
30-0.11756-1.07750.14218
31-0.100744-0.92330.179238
32-0.08177-0.74940.227845
330.0567650.52030.302125
340.0430720.39480.34701
35-0.13493-1.23670.10983
360.0393740.36090.359552
37-0.001403-0.01290.494885
380.0084240.07720.469322
39-0.006964-0.06380.47463
400.0608830.5580.289162
410.0195520.17920.429109
42-0.021167-0.1940.423324
43-0.005208-0.04770.481021
440.0631190.57850.282238
45-0.061034-0.55940.288694
460.1340161.22830.111387
470.0363950.33360.369769
480.0490320.44940.327154
49-0.010159-0.09310.463021
50-0.057284-0.5250.300478
51-0.051226-0.46950.319968
52-0.094151-0.86290.195323
53-0.027087-0.24830.402272
540.0490090.44920.327232
550.021310.19530.422812
56-0.08293-0.76010.224671
570.0357090.32730.372134
58-0.097673-0.89520.186623
590.0752230.68940.246227
60-0.026226-0.24040.405318

\begin{tabular}{lllllllll}
\hline
Partial Autocorrelation Function \tabularnewline
Time lag k & PACF(k) & T-STAT & P-value \tabularnewline
1 & -0.404446 & -3.7068 & 0.000188 \tabularnewline
2 & -0.494962 & -4.5364 & 9e-06 \tabularnewline
3 & -0.02308 & -0.2115 & 0.416491 \tabularnewline
4 & -0.157851 & -1.4467 & 0.075847 \tabularnewline
5 & -0.187072 & -1.7145 & 0.045058 \tabularnewline
6 & 0.117118 & 1.0734 & 0.143081 \tabularnewline
7 & -0.058594 & -0.537 & 0.296337 \tabularnewline
8 & -0.017965 & -0.1646 & 0.434808 \tabularnewline
9 & 0.083329 & 0.7637 & 0.223587 \tabularnewline
10 & -0.153427 & -1.4062 & 0.081679 \tabularnewline
11 & -0.375956 & -3.4457 & 0.000446 \tabularnewline
12 & 0.248681 & 2.2792 & 0.012596 \tabularnewline
13 & 0.217779 & 1.996 & 0.024588 \tabularnewline
14 & 0.201602 & 1.8477 & 0.034082 \tabularnewline
15 & -0.069038 & -0.6327 & 0.264309 \tabularnewline
16 & -0.135389 & -1.2409 & 0.109055 \tabularnewline
17 & 0.004996 & 0.0458 & 0.481794 \tabularnewline
18 & -0.085098 & -0.7799 & 0.218811 \tabularnewline
19 & 0.010907 & 0.1 & 0.460305 \tabularnewline
20 & 0.000938 & 0.0086 & 0.496582 \tabularnewline
21 & -0.043028 & -0.3944 & 0.347158 \tabularnewline
22 & -0.106908 & -0.9798 & 0.164992 \tabularnewline
23 & 0.021784 & 0.1997 & 0.421116 \tabularnewline
24 & -0.058969 & -0.5405 & 0.295156 \tabularnewline
25 & 0.141034 & 1.2926 & 0.099847 \tabularnewline
26 & 0.105073 & 0.963 & 0.169154 \tabularnewline
27 & 0.106526 & 0.9763 & 0.165852 \tabularnewline
28 & 0.045654 & 0.4184 & 0.338351 \tabularnewline
29 & 0.052366 & 0.4799 & 0.316258 \tabularnewline
30 & -0.11756 & -1.0775 & 0.14218 \tabularnewline
31 & -0.100744 & -0.9233 & 0.179238 \tabularnewline
32 & -0.08177 & -0.7494 & 0.227845 \tabularnewline
33 & 0.056765 & 0.5203 & 0.302125 \tabularnewline
34 & 0.043072 & 0.3948 & 0.34701 \tabularnewline
35 & -0.13493 & -1.2367 & 0.10983 \tabularnewline
36 & 0.039374 & 0.3609 & 0.359552 \tabularnewline
37 & -0.001403 & -0.0129 & 0.494885 \tabularnewline
38 & 0.008424 & 0.0772 & 0.469322 \tabularnewline
39 & -0.006964 & -0.0638 & 0.47463 \tabularnewline
40 & 0.060883 & 0.558 & 0.289162 \tabularnewline
41 & 0.019552 & 0.1792 & 0.429109 \tabularnewline
42 & -0.021167 & -0.194 & 0.423324 \tabularnewline
43 & -0.005208 & -0.0477 & 0.481021 \tabularnewline
44 & 0.063119 & 0.5785 & 0.282238 \tabularnewline
45 & -0.061034 & -0.5594 & 0.288694 \tabularnewline
46 & 0.134016 & 1.2283 & 0.111387 \tabularnewline
47 & 0.036395 & 0.3336 & 0.369769 \tabularnewline
48 & 0.049032 & 0.4494 & 0.327154 \tabularnewline
49 & -0.010159 & -0.0931 & 0.463021 \tabularnewline
50 & -0.057284 & -0.525 & 0.300478 \tabularnewline
51 & -0.051226 & -0.4695 & 0.319968 \tabularnewline
52 & -0.094151 & -0.8629 & 0.195323 \tabularnewline
53 & -0.027087 & -0.2483 & 0.402272 \tabularnewline
54 & 0.049009 & 0.4492 & 0.327232 \tabularnewline
55 & 0.02131 & 0.1953 & 0.422812 \tabularnewline
56 & -0.08293 & -0.7601 & 0.224671 \tabularnewline
57 & 0.035709 & 0.3273 & 0.372134 \tabularnewline
58 & -0.097673 & -0.8952 & 0.186623 \tabularnewline
59 & 0.075223 & 0.6894 & 0.246227 \tabularnewline
60 & -0.026226 & -0.2404 & 0.405318 \tabularnewline
\hline
\end{tabular}
%Source: https://freestatistics.org/blog/index.php?pk=30714&T=2

[TABLE]
[ROW][C]Partial Autocorrelation Function[/C][/ROW]
[ROW][C]Time lag k[/C][C]PACF(k)[/C][C]T-STAT[/C][C]P-value[/C][/ROW]
[ROW][C]1[/C][C]-0.404446[/C][C]-3.7068[/C][C]0.000188[/C][/ROW]
[ROW][C]2[/C][C]-0.494962[/C][C]-4.5364[/C][C]9e-06[/C][/ROW]
[ROW][C]3[/C][C]-0.02308[/C][C]-0.2115[/C][C]0.416491[/C][/ROW]
[ROW][C]4[/C][C]-0.157851[/C][C]-1.4467[/C][C]0.075847[/C][/ROW]
[ROW][C]5[/C][C]-0.187072[/C][C]-1.7145[/C][C]0.045058[/C][/ROW]
[ROW][C]6[/C][C]0.117118[/C][C]1.0734[/C][C]0.143081[/C][/ROW]
[ROW][C]7[/C][C]-0.058594[/C][C]-0.537[/C][C]0.296337[/C][/ROW]
[ROW][C]8[/C][C]-0.017965[/C][C]-0.1646[/C][C]0.434808[/C][/ROW]
[ROW][C]9[/C][C]0.083329[/C][C]0.7637[/C][C]0.223587[/C][/ROW]
[ROW][C]10[/C][C]-0.153427[/C][C]-1.4062[/C][C]0.081679[/C][/ROW]
[ROW][C]11[/C][C]-0.375956[/C][C]-3.4457[/C][C]0.000446[/C][/ROW]
[ROW][C]12[/C][C]0.248681[/C][C]2.2792[/C][C]0.012596[/C][/ROW]
[ROW][C]13[/C][C]0.217779[/C][C]1.996[/C][C]0.024588[/C][/ROW]
[ROW][C]14[/C][C]0.201602[/C][C]1.8477[/C][C]0.034082[/C][/ROW]
[ROW][C]15[/C][C]-0.069038[/C][C]-0.6327[/C][C]0.264309[/C][/ROW]
[ROW][C]16[/C][C]-0.135389[/C][C]-1.2409[/C][C]0.109055[/C][/ROW]
[ROW][C]17[/C][C]0.004996[/C][C]0.0458[/C][C]0.481794[/C][/ROW]
[ROW][C]18[/C][C]-0.085098[/C][C]-0.7799[/C][C]0.218811[/C][/ROW]
[ROW][C]19[/C][C]0.010907[/C][C]0.1[/C][C]0.460305[/C][/ROW]
[ROW][C]20[/C][C]0.000938[/C][C]0.0086[/C][C]0.496582[/C][/ROW]
[ROW][C]21[/C][C]-0.043028[/C][C]-0.3944[/C][C]0.347158[/C][/ROW]
[ROW][C]22[/C][C]-0.106908[/C][C]-0.9798[/C][C]0.164992[/C][/ROW]
[ROW][C]23[/C][C]0.021784[/C][C]0.1997[/C][C]0.421116[/C][/ROW]
[ROW][C]24[/C][C]-0.058969[/C][C]-0.5405[/C][C]0.295156[/C][/ROW]
[ROW][C]25[/C][C]0.141034[/C][C]1.2926[/C][C]0.099847[/C][/ROW]
[ROW][C]26[/C][C]0.105073[/C][C]0.963[/C][C]0.169154[/C][/ROW]
[ROW][C]27[/C][C]0.106526[/C][C]0.9763[/C][C]0.165852[/C][/ROW]
[ROW][C]28[/C][C]0.045654[/C][C]0.4184[/C][C]0.338351[/C][/ROW]
[ROW][C]29[/C][C]0.052366[/C][C]0.4799[/C][C]0.316258[/C][/ROW]
[ROW][C]30[/C][C]-0.11756[/C][C]-1.0775[/C][C]0.14218[/C][/ROW]
[ROW][C]31[/C][C]-0.100744[/C][C]-0.9233[/C][C]0.179238[/C][/ROW]
[ROW][C]32[/C][C]-0.08177[/C][C]-0.7494[/C][C]0.227845[/C][/ROW]
[ROW][C]33[/C][C]0.056765[/C][C]0.5203[/C][C]0.302125[/C][/ROW]
[ROW][C]34[/C][C]0.043072[/C][C]0.3948[/C][C]0.34701[/C][/ROW]
[ROW][C]35[/C][C]-0.13493[/C][C]-1.2367[/C][C]0.10983[/C][/ROW]
[ROW][C]36[/C][C]0.039374[/C][C]0.3609[/C][C]0.359552[/C][/ROW]
[ROW][C]37[/C][C]-0.001403[/C][C]-0.0129[/C][C]0.494885[/C][/ROW]
[ROW][C]38[/C][C]0.008424[/C][C]0.0772[/C][C]0.469322[/C][/ROW]
[ROW][C]39[/C][C]-0.006964[/C][C]-0.0638[/C][C]0.47463[/C][/ROW]
[ROW][C]40[/C][C]0.060883[/C][C]0.558[/C][C]0.289162[/C][/ROW]
[ROW][C]41[/C][C]0.019552[/C][C]0.1792[/C][C]0.429109[/C][/ROW]
[ROW][C]42[/C][C]-0.021167[/C][C]-0.194[/C][C]0.423324[/C][/ROW]
[ROW][C]43[/C][C]-0.005208[/C][C]-0.0477[/C][C]0.481021[/C][/ROW]
[ROW][C]44[/C][C]0.063119[/C][C]0.5785[/C][C]0.282238[/C][/ROW]
[ROW][C]45[/C][C]-0.061034[/C][C]-0.5594[/C][C]0.288694[/C][/ROW]
[ROW][C]46[/C][C]0.134016[/C][C]1.2283[/C][C]0.111387[/C][/ROW]
[ROW][C]47[/C][C]0.036395[/C][C]0.3336[/C][C]0.369769[/C][/ROW]
[ROW][C]48[/C][C]0.049032[/C][C]0.4494[/C][C]0.327154[/C][/ROW]
[ROW][C]49[/C][C]-0.010159[/C][C]-0.0931[/C][C]0.463021[/C][/ROW]
[ROW][C]50[/C][C]-0.057284[/C][C]-0.525[/C][C]0.300478[/C][/ROW]
[ROW][C]51[/C][C]-0.051226[/C][C]-0.4695[/C][C]0.319968[/C][/ROW]
[ROW][C]52[/C][C]-0.094151[/C][C]-0.8629[/C][C]0.195323[/C][/ROW]
[ROW][C]53[/C][C]-0.027087[/C][C]-0.2483[/C][C]0.402272[/C][/ROW]
[ROW][C]54[/C][C]0.049009[/C][C]0.4492[/C][C]0.327232[/C][/ROW]
[ROW][C]55[/C][C]0.02131[/C][C]0.1953[/C][C]0.422812[/C][/ROW]
[ROW][C]56[/C][C]-0.08293[/C][C]-0.7601[/C][C]0.224671[/C][/ROW]
[ROW][C]57[/C][C]0.035709[/C][C]0.3273[/C][C]0.372134[/C][/ROW]
[ROW][C]58[/C][C]-0.097673[/C][C]-0.8952[/C][C]0.186623[/C][/ROW]
[ROW][C]59[/C][C]0.075223[/C][C]0.6894[/C][C]0.246227[/C][/ROW]
[ROW][C]60[/C][C]-0.026226[/C][C]-0.2404[/C][C]0.405318[/C][/ROW]
[/TABLE]
Source: https://freestatistics.org/blog/index.php?pk=30714&T=2

Globally Unique Identifier (entire table): ba.freestatistics.org/blog/index.php?pk=30714&T=2

As an alternative you can also use a QR Code:  

The GUIDs for individual cells are displayed in the table below:

Partial Autocorrelation Function
Time lag kPACF(k)T-STATP-value
1-0.404446-3.70680.000188
2-0.494962-4.53649e-06
3-0.02308-0.21150.416491
4-0.157851-1.44670.075847
5-0.187072-1.71450.045058
60.1171181.07340.143081
7-0.058594-0.5370.296337
8-0.017965-0.16460.434808
90.0833290.76370.223587
10-0.153427-1.40620.081679
11-0.375956-3.44570.000446
120.2486812.27920.012596
130.2177791.9960.024588
140.2016021.84770.034082
15-0.069038-0.63270.264309
16-0.135389-1.24090.109055
170.0049960.04580.481794
18-0.085098-0.77990.218811
190.0109070.10.460305
200.0009380.00860.496582
21-0.043028-0.39440.347158
22-0.106908-0.97980.164992
230.0217840.19970.421116
24-0.058969-0.54050.295156
250.1410341.29260.099847
260.1050730.9630.169154
270.1065260.97630.165852
280.0456540.41840.338351
290.0523660.47990.316258
30-0.11756-1.07750.14218
31-0.100744-0.92330.179238
32-0.08177-0.74940.227845
330.0567650.52030.302125
340.0430720.39480.34701
35-0.13493-1.23670.10983
360.0393740.36090.359552
37-0.001403-0.01290.494885
380.0084240.07720.469322
39-0.006964-0.06380.47463
400.0608830.5580.289162
410.0195520.17920.429109
42-0.021167-0.1940.423324
43-0.005208-0.04770.481021
440.0631190.57850.282238
45-0.061034-0.55940.288694
460.1340161.22830.111387
470.0363950.33360.369769
480.0490320.44940.327154
49-0.010159-0.09310.463021
50-0.057284-0.5250.300478
51-0.051226-0.46950.319968
52-0.094151-0.86290.195323
53-0.027087-0.24830.402272
540.0490090.44920.327232
550.021310.19530.422812
56-0.08293-0.76010.224671
570.0357090.32730.372134
58-0.097673-0.89520.186623
590.0752230.68940.246227
60-0.026226-0.24040.405318


Parameters (Session):
par1 = 60 ; par2 = 1 ; par3 = 1 ; par4 = 0 ; par5 = 12 ;
Parameters (R input):
par1 = 60 ; par2 = 1 ; par3 = 1 ; par4 = 0 ; par5 = 12 ;
R code (references can be found in the software module):
if (par1 == 'Default') {
par1 = 10*log10(length(x))
} else {
par1 <- as.numeric(par1)
}
par2 <- as.numeric(par2)
par3 <- as.numeric(par3)
par4 <- as.numeric(par4)
par5 <- as.numeric(par5)
if (par2 == 0) {
x <- log(x)
} else {
x <- (x ^ par2 - 1) / par2
}
if (par3 > 0) x <- diff(x,lag=1,difference=par3)
if (par4 > 0) x <- diff(x,lag=par5,difference=par4)
bitmap(file='pic1.png')
racf <- acf(x,par1,main='Autocorrelation',xlab='lags',ylab='ACF')
dev.off()
bitmap(file='pic2.png')
rpacf <- pacf(x,par1,main='Partial Autocorrelation',xlab='lags',ylab='PACF')
dev.off()
(myacf <- c(racf$acf))
(mypacf <- c(rpacf$acf))
lengthx <- length(x)
sqrtn <- sqrt(lengthx)
load(file='createtable')
a<-table.start()
a<-table.row.start(a)
a<-table.element(a,'Autocorrelation Function',4,TRUE)
a<-table.row.end(a)
a<-table.row.start(a)
a<-table.element(a,'Time lag k',header=TRUE)
a<-table.element(a,hyperlink('basics.htm','ACF(k)','click here for more information about the Autocorrelation Function'),header=TRUE)
a<-table.element(a,'T-STAT',header=TRUE)
a<-table.element(a,'P-value',header=TRUE)
a<-table.row.end(a)
for (i in 2:(par1+1)) {
a<-table.row.start(a)
a<-table.element(a,i-1,header=TRUE)
a<-table.element(a,round(myacf[i],6))
mytstat <- myacf[i]*sqrtn
a<-table.element(a,round(mytstat,4))
a<-table.element(a,round(1-pt(abs(mytstat),lengthx),6))
a<-table.row.end(a)
}
a<-table.end(a)
table.save(a,file='mytable.tab')
a<-table.start()
a<-table.row.start(a)
a<-table.element(a,'Partial Autocorrelation Function',4,TRUE)
a<-table.row.end(a)
a<-table.row.start(a)
a<-table.element(a,'Time lag k',header=TRUE)
a<-table.element(a,hyperlink('basics.htm','PACF(k)','click here for more information about the Partial Autocorrelation Function'),header=TRUE)
a<-table.element(a,'T-STAT',header=TRUE)
a<-table.element(a,'P-value',header=TRUE)
a<-table.row.end(a)
for (i in 1:par1) {
a<-table.row.start(a)
a<-table.element(a,i,header=TRUE)
a<-table.element(a,round(mypacf[i],6))
mytstat <- mypacf[i]*sqrtn
a<-table.element(a,round(mytstat,4))
a<-table.element(a,round(1-pt(abs(mytstat),lengthx),6))
a<-table.row.end(a)
}
a<-table.end(a)
table.save(a,file='mytable1.tab')