Free Statistics

of Irreproducible Research!

Author's title

Author*The author of this computation has been verified*
R Software Modulerwasp_spectrum.wasp
Title produced by softwareSpectral Analysis
Date of computationMon, 08 Dec 2008 11:56:38 -0700
Cite this page as followsStatistical Computations at FreeStatistics.org, Office for Research Development and Education, URL https://freestatistics.org/blog/index.php?v=date/2008/Dec/08/t12287626518lzzu2z4c31lze2.htm/, Retrieved Thu, 16 May 2024 13:36:02 +0000
Statistical Computations at FreeStatistics.org, Office for Research Development and Education, URL https://freestatistics.org/blog/index.php?pk=30711, Retrieved Thu, 16 May 2024 13:36:02 +0000
QR Codes:

Original text written by user:
IsPrivate?No (this computation is public)
User-defined keywords
Estimated Impact206
Family? (F = Feedback message, R = changed R code, M = changed R Module, P = changed Parameters, D = changed Data)
-     [Spectral Analysis] [Unemployment - St...] [2008-12-08 17:28:52] [57850c80fd59ccfb28f882be994e814e]
F         [Spectral Analysis] [STEP 2 3] [2008-12-08 18:56:38] [e11d930c9e2984715c66c796cf63ef19] [Current]
Feedback Forum
2008-12-11 13:23:13 [72e979bcc364082694890d2eccc1a66f] [reply
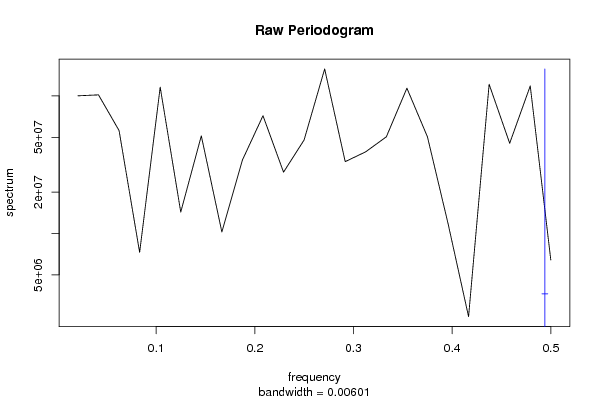
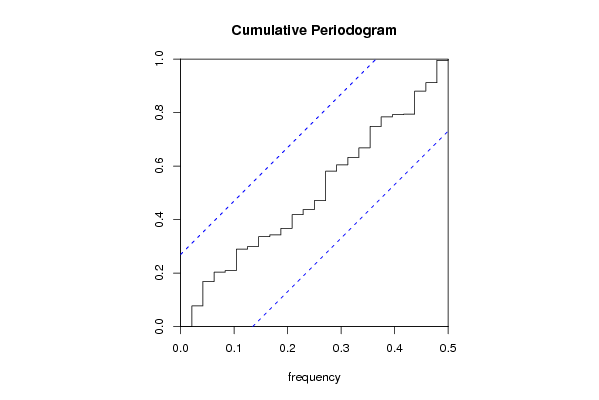
Door d en D eenmaal te differentiëren zien we dat we nu te maken hebben met een stationaire trend. Het cumulatief periodogram valt volledig binnen het betrouwbaarheidsinterval. We kunnen dus geen trend of seizoenaliteit meer waarnemen.
De student heeft dit correct uitgevoerd maar er wordt weinig uitleg gegeven.
2008-12-13 20:54:08 [Li Tang Hu] [reply
omdat je ook hier weer lambda gelijk gesteld hebt aan 1 kom je een ander resultaat uit. met d=1 en D=1 is de trend er duidlijk uit, maar in je grafieken kunnen we nog duidlijk seizoensinvloeden waarnemen. het trapjespatroon is helemaal niet weg, ik zou in dit geval dus nog eens seizoenaal differntieeren (D=2) en zien wat je dan uitkomt.
wanneer je de lambdawaarde wel had ingesteld zou je maar 1keer seizoenaal en trendmatig moeten differentieren om de tijdreeks stationair proberen te maken.
2008-12-13 21:53:44 [Li Tang Hu] [reply
je moet hier dus controleren of na de differentiatie de tijdreeks stationair is. dit gaan we zowel op ACF als op de raw en cumulatieve periodogram kunnen zien. in jouw grafiek zijn er nog duidelijk seizoensinvloeden te zien, dus kunnen ze stellen dat de tijdreeks niet volledig stationair is...we gaan dus op zoek moeten gaan naar AR- en/of MA processen die onze tijdreeks beinvloeden.
2008-12-14 10:32:43 [Stéphanie Claes] [reply
Het dalende patroon is verdwenen en de pieken staan niet meer op regelmatige afstand van elkaar. De tijdreeks is stationair gemaakt.
Uit het cumulatief periodogram kunnen we afleiden dat er inderdaad nog seizonaliteit aanwezig is. Dit zullen we moeten wegwerken met een AR of een MA proces.
2008-12-14 10:47:56 [94a54c888ac7f7d6874c3108eb0e1808] [reply
De tijdreeks is stationair gemaakt. Het cumulatief periodogram valt volledig binnen het betrouwbaarheidsinterval van 95%. We kunnen dus geen trend of seizoenaliteit meer waarnemen.
2008-12-14 11:07:27 [Matthieu Blondeau] [reply
Ook hier heeft de student eerst berekent met d=0 en D=0 om daarna deze parameters aan te passen. Er is dan een trend te zien en in de Cumulative Periodogram valt de lijn buiten de betrouwbaarheidsinterval. Wanneer de student de waarden aanpast kan men in de Raw een geleidelijker verloop aflezen en in de Cumulative valt de lijn binnen de betrouwbaarheidsinterval maar er is nog altijd een trappend verloop.

Post a new message
Dataseries X:
569323
579714
577992
565464
547344
554788
562325
560854
555332
543599
536662
542722
593530
610763
612613
611324
594167
595454
590865
589379
584428
573100
567456
569028
620735
628884
628232
612117
595404
597141
593408
590072
579799
574205
572775
572942
619567
625809
619916
587625
565742
557274
560576
548854
531673
525919
511038
498662
555362
564591
541657
527070
509846
514258
516922
507561
492622
490243
469357
477580
528379


Summary of computational transaction
Raw Inputview raw input (R code)
Raw Outputview raw output of R engine
Computing time1 seconds
R Server'Gwilym Jenkins' @ 72.249.127.135

\begin{tabular}{lllllllll}
\hline
Summary of computational transaction \tabularnewline
Raw Input & view raw input (R code)  \tabularnewline
Raw Output & view raw output of R engine  \tabularnewline
Computing time & 1 seconds \tabularnewline
R Server & 'Gwilym Jenkins' @ 72.249.127.135 \tabularnewline
\hline
\end{tabular}
%Source: https://freestatistics.org/blog/index.php?pk=30711&T=0

[TABLE]
[ROW][C]Summary of computational transaction[/C][/ROW]
[ROW][C]Raw Input[/C][C]view raw input (R code) [/C][/ROW]
[ROW][C]Raw Output[/C][C]view raw output of R engine [/C][/ROW]
[ROW][C]Computing time[/C][C]1 seconds[/C][/ROW]
[ROW][C]R Server[/C][C]'Gwilym Jenkins' @ 72.249.127.135[/C][/ROW]
[/TABLE]
Source: https://freestatistics.org/blog/index.php?pk=30711&T=0

Globally Unique Identifier (entire table): ba.freestatistics.org/blog/index.php?pk=30711&T=0

As an alternative you can also use a QR Code:  

The GUIDs for individual cells are displayed in the table below:

Summary of computational transaction
Raw Inputview raw input (R code)
Raw Outputview raw output of R engine
Computing time1 seconds
R Server'Gwilym Jenkins' @ 72.249.127.135


Raw Periodogram
ParameterValue
Box-Cox transformation parameter (lambda)1
Degree of non-seasonal differencing (d)1
Degree of seasonal differencing (D)1
Seasonal Period (s)12
Frequency (Period)Spectrum
0.0208 (48)100270846.729248
0.0417 (24)101857150.885389
0.0625 (16)56008655.679396
0.0833 (12)7273636.644526
0.1042 (9.6)115869850.325455
0.125 (8)14302931.059639
0.1458 (6.8571)51272468.651275
0.1667 (6)10238280.063963
0.1875 (5.3333)34185743.34003
0.2083 (4.8)71841282.396453
0.2292 (4.3636)27897329.669252
0.25 (4)47841210.146026
0.2708 (3.6923)157244992.48216
0.2917 (3.4286)33256131.521845
0.3125 (3.2)39271133.480745
0.3333 (3)50421524.046216
0.3542 (2.8235)113951268.970108
0.375 (2.6667)50434628.01532
0.3958 (2.5263)11824634.842019
0.4167 (2.4)2478608.895135
0.4375 (2.2857)121632123.089855
0.4583 (2.1818)45267013.689176
0.4792 (2.087)118338824.932604
0.5 (2)6402399.534773

\begin{tabular}{lllllllll}
\hline
Raw Periodogram \tabularnewline
Parameter & Value \tabularnewline
Box-Cox transformation parameter (lambda) & 1 \tabularnewline
Degree of non-seasonal differencing (d) & 1 \tabularnewline
Degree of seasonal differencing (D) & 1 \tabularnewline
Seasonal Period (s) & 12 \tabularnewline
Frequency (Period) & Spectrum \tabularnewline
0.0208 (48) & 100270846.729248 \tabularnewline
0.0417 (24) & 101857150.885389 \tabularnewline
0.0625 (16) & 56008655.679396 \tabularnewline
0.0833 (12) & 7273636.644526 \tabularnewline
0.1042 (9.6) & 115869850.325455 \tabularnewline
0.125 (8) & 14302931.059639 \tabularnewline
0.1458 (6.8571) & 51272468.651275 \tabularnewline
0.1667 (6) & 10238280.063963 \tabularnewline
0.1875 (5.3333) & 34185743.34003 \tabularnewline
0.2083 (4.8) & 71841282.396453 \tabularnewline
0.2292 (4.3636) & 27897329.669252 \tabularnewline
0.25 (4) & 47841210.146026 \tabularnewline
0.2708 (3.6923) & 157244992.48216 \tabularnewline
0.2917 (3.4286) & 33256131.521845 \tabularnewline
0.3125 (3.2) & 39271133.480745 \tabularnewline
0.3333 (3) & 50421524.046216 \tabularnewline
0.3542 (2.8235) & 113951268.970108 \tabularnewline
0.375 (2.6667) & 50434628.01532 \tabularnewline
0.3958 (2.5263) & 11824634.842019 \tabularnewline
0.4167 (2.4) & 2478608.895135 \tabularnewline
0.4375 (2.2857) & 121632123.089855 \tabularnewline
0.4583 (2.1818) & 45267013.689176 \tabularnewline
0.4792 (2.087) & 118338824.932604 \tabularnewline
0.5 (2) & 6402399.534773 \tabularnewline
\hline
\end{tabular}
%Source: https://freestatistics.org/blog/index.php?pk=30711&T=1

[TABLE]
[ROW][C]Raw Periodogram[/C][/ROW]
[ROW][C]Parameter[/C][C]Value[/C][/ROW]
[ROW][C]Box-Cox transformation parameter (lambda)[/C][C]1[/C][/ROW]
[ROW][C]Degree of non-seasonal differencing (d)[/C][C]1[/C][/ROW]
[ROW][C]Degree of seasonal differencing (D)[/C][C]1[/C][/ROW]
[ROW][C]Seasonal Period (s)[/C][C]12[/C][/ROW]
[ROW][C]Frequency (Period)[/C][C]Spectrum[/C][/ROW]
[ROW][C]0.0208 (48)[/C][C]100270846.729248[/C][/ROW]
[ROW][C]0.0417 (24)[/C][C]101857150.885389[/C][/ROW]
[ROW][C]0.0625 (16)[/C][C]56008655.679396[/C][/ROW]
[ROW][C]0.0833 (12)[/C][C]7273636.644526[/C][/ROW]
[ROW][C]0.1042 (9.6)[/C][C]115869850.325455[/C][/ROW]
[ROW][C]0.125 (8)[/C][C]14302931.059639[/C][/ROW]
[ROW][C]0.1458 (6.8571)[/C][C]51272468.651275[/C][/ROW]
[ROW][C]0.1667 (6)[/C][C]10238280.063963[/C][/ROW]
[ROW][C]0.1875 (5.3333)[/C][C]34185743.34003[/C][/ROW]
[ROW][C]0.2083 (4.8)[/C][C]71841282.396453[/C][/ROW]
[ROW][C]0.2292 (4.3636)[/C][C]27897329.669252[/C][/ROW]
[ROW][C]0.25 (4)[/C][C]47841210.146026[/C][/ROW]
[ROW][C]0.2708 (3.6923)[/C][C]157244992.48216[/C][/ROW]
[ROW][C]0.2917 (3.4286)[/C][C]33256131.521845[/C][/ROW]
[ROW][C]0.3125 (3.2)[/C][C]39271133.480745[/C][/ROW]
[ROW][C]0.3333 (3)[/C][C]50421524.046216[/C][/ROW]
[ROW][C]0.3542 (2.8235)[/C][C]113951268.970108[/C][/ROW]
[ROW][C]0.375 (2.6667)[/C][C]50434628.01532[/C][/ROW]
[ROW][C]0.3958 (2.5263)[/C][C]11824634.842019[/C][/ROW]
[ROW][C]0.4167 (2.4)[/C][C]2478608.895135[/C][/ROW]
[ROW][C]0.4375 (2.2857)[/C][C]121632123.089855[/C][/ROW]
[ROW][C]0.4583 (2.1818)[/C][C]45267013.689176[/C][/ROW]
[ROW][C]0.4792 (2.087)[/C][C]118338824.932604[/C][/ROW]
[ROW][C]0.5 (2)[/C][C]6402399.534773[/C][/ROW]
[/TABLE]
Source: https://freestatistics.org/blog/index.php?pk=30711&T=1

Globally Unique Identifier (entire table): ba.freestatistics.org/blog/index.php?pk=30711&T=1

As an alternative you can also use a QR Code:  

The GUIDs for individual cells are displayed in the table below:

Raw Periodogram
ParameterValue
Box-Cox transformation parameter (lambda)1
Degree of non-seasonal differencing (d)1
Degree of seasonal differencing (D)1
Seasonal Period (s)12
Frequency (Period)Spectrum
0.0208 (48)100270846.729248
0.0417 (24)101857150.885389
0.0625 (16)56008655.679396
0.0833 (12)7273636.644526
0.1042 (9.6)115869850.325455
0.125 (8)14302931.059639
0.1458 (6.8571)51272468.651275
0.1667 (6)10238280.063963
0.1875 (5.3333)34185743.34003
0.2083 (4.8)71841282.396453
0.2292 (4.3636)27897329.669252
0.25 (4)47841210.146026
0.2708 (3.6923)157244992.48216
0.2917 (3.4286)33256131.521845
0.3125 (3.2)39271133.480745
0.3333 (3)50421524.046216
0.3542 (2.8235)113951268.970108
0.375 (2.6667)50434628.01532
0.3958 (2.5263)11824634.842019
0.4167 (2.4)2478608.895135
0.4375 (2.2857)121632123.089855
0.4583 (2.1818)45267013.689176
0.4792 (2.087)118338824.932604
0.5 (2)6402399.534773


Parameters (Session):
par1 = 1 ; par2 = 1 ; par3 = 1 ; par4 = 12 ;
Parameters (R input):
par1 = 1 ; par2 = 1 ; par3 = 1 ; par4 = 12 ; par5 = ; par6 = ; par7 = ; par8 = ; par9 = ; par10 = ; par11 = ; par12 = ; par13 = ; par14 = ; par15 = ; par16 = ; par17 = ; par18 = ; par19 = ; par20 = ;
R code (references can be found in the software module):
par1 <- as.numeric(par1)
par2 <- as.numeric(par2)
par3 <- as.numeric(par3)
par4 <- as.numeric(par4)
if (par1 == 0) {
x <- log(x)
} else {
x <- (x ^ par1 - 1) / par1
}
if (par2 > 0) x <- diff(x,lag=1,difference=par2)
if (par3 > 0) x <- diff(x,lag=par4,difference=par3)
bitmap(file='test1.png')
r <- spectrum(x,main='Raw Periodogram')
dev.off()
bitmap(file='test2.png')
cpgram(x,main='Cumulative Periodogram')
dev.off()
load(file='createtable')
a<-table.start()
a<-table.row.start(a)
a<-table.element(a,'Raw Periodogram',2,TRUE)
a<-table.row.end(a)
a<-table.row.start(a)
a<-table.element(a,'Parameter',header=TRUE)
a<-table.element(a,'Value',header=TRUE)
a<-table.row.end(a)
a<-table.row.start(a)
a<-table.element(a,'Box-Cox transformation parameter (lambda)',header=TRUE)
a<-table.element(a,par1)
a<-table.row.end(a)
a<-table.row.start(a)
a<-table.element(a,'Degree of non-seasonal differencing (d)',header=TRUE)
a<-table.element(a,par2)
a<-table.row.end(a)
a<-table.row.start(a)
a<-table.element(a,'Degree of seasonal differencing (D)',header=TRUE)
a<-table.element(a,par3)
a<-table.row.end(a)
a<-table.row.start(a)
a<-table.element(a,'Seasonal Period (s)',header=TRUE)
a<-table.element(a,par4)
a<-table.row.end(a)
a<-table.row.start(a)
a<-table.element(a,'Frequency (Period)',header=TRUE)
a<-table.element(a,'Spectrum',header=TRUE)
a<-table.row.end(a)
for (i in 1:length(r$freq)) {
a<-table.row.start(a)
mylab <- round(r$freq[i],4)
mylab <- paste(mylab,' (',sep='')
mylab <- paste(mylab,round(1/r$freq[i],4),sep='')
mylab <- paste(mylab,')',sep='')
a<-table.element(a,mylab,header=TRUE)
a<-table.element(a,round(r$spec[i],6))
a<-table.row.end(a)
}
a<-table.end(a)
table.save(a,file='mytable.tab')