Free Statistics

of Irreproducible Research!

Author's title

Author*The author of this computation has been verified*
R Software Modulerwasp_autocorrelation.wasp
Title produced by software(Partial) Autocorrelation Function
Date of computationMon, 08 Dec 2008 11:53:29 -0700
Cite this page as followsStatistical Computations at FreeStatistics.org, Office for Research Development and Education, URL https://freestatistics.org/blog/index.php?v=date/2008/Dec/08/t1228762451xveyzzo7fcrf1rr.htm/, Retrieved Thu, 16 May 2024 16:50:05 +0000
Statistical Computations at FreeStatistics.org, Office for Research Development and Education, URL https://freestatistics.org/blog/index.php?pk=30702, Retrieved Thu, 16 May 2024 16:50:05 +0000
QR Codes:

Original text written by user:
IsPrivate?No (this computation is public)
User-defined keywords
Estimated Impact160
Family? (F = Feedback message, R = changed R code, M = changed R Module, P = changed Parameters, D = changed Data)
-     [Univariate Data Series] [data set] [2008-12-01 19:54:57] [b98453cac15ba1066b407e146608df68]
F RMPD    [(Partial) Autocorrelation Function] [S2 - ACF] [2008-12-08 18:53:29] [5f3e73ccf1ddc75508eed47fa51813d3] [Current]
Feedback Forum
2008-12-14 12:52:13 [Jeroen Michel] [reply
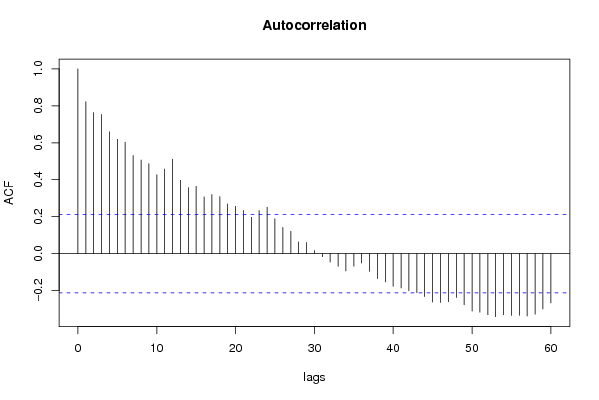
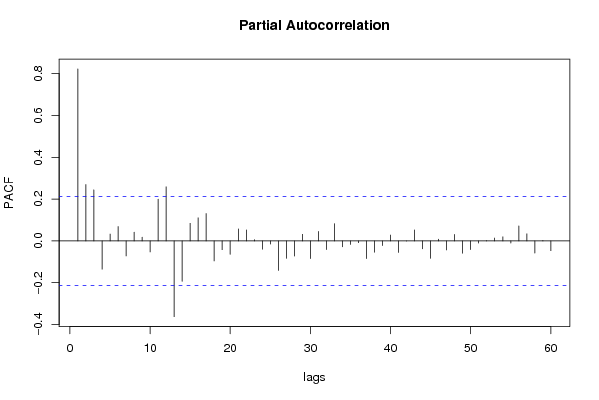
Ook hier stelt de student vast dat er een langetermijn trend valt op te tekenen en dat deze kunnen worden weggewerkt met een nieuwe/volgende berekening.Ook hier werden de parameters correct ingesteld.
2008-12-14 14:26:05 [Nathalie Koulouris] [reply
De student heeft de vraag correct opgelost en de juiste conclusies getrokken. Er is inderdaad een lange termijn trend zichtbaar. Uitzindelijk is het ook nodig om de seizoenaliteit eruit te halen.

Post a new message
Dataseries X:
14897
13063
12604
13630
14421
13978
12928
13430
13470
14786
14292
14309
14013
13241
12153
14290
15669
14170
14570
14469
14265
15321
14434
13692
14194
13519
11858
14616
15643
14077
14888
14160
14643
17193
15386
14287
17527
14497
14398
16630
16671
16615
16869
15664
16360
18448
16889
16505
18321
15052
15700
18135
16769
18883
19021
18102
17776
21490
17065
18690
18953
16399
16896
18553
19270
19422
17579
18637
18077
20439
18075
19563
19899
19228
17790
19221
22059
21231
19504
23913
23166
23574
25002
22604
23409


Summary of computational transaction
Raw Inputview raw input (R code)
Raw Outputview raw output of R engine
Computing time3 seconds
R Server'Herman Ole Andreas Wold' @ 193.190.124.10:1001

\begin{tabular}{lllllllll}
\hline
Summary of computational transaction \tabularnewline
Raw Input & view raw input (R code)  \tabularnewline
Raw Output & view raw output of R engine  \tabularnewline
Computing time & 3 seconds \tabularnewline
R Server & 'Herman Ole Andreas Wold' @ 193.190.124.10:1001 \tabularnewline
\hline
\end{tabular}
%Source: https://freestatistics.org/blog/index.php?pk=30702&T=0

[TABLE]
[ROW][C]Summary of computational transaction[/C][/ROW]
[ROW][C]Raw Input[/C][C]view raw input (R code) [/C][/ROW]
[ROW][C]Raw Output[/C][C]view raw output of R engine [/C][/ROW]
[ROW][C]Computing time[/C][C]3 seconds[/C][/ROW]
[ROW][C]R Server[/C][C]'Herman Ole Andreas Wold' @ 193.190.124.10:1001[/C][/ROW]
[/TABLE]
Source: https://freestatistics.org/blog/index.php?pk=30702&T=0

Globally Unique Identifier (entire table): ba.freestatistics.org/blog/index.php?pk=30702&T=0

As an alternative you can also use a QR Code:  

The GUIDs for individual cells are displayed in the table below:

Summary of computational transaction
Raw Inputview raw input (R code)
Raw Outputview raw output of R engine
Computing time3 seconds
R Server'Herman Ole Andreas Wold' @ 193.190.124.10:1001


Autocorrelation Function
Time lag kACF(k)T-STATP-value
10.8223837.5820
20.7636247.04030
30.7536696.94850
40.6594946.08020
50.6192255.7090
60.6030335.55970
70.5307644.89342e-06
80.5068574.6736e-06
90.4871264.49111.1e-05
100.4271513.93818.4e-05
110.4574984.21793.1e-05
120.5112184.71325e-06
130.3967153.65750.00022
140.3577753.29850.00071
150.3641723.35750.000589
160.3071482.83180.002889
170.3197092.94760.002067
180.3085152.84440.002787
190.2692082.4820.007517
200.255932.35960.010294
210.2330942.1490.017238
220.1966451.8130.036682
230.2331942.14990.0172
240.2515742.31940.011386
250.1882481.73560.043133
260.1413831.30350.097964
270.1207111.11290.134444
280.0633230.58380.280448
290.0601890.55490.290207
300.0161060.14850.441156
31-0.017006-0.15680.437892
32-0.046212-0.4260.335574
33-0.068974-0.63590.263272
34-0.093736-0.86420.194955
35-0.068077-0.62760.265961
36-0.050446-0.46510.321528
37-0.096818-0.89260.187292
38-0.134998-1.24460.108347
39-0.15377-1.41770.079968
40-0.176994-1.63180.05321
41-0.186345-1.7180.044717
42-0.201872-1.86120.033089
43-0.211482-1.94980.02725
44-0.232971-2.14790.017284
45-0.262432-2.41950.008837
46-0.264283-2.43660.008457
47-0.261195-2.40810.009099
48-0.237729-2.19180.015566
49-0.277682-2.56010.006116
50-0.311213-2.86920.002595
51-0.317582-2.9280.002189
52-0.3312-3.05350.00151
53-0.341606-3.14950.001129
54-0.331273-3.05420.001507
55-0.335151-3.08990.001353
56-0.334489-3.08380.001378
57-0.338543-3.12120.00123
58-0.328609-3.02960.001622
59-0.300136-2.76710.003469
60-0.267498-2.46620.007832

\begin{tabular}{lllllllll}
\hline
Autocorrelation Function \tabularnewline
Time lag k & ACF(k) & T-STAT & P-value \tabularnewline
1 & 0.822383 & 7.582 & 0 \tabularnewline
2 & 0.763624 & 7.0403 & 0 \tabularnewline
3 & 0.753669 & 6.9485 & 0 \tabularnewline
4 & 0.659494 & 6.0802 & 0 \tabularnewline
5 & 0.619225 & 5.709 & 0 \tabularnewline
6 & 0.603033 & 5.5597 & 0 \tabularnewline
7 & 0.530764 & 4.8934 & 2e-06 \tabularnewline
8 & 0.506857 & 4.673 & 6e-06 \tabularnewline
9 & 0.487126 & 4.4911 & 1.1e-05 \tabularnewline
10 & 0.427151 & 3.9381 & 8.4e-05 \tabularnewline
11 & 0.457498 & 4.2179 & 3.1e-05 \tabularnewline
12 & 0.511218 & 4.7132 & 5e-06 \tabularnewline
13 & 0.396715 & 3.6575 & 0.00022 \tabularnewline
14 & 0.357775 & 3.2985 & 0.00071 \tabularnewline
15 & 0.364172 & 3.3575 & 0.000589 \tabularnewline
16 & 0.307148 & 2.8318 & 0.002889 \tabularnewline
17 & 0.319709 & 2.9476 & 0.002067 \tabularnewline
18 & 0.308515 & 2.8444 & 0.002787 \tabularnewline
19 & 0.269208 & 2.482 & 0.007517 \tabularnewline
20 & 0.25593 & 2.3596 & 0.010294 \tabularnewline
21 & 0.233094 & 2.149 & 0.017238 \tabularnewline
22 & 0.196645 & 1.813 & 0.036682 \tabularnewline
23 & 0.233194 & 2.1499 & 0.0172 \tabularnewline
24 & 0.251574 & 2.3194 & 0.011386 \tabularnewline
25 & 0.188248 & 1.7356 & 0.043133 \tabularnewline
26 & 0.141383 & 1.3035 & 0.097964 \tabularnewline
27 & 0.120711 & 1.1129 & 0.134444 \tabularnewline
28 & 0.063323 & 0.5838 & 0.280448 \tabularnewline
29 & 0.060189 & 0.5549 & 0.290207 \tabularnewline
30 & 0.016106 & 0.1485 & 0.441156 \tabularnewline
31 & -0.017006 & -0.1568 & 0.437892 \tabularnewline
32 & -0.046212 & -0.426 & 0.335574 \tabularnewline
33 & -0.068974 & -0.6359 & 0.263272 \tabularnewline
34 & -0.093736 & -0.8642 & 0.194955 \tabularnewline
35 & -0.068077 & -0.6276 & 0.265961 \tabularnewline
36 & -0.050446 & -0.4651 & 0.321528 \tabularnewline
37 & -0.096818 & -0.8926 & 0.187292 \tabularnewline
38 & -0.134998 & -1.2446 & 0.108347 \tabularnewline
39 & -0.15377 & -1.4177 & 0.079968 \tabularnewline
40 & -0.176994 & -1.6318 & 0.05321 \tabularnewline
41 & -0.186345 & -1.718 & 0.044717 \tabularnewline
42 & -0.201872 & -1.8612 & 0.033089 \tabularnewline
43 & -0.211482 & -1.9498 & 0.02725 \tabularnewline
44 & -0.232971 & -2.1479 & 0.017284 \tabularnewline
45 & -0.262432 & -2.4195 & 0.008837 \tabularnewline
46 & -0.264283 & -2.4366 & 0.008457 \tabularnewline
47 & -0.261195 & -2.4081 & 0.009099 \tabularnewline
48 & -0.237729 & -2.1918 & 0.015566 \tabularnewline
49 & -0.277682 & -2.5601 & 0.006116 \tabularnewline
50 & -0.311213 & -2.8692 & 0.002595 \tabularnewline
51 & -0.317582 & -2.928 & 0.002189 \tabularnewline
52 & -0.3312 & -3.0535 & 0.00151 \tabularnewline
53 & -0.341606 & -3.1495 & 0.001129 \tabularnewline
54 & -0.331273 & -3.0542 & 0.001507 \tabularnewline
55 & -0.335151 & -3.0899 & 0.001353 \tabularnewline
56 & -0.334489 & -3.0838 & 0.001378 \tabularnewline
57 & -0.338543 & -3.1212 & 0.00123 \tabularnewline
58 & -0.328609 & -3.0296 & 0.001622 \tabularnewline
59 & -0.300136 & -2.7671 & 0.003469 \tabularnewline
60 & -0.267498 & -2.4662 & 0.007832 \tabularnewline
\hline
\end{tabular}
%Source: https://freestatistics.org/blog/index.php?pk=30702&T=1

[TABLE]
[ROW][C]Autocorrelation Function[/C][/ROW]
[ROW][C]Time lag k[/C][C]ACF(k)[/C][C]T-STAT[/C][C]P-value[/C][/ROW]
[ROW][C]1[/C][C]0.822383[/C][C]7.582[/C][C]0[/C][/ROW]
[ROW][C]2[/C][C]0.763624[/C][C]7.0403[/C][C]0[/C][/ROW]
[ROW][C]3[/C][C]0.753669[/C][C]6.9485[/C][C]0[/C][/ROW]
[ROW][C]4[/C][C]0.659494[/C][C]6.0802[/C][C]0[/C][/ROW]
[ROW][C]5[/C][C]0.619225[/C][C]5.709[/C][C]0[/C][/ROW]
[ROW][C]6[/C][C]0.603033[/C][C]5.5597[/C][C]0[/C][/ROW]
[ROW][C]7[/C][C]0.530764[/C][C]4.8934[/C][C]2e-06[/C][/ROW]
[ROW][C]8[/C][C]0.506857[/C][C]4.673[/C][C]6e-06[/C][/ROW]
[ROW][C]9[/C][C]0.487126[/C][C]4.4911[/C][C]1.1e-05[/C][/ROW]
[ROW][C]10[/C][C]0.427151[/C][C]3.9381[/C][C]8.4e-05[/C][/ROW]
[ROW][C]11[/C][C]0.457498[/C][C]4.2179[/C][C]3.1e-05[/C][/ROW]
[ROW][C]12[/C][C]0.511218[/C][C]4.7132[/C][C]5e-06[/C][/ROW]
[ROW][C]13[/C][C]0.396715[/C][C]3.6575[/C][C]0.00022[/C][/ROW]
[ROW][C]14[/C][C]0.357775[/C][C]3.2985[/C][C]0.00071[/C][/ROW]
[ROW][C]15[/C][C]0.364172[/C][C]3.3575[/C][C]0.000589[/C][/ROW]
[ROW][C]16[/C][C]0.307148[/C][C]2.8318[/C][C]0.002889[/C][/ROW]
[ROW][C]17[/C][C]0.319709[/C][C]2.9476[/C][C]0.002067[/C][/ROW]
[ROW][C]18[/C][C]0.308515[/C][C]2.8444[/C][C]0.002787[/C][/ROW]
[ROW][C]19[/C][C]0.269208[/C][C]2.482[/C][C]0.007517[/C][/ROW]
[ROW][C]20[/C][C]0.25593[/C][C]2.3596[/C][C]0.010294[/C][/ROW]
[ROW][C]21[/C][C]0.233094[/C][C]2.149[/C][C]0.017238[/C][/ROW]
[ROW][C]22[/C][C]0.196645[/C][C]1.813[/C][C]0.036682[/C][/ROW]
[ROW][C]23[/C][C]0.233194[/C][C]2.1499[/C][C]0.0172[/C][/ROW]
[ROW][C]24[/C][C]0.251574[/C][C]2.3194[/C][C]0.011386[/C][/ROW]
[ROW][C]25[/C][C]0.188248[/C][C]1.7356[/C][C]0.043133[/C][/ROW]
[ROW][C]26[/C][C]0.141383[/C][C]1.3035[/C][C]0.097964[/C][/ROW]
[ROW][C]27[/C][C]0.120711[/C][C]1.1129[/C][C]0.134444[/C][/ROW]
[ROW][C]28[/C][C]0.063323[/C][C]0.5838[/C][C]0.280448[/C][/ROW]
[ROW][C]29[/C][C]0.060189[/C][C]0.5549[/C][C]0.290207[/C][/ROW]
[ROW][C]30[/C][C]0.016106[/C][C]0.1485[/C][C]0.441156[/C][/ROW]
[ROW][C]31[/C][C]-0.017006[/C][C]-0.1568[/C][C]0.437892[/C][/ROW]
[ROW][C]32[/C][C]-0.046212[/C][C]-0.426[/C][C]0.335574[/C][/ROW]
[ROW][C]33[/C][C]-0.068974[/C][C]-0.6359[/C][C]0.263272[/C][/ROW]
[ROW][C]34[/C][C]-0.093736[/C][C]-0.8642[/C][C]0.194955[/C][/ROW]
[ROW][C]35[/C][C]-0.068077[/C][C]-0.6276[/C][C]0.265961[/C][/ROW]
[ROW][C]36[/C][C]-0.050446[/C][C]-0.4651[/C][C]0.321528[/C][/ROW]
[ROW][C]37[/C][C]-0.096818[/C][C]-0.8926[/C][C]0.187292[/C][/ROW]
[ROW][C]38[/C][C]-0.134998[/C][C]-1.2446[/C][C]0.108347[/C][/ROW]
[ROW][C]39[/C][C]-0.15377[/C][C]-1.4177[/C][C]0.079968[/C][/ROW]
[ROW][C]40[/C][C]-0.176994[/C][C]-1.6318[/C][C]0.05321[/C][/ROW]
[ROW][C]41[/C][C]-0.186345[/C][C]-1.718[/C][C]0.044717[/C][/ROW]
[ROW][C]42[/C][C]-0.201872[/C][C]-1.8612[/C][C]0.033089[/C][/ROW]
[ROW][C]43[/C][C]-0.211482[/C][C]-1.9498[/C][C]0.02725[/C][/ROW]
[ROW][C]44[/C][C]-0.232971[/C][C]-2.1479[/C][C]0.017284[/C][/ROW]
[ROW][C]45[/C][C]-0.262432[/C][C]-2.4195[/C][C]0.008837[/C][/ROW]
[ROW][C]46[/C][C]-0.264283[/C][C]-2.4366[/C][C]0.008457[/C][/ROW]
[ROW][C]47[/C][C]-0.261195[/C][C]-2.4081[/C][C]0.009099[/C][/ROW]
[ROW][C]48[/C][C]-0.237729[/C][C]-2.1918[/C][C]0.015566[/C][/ROW]
[ROW][C]49[/C][C]-0.277682[/C][C]-2.5601[/C][C]0.006116[/C][/ROW]
[ROW][C]50[/C][C]-0.311213[/C][C]-2.8692[/C][C]0.002595[/C][/ROW]
[ROW][C]51[/C][C]-0.317582[/C][C]-2.928[/C][C]0.002189[/C][/ROW]
[ROW][C]52[/C][C]-0.3312[/C][C]-3.0535[/C][C]0.00151[/C][/ROW]
[ROW][C]53[/C][C]-0.341606[/C][C]-3.1495[/C][C]0.001129[/C][/ROW]
[ROW][C]54[/C][C]-0.331273[/C][C]-3.0542[/C][C]0.001507[/C][/ROW]
[ROW][C]55[/C][C]-0.335151[/C][C]-3.0899[/C][C]0.001353[/C][/ROW]
[ROW][C]56[/C][C]-0.334489[/C][C]-3.0838[/C][C]0.001378[/C][/ROW]
[ROW][C]57[/C][C]-0.338543[/C][C]-3.1212[/C][C]0.00123[/C][/ROW]
[ROW][C]58[/C][C]-0.328609[/C][C]-3.0296[/C][C]0.001622[/C][/ROW]
[ROW][C]59[/C][C]-0.300136[/C][C]-2.7671[/C][C]0.003469[/C][/ROW]
[ROW][C]60[/C][C]-0.267498[/C][C]-2.4662[/C][C]0.007832[/C][/ROW]
[/TABLE]
Source: https://freestatistics.org/blog/index.php?pk=30702&T=1

Globally Unique Identifier (entire table): ba.freestatistics.org/blog/index.php?pk=30702&T=1

As an alternative you can also use a QR Code:  

The GUIDs for individual cells are displayed in the table below:

Autocorrelation Function
Time lag kACF(k)T-STATP-value
10.8223837.5820
20.7636247.04030
30.7536696.94850
40.6594946.08020
50.6192255.7090
60.6030335.55970
70.5307644.89342e-06
80.5068574.6736e-06
90.4871264.49111.1e-05
100.4271513.93818.4e-05
110.4574984.21793.1e-05
120.5112184.71325e-06
130.3967153.65750.00022
140.3577753.29850.00071
150.3641723.35750.000589
160.3071482.83180.002889
170.3197092.94760.002067
180.3085152.84440.002787
190.2692082.4820.007517
200.255932.35960.010294
210.2330942.1490.017238
220.1966451.8130.036682
230.2331942.14990.0172
240.2515742.31940.011386
250.1882481.73560.043133
260.1413831.30350.097964
270.1207111.11290.134444
280.0633230.58380.280448
290.0601890.55490.290207
300.0161060.14850.441156
31-0.017006-0.15680.437892
32-0.046212-0.4260.335574
33-0.068974-0.63590.263272
34-0.093736-0.86420.194955
35-0.068077-0.62760.265961
36-0.050446-0.46510.321528
37-0.096818-0.89260.187292
38-0.134998-1.24460.108347
39-0.15377-1.41770.079968
40-0.176994-1.63180.05321
41-0.186345-1.7180.044717
42-0.201872-1.86120.033089
43-0.211482-1.94980.02725
44-0.232971-2.14790.017284
45-0.262432-2.41950.008837
46-0.264283-2.43660.008457
47-0.261195-2.40810.009099
48-0.237729-2.19180.015566
49-0.277682-2.56010.006116
50-0.311213-2.86920.002595
51-0.317582-2.9280.002189
52-0.3312-3.05350.00151
53-0.341606-3.14950.001129
54-0.331273-3.05420.001507
55-0.335151-3.08990.001353
56-0.334489-3.08380.001378
57-0.338543-3.12120.00123
58-0.328609-3.02960.001622
59-0.300136-2.76710.003469
60-0.267498-2.46620.007832


Partial Autocorrelation Function
Time lag kPACF(k)T-STATP-value
10.8223837.5820
20.2697392.48690.007421
30.2440342.24990.01352
4-0.135582-1.250.107364
50.0328990.30330.381194
60.0683930.63060.265011
7-0.07215-0.66520.253866
80.0416130.38370.351095
90.0179850.16580.434349
10-0.052604-0.4850.314467
110.1993091.83750.034812
120.2587752.38580.009632
13-0.362293-3.34020.000623
14-0.193407-1.78310.039068
150.0838870.77340.220716
160.1103531.01740.155925
170.1305231.20340.116089
18-0.095622-0.88160.190243
19-0.042284-0.38980.348814
20-0.06399-0.590.278392
210.0570820.52630.300036
220.052510.48410.314774
230.0057520.0530.478917
24-0.039789-0.36680.357326
25-0.0151-0.13920.444805
26-0.141248-1.30220.098176
27-0.083347-0.76840.222184
28-0.072527-0.66870.25276
290.0313250.28880.386719
30-0.084254-0.77680.21972
310.0455490.41990.337796
32-0.041255-0.38040.352315
330.0821060.7570.225578
34-0.028282-0.26080.397458
35-0.016628-0.15330.439263
36-0.008324-0.07670.469503
37-0.084492-0.7790.219077
38-0.053811-0.49610.310549
39-0.022225-0.20490.419068
400.0277390.25570.399386
41-0.055-0.50710.306708
42-0.000874-0.00810.496795
430.0522650.48190.31557
44-0.037784-0.34830.36422
45-0.083083-0.7660.222903
460.0084070.07750.4692
47-0.043271-0.39890.345469
480.0306550.28260.389075
49-0.058545-0.53980.295386
50-0.041247-0.38030.352343
51-0.01038-0.09570.461992
520.0010560.00970.496127
530.0134080.12360.450955
540.0194090.17890.429203
55-0.010369-0.09560.462032
560.0718090.6620.254866
570.0341020.31440.376993
58-0.057931-0.53410.297335
590.0017160.01580.493708
60-0.047121-0.43440.332537

\begin{tabular}{lllllllll}
\hline
Partial Autocorrelation Function \tabularnewline
Time lag k & PACF(k) & T-STAT & P-value \tabularnewline
1 & 0.822383 & 7.582 & 0 \tabularnewline
2 & 0.269739 & 2.4869 & 0.007421 \tabularnewline
3 & 0.244034 & 2.2499 & 0.01352 \tabularnewline
4 & -0.135582 & -1.25 & 0.107364 \tabularnewline
5 & 0.032899 & 0.3033 & 0.381194 \tabularnewline
6 & 0.068393 & 0.6306 & 0.265011 \tabularnewline
7 & -0.07215 & -0.6652 & 0.253866 \tabularnewline
8 & 0.041613 & 0.3837 & 0.351095 \tabularnewline
9 & 0.017985 & 0.1658 & 0.434349 \tabularnewline
10 & -0.052604 & -0.485 & 0.314467 \tabularnewline
11 & 0.199309 & 1.8375 & 0.034812 \tabularnewline
12 & 0.258775 & 2.3858 & 0.009632 \tabularnewline
13 & -0.362293 & -3.3402 & 0.000623 \tabularnewline
14 & -0.193407 & -1.7831 & 0.039068 \tabularnewline
15 & 0.083887 & 0.7734 & 0.220716 \tabularnewline
16 & 0.110353 & 1.0174 & 0.155925 \tabularnewline
17 & 0.130523 & 1.2034 & 0.116089 \tabularnewline
18 & -0.095622 & -0.8816 & 0.190243 \tabularnewline
19 & -0.042284 & -0.3898 & 0.348814 \tabularnewline
20 & -0.06399 & -0.59 & 0.278392 \tabularnewline
21 & 0.057082 & 0.5263 & 0.300036 \tabularnewline
22 & 0.05251 & 0.4841 & 0.314774 \tabularnewline
23 & 0.005752 & 0.053 & 0.478917 \tabularnewline
24 & -0.039789 & -0.3668 & 0.357326 \tabularnewline
25 & -0.0151 & -0.1392 & 0.444805 \tabularnewline
26 & -0.141248 & -1.3022 & 0.098176 \tabularnewline
27 & -0.083347 & -0.7684 & 0.222184 \tabularnewline
28 & -0.072527 & -0.6687 & 0.25276 \tabularnewline
29 & 0.031325 & 0.2888 & 0.386719 \tabularnewline
30 & -0.084254 & -0.7768 & 0.21972 \tabularnewline
31 & 0.045549 & 0.4199 & 0.337796 \tabularnewline
32 & -0.041255 & -0.3804 & 0.352315 \tabularnewline
33 & 0.082106 & 0.757 & 0.225578 \tabularnewline
34 & -0.028282 & -0.2608 & 0.397458 \tabularnewline
35 & -0.016628 & -0.1533 & 0.439263 \tabularnewline
36 & -0.008324 & -0.0767 & 0.469503 \tabularnewline
37 & -0.084492 & -0.779 & 0.219077 \tabularnewline
38 & -0.053811 & -0.4961 & 0.310549 \tabularnewline
39 & -0.022225 & -0.2049 & 0.419068 \tabularnewline
40 & 0.027739 & 0.2557 & 0.399386 \tabularnewline
41 & -0.055 & -0.5071 & 0.306708 \tabularnewline
42 & -0.000874 & -0.0081 & 0.496795 \tabularnewline
43 & 0.052265 & 0.4819 & 0.31557 \tabularnewline
44 & -0.037784 & -0.3483 & 0.36422 \tabularnewline
45 & -0.083083 & -0.766 & 0.222903 \tabularnewline
46 & 0.008407 & 0.0775 & 0.4692 \tabularnewline
47 & -0.043271 & -0.3989 & 0.345469 \tabularnewline
48 & 0.030655 & 0.2826 & 0.389075 \tabularnewline
49 & -0.058545 & -0.5398 & 0.295386 \tabularnewline
50 & -0.041247 & -0.3803 & 0.352343 \tabularnewline
51 & -0.01038 & -0.0957 & 0.461992 \tabularnewline
52 & 0.001056 & 0.0097 & 0.496127 \tabularnewline
53 & 0.013408 & 0.1236 & 0.450955 \tabularnewline
54 & 0.019409 & 0.1789 & 0.429203 \tabularnewline
55 & -0.010369 & -0.0956 & 0.462032 \tabularnewline
56 & 0.071809 & 0.662 & 0.254866 \tabularnewline
57 & 0.034102 & 0.3144 & 0.376993 \tabularnewline
58 & -0.057931 & -0.5341 & 0.297335 \tabularnewline
59 & 0.001716 & 0.0158 & 0.493708 \tabularnewline
60 & -0.047121 & -0.4344 & 0.332537 \tabularnewline
\hline
\end{tabular}
%Source: https://freestatistics.org/blog/index.php?pk=30702&T=2

[TABLE]
[ROW][C]Partial Autocorrelation Function[/C][/ROW]
[ROW][C]Time lag k[/C][C]PACF(k)[/C][C]T-STAT[/C][C]P-value[/C][/ROW]
[ROW][C]1[/C][C]0.822383[/C][C]7.582[/C][C]0[/C][/ROW]
[ROW][C]2[/C][C]0.269739[/C][C]2.4869[/C][C]0.007421[/C][/ROW]
[ROW][C]3[/C][C]0.244034[/C][C]2.2499[/C][C]0.01352[/C][/ROW]
[ROW][C]4[/C][C]-0.135582[/C][C]-1.25[/C][C]0.107364[/C][/ROW]
[ROW][C]5[/C][C]0.032899[/C][C]0.3033[/C][C]0.381194[/C][/ROW]
[ROW][C]6[/C][C]0.068393[/C][C]0.6306[/C][C]0.265011[/C][/ROW]
[ROW][C]7[/C][C]-0.07215[/C][C]-0.6652[/C][C]0.253866[/C][/ROW]
[ROW][C]8[/C][C]0.041613[/C][C]0.3837[/C][C]0.351095[/C][/ROW]
[ROW][C]9[/C][C]0.017985[/C][C]0.1658[/C][C]0.434349[/C][/ROW]
[ROW][C]10[/C][C]-0.052604[/C][C]-0.485[/C][C]0.314467[/C][/ROW]
[ROW][C]11[/C][C]0.199309[/C][C]1.8375[/C][C]0.034812[/C][/ROW]
[ROW][C]12[/C][C]0.258775[/C][C]2.3858[/C][C]0.009632[/C][/ROW]
[ROW][C]13[/C][C]-0.362293[/C][C]-3.3402[/C][C]0.000623[/C][/ROW]
[ROW][C]14[/C][C]-0.193407[/C][C]-1.7831[/C][C]0.039068[/C][/ROW]
[ROW][C]15[/C][C]0.083887[/C][C]0.7734[/C][C]0.220716[/C][/ROW]
[ROW][C]16[/C][C]0.110353[/C][C]1.0174[/C][C]0.155925[/C][/ROW]
[ROW][C]17[/C][C]0.130523[/C][C]1.2034[/C][C]0.116089[/C][/ROW]
[ROW][C]18[/C][C]-0.095622[/C][C]-0.8816[/C][C]0.190243[/C][/ROW]
[ROW][C]19[/C][C]-0.042284[/C][C]-0.3898[/C][C]0.348814[/C][/ROW]
[ROW][C]20[/C][C]-0.06399[/C][C]-0.59[/C][C]0.278392[/C][/ROW]
[ROW][C]21[/C][C]0.057082[/C][C]0.5263[/C][C]0.300036[/C][/ROW]
[ROW][C]22[/C][C]0.05251[/C][C]0.4841[/C][C]0.314774[/C][/ROW]
[ROW][C]23[/C][C]0.005752[/C][C]0.053[/C][C]0.478917[/C][/ROW]
[ROW][C]24[/C][C]-0.039789[/C][C]-0.3668[/C][C]0.357326[/C][/ROW]
[ROW][C]25[/C][C]-0.0151[/C][C]-0.1392[/C][C]0.444805[/C][/ROW]
[ROW][C]26[/C][C]-0.141248[/C][C]-1.3022[/C][C]0.098176[/C][/ROW]
[ROW][C]27[/C][C]-0.083347[/C][C]-0.7684[/C][C]0.222184[/C][/ROW]
[ROW][C]28[/C][C]-0.072527[/C][C]-0.6687[/C][C]0.25276[/C][/ROW]
[ROW][C]29[/C][C]0.031325[/C][C]0.2888[/C][C]0.386719[/C][/ROW]
[ROW][C]30[/C][C]-0.084254[/C][C]-0.7768[/C][C]0.21972[/C][/ROW]
[ROW][C]31[/C][C]0.045549[/C][C]0.4199[/C][C]0.337796[/C][/ROW]
[ROW][C]32[/C][C]-0.041255[/C][C]-0.3804[/C][C]0.352315[/C][/ROW]
[ROW][C]33[/C][C]0.082106[/C][C]0.757[/C][C]0.225578[/C][/ROW]
[ROW][C]34[/C][C]-0.028282[/C][C]-0.2608[/C][C]0.397458[/C][/ROW]
[ROW][C]35[/C][C]-0.016628[/C][C]-0.1533[/C][C]0.439263[/C][/ROW]
[ROW][C]36[/C][C]-0.008324[/C][C]-0.0767[/C][C]0.469503[/C][/ROW]
[ROW][C]37[/C][C]-0.084492[/C][C]-0.779[/C][C]0.219077[/C][/ROW]
[ROW][C]38[/C][C]-0.053811[/C][C]-0.4961[/C][C]0.310549[/C][/ROW]
[ROW][C]39[/C][C]-0.022225[/C][C]-0.2049[/C][C]0.419068[/C][/ROW]
[ROW][C]40[/C][C]0.027739[/C][C]0.2557[/C][C]0.399386[/C][/ROW]
[ROW][C]41[/C][C]-0.055[/C][C]-0.5071[/C][C]0.306708[/C][/ROW]
[ROW][C]42[/C][C]-0.000874[/C][C]-0.0081[/C][C]0.496795[/C][/ROW]
[ROW][C]43[/C][C]0.052265[/C][C]0.4819[/C][C]0.31557[/C][/ROW]
[ROW][C]44[/C][C]-0.037784[/C][C]-0.3483[/C][C]0.36422[/C][/ROW]
[ROW][C]45[/C][C]-0.083083[/C][C]-0.766[/C][C]0.222903[/C][/ROW]
[ROW][C]46[/C][C]0.008407[/C][C]0.0775[/C][C]0.4692[/C][/ROW]
[ROW][C]47[/C][C]-0.043271[/C][C]-0.3989[/C][C]0.345469[/C][/ROW]
[ROW][C]48[/C][C]0.030655[/C][C]0.2826[/C][C]0.389075[/C][/ROW]
[ROW][C]49[/C][C]-0.058545[/C][C]-0.5398[/C][C]0.295386[/C][/ROW]
[ROW][C]50[/C][C]-0.041247[/C][C]-0.3803[/C][C]0.352343[/C][/ROW]
[ROW][C]51[/C][C]-0.01038[/C][C]-0.0957[/C][C]0.461992[/C][/ROW]
[ROW][C]52[/C][C]0.001056[/C][C]0.0097[/C][C]0.496127[/C][/ROW]
[ROW][C]53[/C][C]0.013408[/C][C]0.1236[/C][C]0.450955[/C][/ROW]
[ROW][C]54[/C][C]0.019409[/C][C]0.1789[/C][C]0.429203[/C][/ROW]
[ROW][C]55[/C][C]-0.010369[/C][C]-0.0956[/C][C]0.462032[/C][/ROW]
[ROW][C]56[/C][C]0.071809[/C][C]0.662[/C][C]0.254866[/C][/ROW]
[ROW][C]57[/C][C]0.034102[/C][C]0.3144[/C][C]0.376993[/C][/ROW]
[ROW][C]58[/C][C]-0.057931[/C][C]-0.5341[/C][C]0.297335[/C][/ROW]
[ROW][C]59[/C][C]0.001716[/C][C]0.0158[/C][C]0.493708[/C][/ROW]
[ROW][C]60[/C][C]-0.047121[/C][C]-0.4344[/C][C]0.332537[/C][/ROW]
[/TABLE]
Source: https://freestatistics.org/blog/index.php?pk=30702&T=2

Globally Unique Identifier (entire table): ba.freestatistics.org/blog/index.php?pk=30702&T=2

As an alternative you can also use a QR Code:  

The GUIDs for individual cells are displayed in the table below:

Partial Autocorrelation Function
Time lag kPACF(k)T-STATP-value
10.8223837.5820
20.2697392.48690.007421
30.2440342.24990.01352
4-0.135582-1.250.107364
50.0328990.30330.381194
60.0683930.63060.265011
7-0.07215-0.66520.253866
80.0416130.38370.351095
90.0179850.16580.434349
10-0.052604-0.4850.314467
110.1993091.83750.034812
120.2587752.38580.009632
13-0.362293-3.34020.000623
14-0.193407-1.78310.039068
150.0838870.77340.220716
160.1103531.01740.155925
170.1305231.20340.116089
18-0.095622-0.88160.190243
19-0.042284-0.38980.348814
20-0.06399-0.590.278392
210.0570820.52630.300036
220.052510.48410.314774
230.0057520.0530.478917
24-0.039789-0.36680.357326
25-0.0151-0.13920.444805
26-0.141248-1.30220.098176
27-0.083347-0.76840.222184
28-0.072527-0.66870.25276
290.0313250.28880.386719
30-0.084254-0.77680.21972
310.0455490.41990.337796
32-0.041255-0.38040.352315
330.0821060.7570.225578
34-0.028282-0.26080.397458
35-0.016628-0.15330.439263
36-0.008324-0.07670.469503
37-0.084492-0.7790.219077
38-0.053811-0.49610.310549
39-0.022225-0.20490.419068
400.0277390.25570.399386
41-0.055-0.50710.306708
42-0.000874-0.00810.496795
430.0522650.48190.31557
44-0.037784-0.34830.36422
45-0.083083-0.7660.222903
460.0084070.07750.4692
47-0.043271-0.39890.345469
480.0306550.28260.389075
49-0.058545-0.53980.295386
50-0.041247-0.38030.352343
51-0.01038-0.09570.461992
520.0010560.00970.496127
530.0134080.12360.450955
540.0194090.17890.429203
55-0.010369-0.09560.462032
560.0718090.6620.254866
570.0341020.31440.376993
58-0.057931-0.53410.297335
590.0017160.01580.493708
60-0.047121-0.43440.332537


Parameters (Session):
par1 = 60 ; par2 = 1 ; par3 = 0 ; par4 = 0 ; par5 = 12 ;
Parameters (R input):
par1 = 60 ; par2 = 1 ; par3 = 0 ; par4 = 0 ; par5 = 12 ;
R code (references can be found in the software module):
if (par1 == 'Default') {
par1 = 10*log10(length(x))
} else {
par1 <- as.numeric(par1)
}
par2 <- as.numeric(par2)
par3 <- as.numeric(par3)
par4 <- as.numeric(par4)
par5 <- as.numeric(par5)
if (par2 == 0) {
x <- log(x)
} else {
x <- (x ^ par2 - 1) / par2
}
if (par3 > 0) x <- diff(x,lag=1,difference=par3)
if (par4 > 0) x <- diff(x,lag=par5,difference=par4)
bitmap(file='pic1.png')
racf <- acf(x,par1,main='Autocorrelation',xlab='lags',ylab='ACF')
dev.off()
bitmap(file='pic2.png')
rpacf <- pacf(x,par1,main='Partial Autocorrelation',xlab='lags',ylab='PACF')
dev.off()
(myacf <- c(racf$acf))
(mypacf <- c(rpacf$acf))
lengthx <- length(x)
sqrtn <- sqrt(lengthx)
load(file='createtable')
a<-table.start()
a<-table.row.start(a)
a<-table.element(a,'Autocorrelation Function',4,TRUE)
a<-table.row.end(a)
a<-table.row.start(a)
a<-table.element(a,'Time lag k',header=TRUE)
a<-table.element(a,hyperlink('basics.htm','ACF(k)','click here for more information about the Autocorrelation Function'),header=TRUE)
a<-table.element(a,'T-STAT',header=TRUE)
a<-table.element(a,'P-value',header=TRUE)
a<-table.row.end(a)
for (i in 2:(par1+1)) {
a<-table.row.start(a)
a<-table.element(a,i-1,header=TRUE)
a<-table.element(a,round(myacf[i],6))
mytstat <- myacf[i]*sqrtn
a<-table.element(a,round(mytstat,4))
a<-table.element(a,round(1-pt(abs(mytstat),lengthx),6))
a<-table.row.end(a)
}
a<-table.end(a)
table.save(a,file='mytable.tab')
a<-table.start()
a<-table.row.start(a)
a<-table.element(a,'Partial Autocorrelation Function',4,TRUE)
a<-table.row.end(a)
a<-table.row.start(a)
a<-table.element(a,'Time lag k',header=TRUE)
a<-table.element(a,hyperlink('basics.htm','PACF(k)','click here for more information about the Partial Autocorrelation Function'),header=TRUE)
a<-table.element(a,'T-STAT',header=TRUE)
a<-table.element(a,'P-value',header=TRUE)
a<-table.row.end(a)
for (i in 1:par1) {
a<-table.row.start(a)
a<-table.element(a,i,header=TRUE)
a<-table.element(a,round(mypacf[i],6))
mytstat <- mypacf[i]*sqrtn
a<-table.element(a,round(mytstat,4))
a<-table.element(a,round(1-pt(abs(mytstat),lengthx),6))
a<-table.row.end(a)
}
a<-table.end(a)
table.save(a,file='mytable1.tab')