Free Statistics

of Irreproducible Research!

Author's title

Author*The author of this computation has been verified*
R Software Modulerwasp_smp.wasp
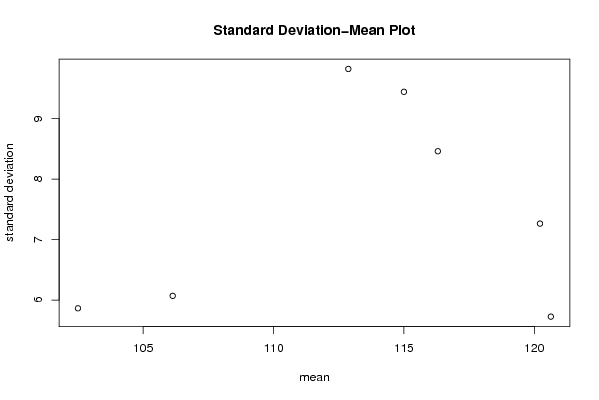
Title produced by softwareStandard Deviation-Mean Plot
Date of computationMon, 08 Dec 2008 11:45:00 -0700
Cite this page as followsStatistical Computations at FreeStatistics.org, Office for Research Development and Education, URL https://freestatistics.org/blog/index.php?v=date/2008/Dec/08/t1228761934z3lioe64bgrv09d.htm/, Retrieved Thu, 16 May 2024 23:37:21 +0000
Statistical Computations at FreeStatistics.org, Office for Research Development and Education, URL https://freestatistics.org/blog/index.php?pk=30679, Retrieved Thu, 16 May 2024 23:37:21 +0000
QR Codes:

Original text written by user:
IsPrivate?No (this computation is public)
User-defined keywords
Estimated Impact167
Family? (F = Feedback message, R = changed R code, M = changed R Module, P = changed Parameters, D = changed Data)
-     [Univariate Data Series] [data set] [2008-12-01 19:54:57] [b98453cac15ba1066b407e146608df68]
F RMPD    [Standard Deviation-Mean Plot] [step1.2] [2008-12-08 18:45:00] [89a49ebb3ece8e9a225c7f9f53a14c57] [Current]
Feedback Forum
2008-12-15 20:16:11 [Gilliam Schoorel] [reply
Goede bewerking en conclusie
2008-12-16 17:21:30 [Lana Van Wesemael] [reply
Goede conclusie. Door de SMP te berekenen kunnen we besluiten of dat een lambda transformatie nodig is en waaraan deze dan gelijk moet zijn. Eerst kijken we naar de eerste tabel om te besluiten of de lambda transformatie zin heeft. De p-waarde is zoals de studente aangeeft veel te groot en er is bovendien geen verband zichtbaar tussen het gemiddelde en de standaardafwijking. Bijgevolg is de lamda transformatie niet nodig, we laten deze parameter gewoon op 1 staan.

Post a new message
Dataseries X:
97,8
107,4
117,5
105,6
97,4
99,5
98
104,3
100,6
101,1
103,9
96,9
95,5
108,4
117
103,8
100,8
110,6
104
112,6
107,3
98,9
109,8
104,9
102,2
123,9
124,9
112,7
121,9
100,6
104,3
120,4
107,5
102,9
125,6
107,5
108,8
128,4
121,1
119,5
128,7
108,7
105,5
119,8
111,3
110,6
120,1
97,5
107,7
127,3
117,2
119,8
116,2
111
112,4
130,6
109,1
118,8
123,9
101,6
112,8
128
129,6
125,8
119,5
115,7
113,6
129,7
112
116,8
127
112,1
114,2
121,1
131,6
125
120,4
117,7
117,5
120,6
127,5
112,3
124,5
115,2
105,4


Summary of computational transaction
Raw Inputview raw input (R code)
Raw Outputview raw output of R engine
Computing time1 seconds
R Server'George Udny Yule' @ 72.249.76.132

\begin{tabular}{lllllllll}
\hline
Summary of computational transaction \tabularnewline
Raw Input & view raw input (R code)  \tabularnewline
Raw Output & view raw output of R engine  \tabularnewline
Computing time & 1 seconds \tabularnewline
R Server & 'George Udny Yule' @ 72.249.76.132 \tabularnewline
\hline
\end{tabular}
%Source: https://freestatistics.org/blog/index.php?pk=30679&T=0

[TABLE]
[ROW][C]Summary of computational transaction[/C][/ROW]
[ROW][C]Raw Input[/C][C]view raw input (R code) [/C][/ROW]
[ROW][C]Raw Output[/C][C]view raw output of R engine [/C][/ROW]
[ROW][C]Computing time[/C][C]1 seconds[/C][/ROW]
[ROW][C]R Server[/C][C]'George Udny Yule' @ 72.249.76.132[/C][/ROW]
[/TABLE]
Source: https://freestatistics.org/blog/index.php?pk=30679&T=0

Globally Unique Identifier (entire table): ba.freestatistics.org/blog/index.php?pk=30679&T=0

As an alternative you can also use a QR Code:  

The GUIDs for individual cells are displayed in the table below:

Summary of computational transaction
Raw Inputview raw input (R code)
Raw Outputview raw output of R engine
Computing time1 seconds
R Server'George Udny Yule' @ 72.249.76.132


Standard Deviation-Mean Plot
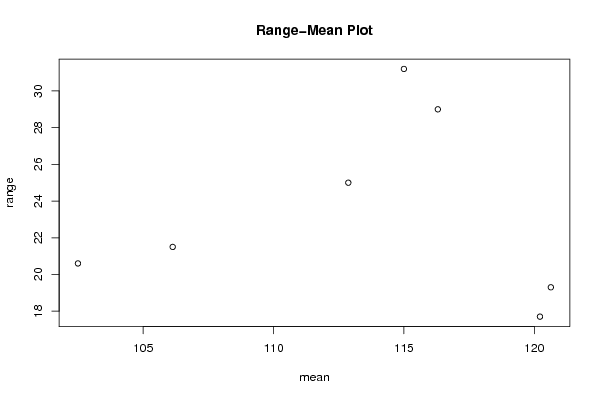
SectionMeanStandard DeviationRange
1102.55.8628258777425120.6
2106.1333333333336.0688973587889221.5
3112.8666666666679.8240274404907525
41159.4457301560979531.2
5116.38.4625377668017229
6120.2166666666677.2645882487751817.7
7120.6333333333335.7246410500148519.3

\begin{tabular}{lllllllll}
\hline
Standard Deviation-Mean Plot \tabularnewline
Section & Mean & Standard Deviation & Range \tabularnewline
1 & 102.5 & 5.86282587774251 & 20.6 \tabularnewline
2 & 106.133333333333 & 6.06889735878892 & 21.5 \tabularnewline
3 & 112.866666666667 & 9.82402744049075 & 25 \tabularnewline
4 & 115 & 9.44573015609795 & 31.2 \tabularnewline
5 & 116.3 & 8.46253776680172 & 29 \tabularnewline
6 & 120.216666666667 & 7.26458824877518 & 17.7 \tabularnewline
7 & 120.633333333333 & 5.72464105001485 & 19.3 \tabularnewline
\hline
\end{tabular}
%Source: https://freestatistics.org/blog/index.php?pk=30679&T=1

[TABLE]
[ROW][C]Standard Deviation-Mean Plot[/C][/ROW]
[ROW][C]Section[/C][C]Mean[/C][C]Standard Deviation[/C][C]Range[/C][/ROW]
[ROW][C]1[/C][C]102.5[/C][C]5.86282587774251[/C][C]20.6[/C][/ROW]
[ROW][C]2[/C][C]106.133333333333[/C][C]6.06889735878892[/C][C]21.5[/C][/ROW]
[ROW][C]3[/C][C]112.866666666667[/C][C]9.82402744049075[/C][C]25[/C][/ROW]
[ROW][C]4[/C][C]115[/C][C]9.44573015609795[/C][C]31.2[/C][/ROW]
[ROW][C]5[/C][C]116.3[/C][C]8.46253776680172[/C][C]29[/C][/ROW]
[ROW][C]6[/C][C]120.216666666667[/C][C]7.26458824877518[/C][C]17.7[/C][/ROW]
[ROW][C]7[/C][C]120.633333333333[/C][C]5.72464105001485[/C][C]19.3[/C][/ROW]
[/TABLE]
Source: https://freestatistics.org/blog/index.php?pk=30679&T=1

Globally Unique Identifier (entire table): ba.freestatistics.org/blog/index.php?pk=30679&T=1

As an alternative you can also use a QR Code:  

The GUIDs for individual cells are displayed in the table below:

Standard Deviation-Mean Plot
SectionMeanStandard DeviationRange
1102.55.8628258777425120.6
2106.1333333333336.0688973587889221.5
3112.8666666666679.8240274404907525
41159.4457301560979531.2
5116.38.4625377668017229
6120.2166666666677.2645882487751817.7
7120.6333333333335.7246410500148519.3


Regression: S.E.(k) = alpha + beta * Mean(k)
alpha0.0883228019571733
beta0.0655641508032655
S.D.0.109336391638342
T-STAT0.599655337265344
p-value0.57487272141009

\begin{tabular}{lllllllll}
\hline
Regression: S.E.(k) = alpha + beta * Mean(k) \tabularnewline
alpha & 0.0883228019571733 \tabularnewline
beta & 0.0655641508032655 \tabularnewline
S.D. & 0.109336391638342 \tabularnewline
T-STAT & 0.599655337265344 \tabularnewline
p-value & 0.57487272141009 \tabularnewline
\hline
\end{tabular}
%Source: https://freestatistics.org/blog/index.php?pk=30679&T=2

[TABLE]
[ROW][C]Regression: S.E.(k) = alpha + beta * Mean(k)[/C][/ROW]
[ROW][C]alpha[/C][C]0.0883228019571733[/C][/ROW]
[ROW][C]beta[/C][C]0.0655641508032655[/C][/ROW]
[ROW][C]S.D.[/C][C]0.109336391638342[/C][/ROW]
[ROW][C]T-STAT[/C][C]0.599655337265344[/C][/ROW]
[ROW][C]p-value[/C][C]0.57487272141009[/C][/ROW]
[/TABLE]
Source: https://freestatistics.org/blog/index.php?pk=30679&T=2

Globally Unique Identifier (entire table): ba.freestatistics.org/blog/index.php?pk=30679&T=2

As an alternative you can also use a QR Code:  

The GUIDs for individual cells are displayed in the table below:

Regression: S.E.(k) = alpha + beta * Mean(k)
alpha0.0883228019571733
beta0.0655641508032655
S.D.0.109336391638342
T-STAT0.599655337265344
p-value0.57487272141009


Regression: ln S.E.(k) = alpha + beta * ln Mean(k)
alpha-3.24352702691584
beta1.10773375025661
S.D.1.59850245769463
T-STAT0.69298220026148
p-value0.519184667485418
Lambda-0.107733750256608

\begin{tabular}{lllllllll}
\hline
Regression: ln S.E.(k) = alpha + beta * ln Mean(k) \tabularnewline
alpha & -3.24352702691584 \tabularnewline
beta & 1.10773375025661 \tabularnewline
S.D. & 1.59850245769463 \tabularnewline
T-STAT & 0.69298220026148 \tabularnewline
p-value & 0.519184667485418 \tabularnewline
Lambda & -0.107733750256608 \tabularnewline
\hline
\end{tabular}
%Source: https://freestatistics.org/blog/index.php?pk=30679&T=3

[TABLE]
[ROW][C]Regression: ln S.E.(k) = alpha + beta * ln Mean(k)[/C][/ROW]
[ROW][C]alpha[/C][C]-3.24352702691584[/C][/ROW]
[ROW][C]beta[/C][C]1.10773375025661[/C][/ROW]
[ROW][C]S.D.[/C][C]1.59850245769463[/C][/ROW]
[ROW][C]T-STAT[/C][C]0.69298220026148[/C][/ROW]
[ROW][C]p-value[/C][C]0.519184667485418[/C][/ROW]
[ROW][C]Lambda[/C][C]-0.107733750256608[/C][/ROW]
[/TABLE]
Source: https://freestatistics.org/blog/index.php?pk=30679&T=3

Globally Unique Identifier (entire table): ba.freestatistics.org/blog/index.php?pk=30679&T=3

As an alternative you can also use a QR Code:  

The GUIDs for individual cells are displayed in the table below:

Regression: ln S.E.(k) = alpha + beta * ln Mean(k)
alpha-3.24352702691584
beta1.10773375025661
S.D.1.59850245769463
T-STAT0.69298220026148
p-value0.519184667485418
Lambda-0.107733750256608


Parameters (Session):
par1 = 12 ;
Parameters (R input):
par1 = 12 ;
R code (references can be found in the software module):
par1 <- as.numeric(par1)
(n <- length(x))
(np <- floor(n / par1))
arr <- array(NA,dim=c(par1,np))
j <- 0
k <- 1
for (i in 1:(np*par1))
{
j = j + 1
arr[j,k] <- x[i]
if (j == par1) {
j = 0
k=k+1
}
}
arr
arr.mean <- array(NA,dim=np)
arr.sd <- array(NA,dim=np)
arr.range <- array(NA,dim=np)
for (j in 1:np)
{
arr.mean[j] <- mean(arr[,j],na.rm=TRUE)
arr.sd[j] <- sd(arr[,j],na.rm=TRUE)
arr.range[j] <- max(arr[,j],na.rm=TRUE) - min(arr[,j],na.rm=TRUE)
}
arr.mean
arr.sd
arr.range
(lm1 <- lm(arr.sd~arr.mean))
(lnlm1 <- lm(log(arr.sd)~log(arr.mean)))
(lm2 <- lm(arr.range~arr.mean))
bitmap(file='test1.png')
plot(arr.mean,arr.sd,main='Standard Deviation-Mean Plot',xlab='mean',ylab='standard deviation')
dev.off()
bitmap(file='test2.png')
plot(arr.mean,arr.range,main='Range-Mean Plot',xlab='mean',ylab='range')
dev.off()
load(file='createtable')
a<-table.start()
a<-table.row.start(a)
a<-table.element(a,'Standard Deviation-Mean Plot',4,TRUE)
a<-table.row.end(a)
a<-table.row.start(a)
a<-table.element(a,'Section',header=TRUE)
a<-table.element(a,'Mean',header=TRUE)
a<-table.element(a,'Standard Deviation',header=TRUE)
a<-table.element(a,'Range',header=TRUE)
a<-table.row.end(a)
for (j in 1:np) {
a<-table.row.start(a)
a<-table.element(a,j,header=TRUE)
a<-table.element(a,arr.mean[j])
a<-table.element(a,arr.sd[j] )
a<-table.element(a,arr.range[j] )
a<-table.row.end(a)
}
a<-table.end(a)
table.save(a,file='mytable.tab')
a<-table.start()
a<-table.row.start(a)
a<-table.element(a,'Regression: S.E.(k) = alpha + beta * Mean(k)',2,TRUE)
a<-table.row.end(a)
a<-table.row.start(a)
a<-table.element(a,'alpha',header=TRUE)
a<-table.element(a,lm1$coefficients[[1]])
a<-table.row.end(a)
a<-table.row.start(a)
a<-table.element(a,'beta',header=TRUE)
a<-table.element(a,lm1$coefficients[[2]])
a<-table.row.end(a)
a<-table.row.start(a)
a<-table.element(a,'S.D.',header=TRUE)
a<-table.element(a,summary(lm1)$coefficients[2,2])
a<-table.row.end(a)
a<-table.row.start(a)
a<-table.element(a,'T-STAT',header=TRUE)
a<-table.element(a,summary(lm1)$coefficients[2,3])
a<-table.row.end(a)
a<-table.row.start(a)
a<-table.element(a,'p-value',header=TRUE)
a<-table.element(a,summary(lm1)$coefficients[2,4])
a<-table.row.end(a)
a<-table.end(a)
table.save(a,file='mytable1.tab')
a<-table.start()
a<-table.row.start(a)
a<-table.element(a,'Regression: ln S.E.(k) = alpha + beta * ln Mean(k)',2,TRUE)
a<-table.row.end(a)
a<-table.row.start(a)
a<-table.element(a,'alpha',header=TRUE)
a<-table.element(a,lnlm1$coefficients[[1]])
a<-table.row.end(a)
a<-table.row.start(a)
a<-table.element(a,'beta',header=TRUE)
a<-table.element(a,lnlm1$coefficients[[2]])
a<-table.row.end(a)
a<-table.row.start(a)
a<-table.element(a,'S.D.',header=TRUE)
a<-table.element(a,summary(lnlm1)$coefficients[2,2])
a<-table.row.end(a)
a<-table.row.start(a)
a<-table.element(a,'T-STAT',header=TRUE)
a<-table.element(a,summary(lnlm1)$coefficients[2,3])
a<-table.row.end(a)
a<-table.row.start(a)
a<-table.element(a,'p-value',header=TRUE)
a<-table.element(a,summary(lnlm1)$coefficients[2,4])
a<-table.row.end(a)
a<-table.row.start(a)
a<-table.element(a,'Lambda',header=TRUE)
a<-table.element(a,1-lnlm1$coefficients[[2]])
a<-table.row.end(a)
a<-table.end(a)
table.save(a,file='mytable2.tab')