Free Statistics

of Irreproducible Research!

Author's title

Author*The author of this computation has been verified*
R Software Modulerwasp_arimabackwardselection.wasp
Title produced by softwareARIMA Backward Selection
Date of computationMon, 08 Dec 2008 11:32:45 -0700
Cite this page as followsStatistical Computations at FreeStatistics.org, Office for Research Development and Education, URL https://freestatistics.org/blog/index.php?v=date/2008/Dec/08/t1228761296637094jzhgmly90.htm/, Retrieved Thu, 16 May 2024 13:54:16 +0000
Statistical Computations at FreeStatistics.org, Office for Research Development and Education, URL https://freestatistics.org/blog/index.php?pk=30662, Retrieved Thu, 16 May 2024 13:54:16 +0000
QR Codes:

Original text written by user:met waarden parameters op maximum
IsPrivate?No (this computation is public)
User-defined keywords
Estimated Impact216
Family? (F = Feedback message, R = changed R code, M = changed R Module, P = changed Parameters, D = changed Data)
-     [Univariate Data Series] [data set] [2008-12-01 19:54:57] [b98453cac15ba1066b407e146608df68]
- RMP   [ARIMA Backward Selection] [ARIMA Backward Se...] [2008-12-08 10:48:08] [58bf45a666dc5198906262e8815a9722]
- RMPD    [Variance Reduction Matrix] [Variance Reductio...] [2008-12-08 11:24:27] [58bf45a666dc5198906262e8815a9722]
- RMP         [ARIMA Backward Selection] [Backward Selectio...] [2008-12-08 18:32:45] [63db34dadd44fb018112addcdefe949f] [Current]
-   P           [ARIMA Backward Selection] [ARIMA Backward Se...] [2008-12-15 11:53:10] [58bf45a666dc5198906262e8815a9722]
- RMPD            [Standard Deviation-Mean Plot] [SMP hoeveelheid u...] [2008-12-20 13:22:23] [063e4b67ad7d3a8a83eccec794cd5aa7]
- RMPD            [Variance Reduction Matrix] [VRM hoeveelheid u...] [2008-12-20 13:24:23] [063e4b67ad7d3a8a83eccec794cd5aa7]
- RMPD            [(Partial) Autocorrelation Function] [ACF hoeveelheid u...] [2008-12-20 13:26:46] [063e4b67ad7d3a8a83eccec794cd5aa7]
- RMPD            [Spectral Analysis] [Spectrum Analyse ...] [2008-12-20 13:28:15] [063e4b67ad7d3a8a83eccec794cd5aa7]
Feedback Forum

Post a new message
Dataseries X:
101
104
99
105
107
111
117
119
127
128
135
132
136
143
142
153
145
138
148
152
169
169
161
174
179
191
190
182
175
181
197
194
197
216
221
218
230
227
204
197
199
208
191
202
211
224
224
231
244
235
250
266
288
283
295
312
334
348
383
407


Summary of computational transaction
Raw Inputview raw input (R code)
Raw Outputview raw output of R engine
Computing time17 seconds
R Server'Herman Ole Andreas Wold' @ 193.190.124.10:1001

\begin{tabular}{lllllllll}
\hline
Summary of computational transaction \tabularnewline
Raw Input & view raw input (R code)  \tabularnewline
Raw Output & view raw output of R engine  \tabularnewline
Computing time & 17 seconds \tabularnewline
R Server & 'Herman Ole Andreas Wold' @ 193.190.124.10:1001 \tabularnewline
\hline
\end{tabular}
%Source: https://freestatistics.org/blog/index.php?pk=30662&T=0

[TABLE]
[ROW][C]Summary of computational transaction[/C][/ROW]
[ROW][C]Raw Input[/C][C]view raw input (R code) [/C][/ROW]
[ROW][C]Raw Output[/C][C]view raw output of R engine [/C][/ROW]
[ROW][C]Computing time[/C][C]17 seconds[/C][/ROW]
[ROW][C]R Server[/C][C]'Herman Ole Andreas Wold' @ 193.190.124.10:1001[/C][/ROW]
[/TABLE]
Source: https://freestatistics.org/blog/index.php?pk=30662&T=0

Globally Unique Identifier (entire table): ba.freestatistics.org/blog/index.php?pk=30662&T=0

As an alternative you can also use a QR Code:  

The GUIDs for individual cells are displayed in the table below:

Summary of computational transaction
Raw Inputview raw input (R code)
Raw Outputview raw output of R engine
Computing time17 seconds
R Server'Herman Ole Andreas Wold' @ 193.190.124.10:1001


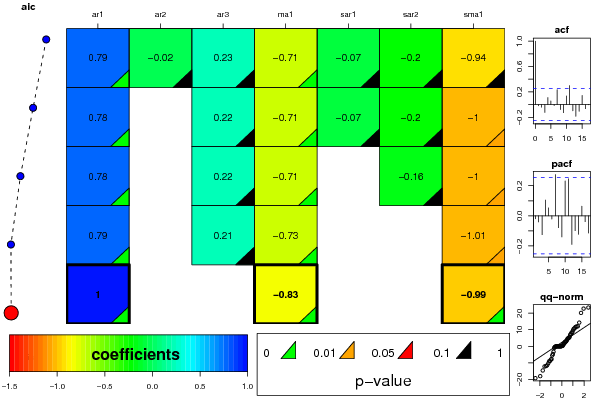
ARIMA Parameter Estimation and Backward Selection
Iterationar1ar2ar3ma1sar1sar2sma1
Estimates ( 1 )0.7883-0.02020.2293-0.7121-0.07-0.2021-0.9444
(p-val)(1e-04 )(0.9158 )(0.1735 )(0 )(0.7701 )(0.4207 )(0.1638 )
Estimates ( 2 )0.783300.2222-0.7072-0.0689-0.2027-1
(p-val)(0 )(NA )(0.1336 )(0 )(0.7655 )(0.4039 )(0.0492 )
Estimates ( 3 )0.781400.2236-0.71360-0.1641-1.0002
(p-val)(0 )(NA )(0.1274 )(0 )(NA )(0.4405 )(0.0223 )
Estimates ( 4 )0.791500.2104-0.729900-1.0135
(p-val)(0 )(NA )(0.1507 )(0 )(NA )(NA )(0.016 )
Estimates ( 5 )0.999800-0.832600-0.9947
(p-val)(0 )(NA )(NA )(0 )(NA )(NA )(0 )
Estimates ( 6 )NANANANANANANA
(p-val)(NA )(NA )(NA )(NA )(NA )(NA )(NA )
Estimates ( 7 )NANANANANANANA
(p-val)(NA )(NA )(NA )(NA )(NA )(NA )(NA )
Estimates ( 8 )NANANANANANANA
(p-val)(NA )(NA )(NA )(NA )(NA )(NA )(NA )
Estimates ( 9 )NANANANANANANA
(p-val)(NA )(NA )(NA )(NA )(NA )(NA )(NA )
Estimates ( 10 )NANANANANANANA
(p-val)(NA )(NA )(NA )(NA )(NA )(NA )(NA )
Estimates ( 11 )NANANANANANANA
(p-val)(NA )(NA )(NA )(NA )(NA )(NA )(NA )
Estimates ( 12 )NANANANANANANA
(p-val)(NA )(NA )(NA )(NA )(NA )(NA )(NA )
Estimates ( 13 )NANANANANANANA
(p-val)(NA )(NA )(NA )(NA )(NA )(NA )(NA )

\begin{tabular}{lllllllll}
\hline
ARIMA Parameter Estimation and Backward Selection \tabularnewline
Iteration & ar1 & ar2 & ar3 & ma1 & sar1 & sar2 & sma1 \tabularnewline
Estimates ( 1 ) & 0.7883 & -0.0202 & 0.2293 & -0.7121 & -0.07 & -0.2021 & -0.9444 \tabularnewline
(p-val) & (1e-04 ) & (0.9158 ) & (0.1735 ) & (0 ) & (0.7701 ) & (0.4207 ) & (0.1638 ) \tabularnewline
Estimates ( 2 ) & 0.7833 & 0 & 0.2222 & -0.7072 & -0.0689 & -0.2027 & -1 \tabularnewline
(p-val) & (0 ) & (NA ) & (0.1336 ) & (0 ) & (0.7655 ) & (0.4039 ) & (0.0492 ) \tabularnewline
Estimates ( 3 ) & 0.7814 & 0 & 0.2236 & -0.7136 & 0 & -0.1641 & -1.0002 \tabularnewline
(p-val) & (0 ) & (NA ) & (0.1274 ) & (0 ) & (NA ) & (0.4405 ) & (0.0223 ) \tabularnewline
Estimates ( 4 ) & 0.7915 & 0 & 0.2104 & -0.7299 & 0 & 0 & -1.0135 \tabularnewline
(p-val) & (0 ) & (NA ) & (0.1507 ) & (0 ) & (NA ) & (NA ) & (0.016 ) \tabularnewline
Estimates ( 5 ) & 0.9998 & 0 & 0 & -0.8326 & 0 & 0 & -0.9947 \tabularnewline
(p-val) & (0 ) & (NA ) & (NA ) & (0 ) & (NA ) & (NA ) & (0 ) \tabularnewline
Estimates ( 6 ) & NA & NA & NA & NA & NA & NA & NA \tabularnewline
(p-val) & (NA ) & (NA ) & (NA ) & (NA ) & (NA ) & (NA ) & (NA ) \tabularnewline
Estimates ( 7 ) & NA & NA & NA & NA & NA & NA & NA \tabularnewline
(p-val) & (NA ) & (NA ) & (NA ) & (NA ) & (NA ) & (NA ) & (NA ) \tabularnewline
Estimates ( 8 ) & NA & NA & NA & NA & NA & NA & NA \tabularnewline
(p-val) & (NA ) & (NA ) & (NA ) & (NA ) & (NA ) & (NA ) & (NA ) \tabularnewline
Estimates ( 9 ) & NA & NA & NA & NA & NA & NA & NA \tabularnewline
(p-val) & (NA ) & (NA ) & (NA ) & (NA ) & (NA ) & (NA ) & (NA ) \tabularnewline
Estimates ( 10 ) & NA & NA & NA & NA & NA & NA & NA \tabularnewline
(p-val) & (NA ) & (NA ) & (NA ) & (NA ) & (NA ) & (NA ) & (NA ) \tabularnewline
Estimates ( 11 ) & NA & NA & NA & NA & NA & NA & NA \tabularnewline
(p-val) & (NA ) & (NA ) & (NA ) & (NA ) & (NA ) & (NA ) & (NA ) \tabularnewline
Estimates ( 12 ) & NA & NA & NA & NA & NA & NA & NA \tabularnewline
(p-val) & (NA ) & (NA ) & (NA ) & (NA ) & (NA ) & (NA ) & (NA ) \tabularnewline
Estimates ( 13 ) & NA & NA & NA & NA & NA & NA & NA \tabularnewline
(p-val) & (NA ) & (NA ) & (NA ) & (NA ) & (NA ) & (NA ) & (NA ) \tabularnewline
\hline
\end{tabular}
%Source: https://freestatistics.org/blog/index.php?pk=30662&T=1

[TABLE]
[ROW][C]ARIMA Parameter Estimation and Backward Selection[/C][/ROW]
[ROW][C]Iteration[/C][C]ar1[/C][C]ar2[/C][C]ar3[/C][C]ma1[/C][C]sar1[/C][C]sar2[/C][C]sma1[/C][/ROW]
[ROW][C]Estimates ( 1 )[/C][C]0.7883[/C][C]-0.0202[/C][C]0.2293[/C][C]-0.7121[/C][C]-0.07[/C][C]-0.2021[/C][C]-0.9444[/C][/ROW]
[ROW][C](p-val)[/C][C](1e-04 )[/C][C](0.9158 )[/C][C](0.1735 )[/C][C](0 )[/C][C](0.7701 )[/C][C](0.4207 )[/C][C](0.1638 )[/C][/ROW]
[ROW][C]Estimates ( 2 )[/C][C]0.7833[/C][C]0[/C][C]0.2222[/C][C]-0.7072[/C][C]-0.0689[/C][C]-0.2027[/C][C]-1[/C][/ROW]
[ROW][C](p-val)[/C][C](0 )[/C][C](NA )[/C][C](0.1336 )[/C][C](0 )[/C][C](0.7655 )[/C][C](0.4039 )[/C][C](0.0492 )[/C][/ROW]
[ROW][C]Estimates ( 3 )[/C][C]0.7814[/C][C]0[/C][C]0.2236[/C][C]-0.7136[/C][C]0[/C][C]-0.1641[/C][C]-1.0002[/C][/ROW]
[ROW][C](p-val)[/C][C](0 )[/C][C](NA )[/C][C](0.1274 )[/C][C](0 )[/C][C](NA )[/C][C](0.4405 )[/C][C](0.0223 )[/C][/ROW]
[ROW][C]Estimates ( 4 )[/C][C]0.7915[/C][C]0[/C][C]0.2104[/C][C]-0.7299[/C][C]0[/C][C]0[/C][C]-1.0135[/C][/ROW]
[ROW][C](p-val)[/C][C](0 )[/C][C](NA )[/C][C](0.1507 )[/C][C](0 )[/C][C](NA )[/C][C](NA )[/C][C](0.016 )[/C][/ROW]
[ROW][C]Estimates ( 5 )[/C][C]0.9998[/C][C]0[/C][C]0[/C][C]-0.8326[/C][C]0[/C][C]0[/C][C]-0.9947[/C][/ROW]
[ROW][C](p-val)[/C][C](0 )[/C][C](NA )[/C][C](NA )[/C][C](0 )[/C][C](NA )[/C][C](NA )[/C][C](0 )[/C][/ROW]
[ROW][C]Estimates ( 6 )[/C][C]NA[/C][C]NA[/C][C]NA[/C][C]NA[/C][C]NA[/C][C]NA[/C][C]NA[/C][/ROW]
[ROW][C](p-val)[/C][C](NA )[/C][C](NA )[/C][C](NA )[/C][C](NA )[/C][C](NA )[/C][C](NA )[/C][C](NA )[/C][/ROW]
[ROW][C]Estimates ( 7 )[/C][C]NA[/C][C]NA[/C][C]NA[/C][C]NA[/C][C]NA[/C][C]NA[/C][C]NA[/C][/ROW]
[ROW][C](p-val)[/C][C](NA )[/C][C](NA )[/C][C](NA )[/C][C](NA )[/C][C](NA )[/C][C](NA )[/C][C](NA )[/C][/ROW]
[ROW][C]Estimates ( 8 )[/C][C]NA[/C][C]NA[/C][C]NA[/C][C]NA[/C][C]NA[/C][C]NA[/C][C]NA[/C][/ROW]
[ROW][C](p-val)[/C][C](NA )[/C][C](NA )[/C][C](NA )[/C][C](NA )[/C][C](NA )[/C][C](NA )[/C][C](NA )[/C][/ROW]
[ROW][C]Estimates ( 9 )[/C][C]NA[/C][C]NA[/C][C]NA[/C][C]NA[/C][C]NA[/C][C]NA[/C][C]NA[/C][/ROW]
[ROW][C](p-val)[/C][C](NA )[/C][C](NA )[/C][C](NA )[/C][C](NA )[/C][C](NA )[/C][C](NA )[/C][C](NA )[/C][/ROW]
[ROW][C]Estimates ( 10 )[/C][C]NA[/C][C]NA[/C][C]NA[/C][C]NA[/C][C]NA[/C][C]NA[/C][C]NA[/C][/ROW]
[ROW][C](p-val)[/C][C](NA )[/C][C](NA )[/C][C](NA )[/C][C](NA )[/C][C](NA )[/C][C](NA )[/C][C](NA )[/C][/ROW]
[ROW][C]Estimates ( 11 )[/C][C]NA[/C][C]NA[/C][C]NA[/C][C]NA[/C][C]NA[/C][C]NA[/C][C]NA[/C][/ROW]
[ROW][C](p-val)[/C][C](NA )[/C][C](NA )[/C][C](NA )[/C][C](NA )[/C][C](NA )[/C][C](NA )[/C][C](NA )[/C][/ROW]
[ROW][C]Estimates ( 12 )[/C][C]NA[/C][C]NA[/C][C]NA[/C][C]NA[/C][C]NA[/C][C]NA[/C][C]NA[/C][/ROW]
[ROW][C](p-val)[/C][C](NA )[/C][C](NA )[/C][C](NA )[/C][C](NA )[/C][C](NA )[/C][C](NA )[/C][C](NA )[/C][/ROW]
[ROW][C]Estimates ( 13 )[/C][C]NA[/C][C]NA[/C][C]NA[/C][C]NA[/C][C]NA[/C][C]NA[/C][C]NA[/C][/ROW]
[ROW][C](p-val)[/C][C](NA )[/C][C](NA )[/C][C](NA )[/C][C](NA )[/C][C](NA )[/C][C](NA )[/C][C](NA )[/C][/ROW]
[/TABLE]
Source: https://freestatistics.org/blog/index.php?pk=30662&T=1

Globally Unique Identifier (entire table): ba.freestatistics.org/blog/index.php?pk=30662&T=1

As an alternative you can also use a QR Code:  

The GUIDs for individual cells are displayed in the table below:

ARIMA Parameter Estimation and Backward Selection
Iterationar1ar2ar3ma1sar1sar2sma1
Estimates ( 1 )0.7883-0.02020.2293-0.7121-0.07-0.2021-0.9444
(p-val)(1e-04 )(0.9158 )(0.1735 )(0 )(0.7701 )(0.4207 )(0.1638 )
Estimates ( 2 )0.783300.2222-0.7072-0.0689-0.2027-1
(p-val)(0 )(NA )(0.1336 )(0 )(0.7655 )(0.4039 )(0.0492 )
Estimates ( 3 )0.781400.2236-0.71360-0.1641-1.0002
(p-val)(0 )(NA )(0.1274 )(0 )(NA )(0.4405 )(0.0223 )
Estimates ( 4 )0.791500.2104-0.729900-1.0135
(p-val)(0 )(NA )(0.1507 )(0 )(NA )(NA )(0.016 )
Estimates ( 5 )0.999800-0.832600-0.9947
(p-val)(0 )(NA )(NA )(0 )(NA )(NA )(0 )
Estimates ( 6 )NANANANANANANA
(p-val)(NA )(NA )(NA )(NA )(NA )(NA )(NA )
Estimates ( 7 )NANANANANANANA
(p-val)(NA )(NA )(NA )(NA )(NA )(NA )(NA )
Estimates ( 8 )NANANANANANANA
(p-val)(NA )(NA )(NA )(NA )(NA )(NA )(NA )
Estimates ( 9 )NANANANANANANA
(p-val)(NA )(NA )(NA )(NA )(NA )(NA )(NA )
Estimates ( 10 )NANANANANANANA
(p-val)(NA )(NA )(NA )(NA )(NA )(NA )(NA )
Estimates ( 11 )NANANANANANANA
(p-val)(NA )(NA )(NA )(NA )(NA )(NA )(NA )
Estimates ( 12 )NANANANANANANA
(p-val)(NA )(NA )(NA )(NA )(NA )(NA )(NA )
Estimates ( 13 )NANANANANANANA
(p-val)(NA )(NA )(NA )(NA )(NA )(NA )(NA )


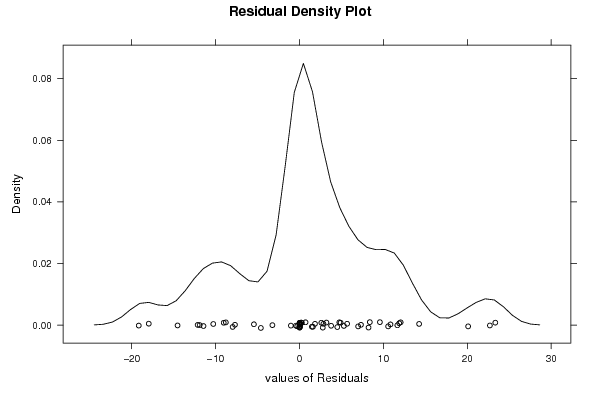
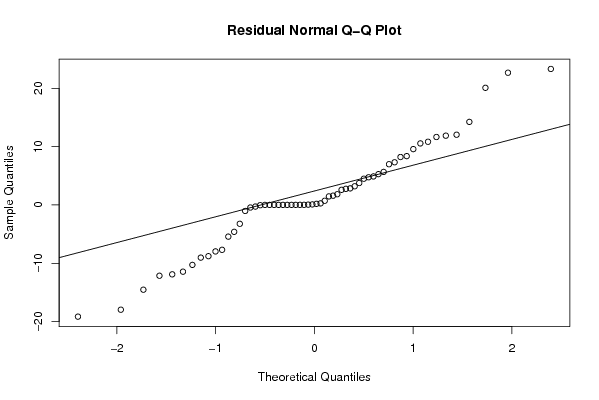
Estimated ARIMA Residuals
Value
-0.272217193508012
2.77310021783814
2.60287323611625
3.21056245385807
-7.96468468402341
-8.77909940050425
1.59631558167874
1.84538233362071
8.38146451949968
0.103296353307044
-10.2740281130496
10.5650475305410
-0.434823904289028
6.9909664664575
0.279833470970323
-14.5321337775175
-4.60413716049004
4.89765888663838
8.22775656438623
-3.22751270232823
-7.69025463094108
14.2562402817131
4.50363971617681
-5.43013241008637
3.76752143417252
-11.4416870130882
-17.9629948669284
-9.02804908774398
7.32635950987333
11.6615647618578
-19.1542408933340
12.0532071312836
0.197541928239534
10.8422042766530
0.720995982929249
5.28910610847045
4.75045134133195
-12.1363716022005
20.0997063327022
11.8879265744965
22.6875476342955
-11.8946366841432
1.47594245008284
2.85344246397993
5.67671850872523
-1.02368557839204
23.3354186988717
9.58470347077297

\begin{tabular}{lllllllll}
\hline
Estimated ARIMA Residuals \tabularnewline
Value \tabularnewline
-0.272217193508012 \tabularnewline
2.77310021783814 \tabularnewline
2.60287323611625 \tabularnewline
3.21056245385807 \tabularnewline
-7.96468468402341 \tabularnewline
-8.77909940050425 \tabularnewline
1.59631558167874 \tabularnewline
1.84538233362071 \tabularnewline
8.38146451949968 \tabularnewline
0.103296353307044 \tabularnewline
-10.2740281130496 \tabularnewline
10.5650475305410 \tabularnewline
-0.434823904289028 \tabularnewline
6.9909664664575 \tabularnewline
0.279833470970323 \tabularnewline
-14.5321337775175 \tabularnewline
-4.60413716049004 \tabularnewline
4.89765888663838 \tabularnewline
8.22775656438623 \tabularnewline
-3.22751270232823 \tabularnewline
-7.69025463094108 \tabularnewline
14.2562402817131 \tabularnewline
4.50363971617681 \tabularnewline
-5.43013241008637 \tabularnewline
3.76752143417252 \tabularnewline
-11.4416870130882 \tabularnewline
-17.9629948669284 \tabularnewline
-9.02804908774398 \tabularnewline
7.32635950987333 \tabularnewline
11.6615647618578 \tabularnewline
-19.1542408933340 \tabularnewline
12.0532071312836 \tabularnewline
0.197541928239534 \tabularnewline
10.8422042766530 \tabularnewline
0.720995982929249 \tabularnewline
5.28910610847045 \tabularnewline
4.75045134133195 \tabularnewline
-12.1363716022005 \tabularnewline
20.0997063327022 \tabularnewline
11.8879265744965 \tabularnewline
22.6875476342955 \tabularnewline
-11.8946366841432 \tabularnewline
1.47594245008284 \tabularnewline
2.85344246397993 \tabularnewline
5.67671850872523 \tabularnewline
-1.02368557839204 \tabularnewline
23.3354186988717 \tabularnewline
9.58470347077297 \tabularnewline
\hline
\end{tabular}
%Source: https://freestatistics.org/blog/index.php?pk=30662&T=2

[TABLE]
[ROW][C]Estimated ARIMA Residuals[/C][/ROW]
[ROW][C]Value[/C][/ROW]
[ROW][C]-0.272217193508012[/C][/ROW]
[ROW][C]2.77310021783814[/C][/ROW]
[ROW][C]2.60287323611625[/C][/ROW]
[ROW][C]3.21056245385807[/C][/ROW]
[ROW][C]-7.96468468402341[/C][/ROW]
[ROW][C]-8.77909940050425[/C][/ROW]
[ROW][C]1.59631558167874[/C][/ROW]
[ROW][C]1.84538233362071[/C][/ROW]
[ROW][C]8.38146451949968[/C][/ROW]
[ROW][C]0.103296353307044[/C][/ROW]
[ROW][C]-10.2740281130496[/C][/ROW]
[ROW][C]10.5650475305410[/C][/ROW]
[ROW][C]-0.434823904289028[/C][/ROW]
[ROW][C]6.9909664664575[/C][/ROW]
[ROW][C]0.279833470970323[/C][/ROW]
[ROW][C]-14.5321337775175[/C][/ROW]
[ROW][C]-4.60413716049004[/C][/ROW]
[ROW][C]4.89765888663838[/C][/ROW]
[ROW][C]8.22775656438623[/C][/ROW]
[ROW][C]-3.22751270232823[/C][/ROW]
[ROW][C]-7.69025463094108[/C][/ROW]
[ROW][C]14.2562402817131[/C][/ROW]
[ROW][C]4.50363971617681[/C][/ROW]
[ROW][C]-5.43013241008637[/C][/ROW]
[ROW][C]3.76752143417252[/C][/ROW]
[ROW][C]-11.4416870130882[/C][/ROW]
[ROW][C]-17.9629948669284[/C][/ROW]
[ROW][C]-9.02804908774398[/C][/ROW]
[ROW][C]7.32635950987333[/C][/ROW]
[ROW][C]11.6615647618578[/C][/ROW]
[ROW][C]-19.1542408933340[/C][/ROW]
[ROW][C]12.0532071312836[/C][/ROW]
[ROW][C]0.197541928239534[/C][/ROW]
[ROW][C]10.8422042766530[/C][/ROW]
[ROW][C]0.720995982929249[/C][/ROW]
[ROW][C]5.28910610847045[/C][/ROW]
[ROW][C]4.75045134133195[/C][/ROW]
[ROW][C]-12.1363716022005[/C][/ROW]
[ROW][C]20.0997063327022[/C][/ROW]
[ROW][C]11.8879265744965[/C][/ROW]
[ROW][C]22.6875476342955[/C][/ROW]
[ROW][C]-11.8946366841432[/C][/ROW]
[ROW][C]1.47594245008284[/C][/ROW]
[ROW][C]2.85344246397993[/C][/ROW]
[ROW][C]5.67671850872523[/C][/ROW]
[ROW][C]-1.02368557839204[/C][/ROW]
[ROW][C]23.3354186988717[/C][/ROW]
[ROW][C]9.58470347077297[/C][/ROW]
[/TABLE]
Source: https://freestatistics.org/blog/index.php?pk=30662&T=2

Globally Unique Identifier (entire table): ba.freestatistics.org/blog/index.php?pk=30662&T=2

As an alternative you can also use a QR Code:  

The GUIDs for individual cells are displayed in the table below:

Estimated ARIMA Residuals
Value
-0.272217193508012
2.77310021783814
2.60287323611625
3.21056245385807
-7.96468468402341
-8.77909940050425
1.59631558167874
1.84538233362071
8.38146451949968
0.103296353307044
-10.2740281130496
10.5650475305410
-0.434823904289028
6.9909664664575
0.279833470970323
-14.5321337775175
-4.60413716049004
4.89765888663838
8.22775656438623
-3.22751270232823
-7.69025463094108
14.2562402817131
4.50363971617681
-5.43013241008637
3.76752143417252
-11.4416870130882
-17.9629948669284
-9.02804908774398
7.32635950987333
11.6615647618578
-19.1542408933340
12.0532071312836
0.197541928239534
10.8422042766530
0.720995982929249
5.28910610847045
4.75045134133195
-12.1363716022005
20.0997063327022
11.8879265744965
22.6875476342955
-11.8946366841432
1.47594245008284
2.85344246397993
5.67671850872523
-1.02368557839204
23.3354186988717
9.58470347077297


Parameters (Session):
par1 = FALSE ; par2 = 1 ; par3 = 1 ; par4 = 1 ; par5 = 12 ; par6 = 3 ; par7 = 1 ; par8 = 2 ; par9 = 1 ;
Parameters (R input):
par1 = FALSE ; par2 = 1 ; par3 = 1 ; par4 = 1 ; par5 = 12 ; par6 = 3 ; par7 = 1 ; par8 = 2 ; par9 = 1 ;
R code (references can be found in the software module):
library(lattice)
if (par1 == 'TRUE') par1 <- TRUE
if (par1 == 'FALSE') par1 <- FALSE
par2 <- as.numeric(par2) #Box-Cox lambda transformation parameter
par3 <- as.numeric(par3) #degree of non-seasonal differencing
par4 <- as.numeric(par4) #degree of seasonal differencing
par5 <- as.numeric(par5) #seasonal period
par6 <- as.numeric(par6) #degree (p) of the non-seasonal AR(p) polynomial
par7 <- as.numeric(par7) #degree (q) of the non-seasonal MA(q) polynomial
par8 <- as.numeric(par8) #degree (P) of the seasonal AR(P) polynomial
par9 <- as.numeric(par9) #degree (Q) of the seasonal MA(Q) polynomial
armaGR <- function(arima.out, names, n){
try1 <- arima.out$coef
try2 <- sqrt(diag(arima.out$var.coef))
try.data.frame <- data.frame(matrix(NA,ncol=4,nrow=length(names)))
dimnames(try.data.frame) <- list(names,c('coef','std','tstat','pv'))
try.data.frame[,1] <- try1
for(i in 1:length(try2)) try.data.frame[which(rownames(try.data.frame)==names(try2)[i]),2] <- try2[i]
try.data.frame[,3] <- try.data.frame[,1] / try.data.frame[,2]
try.data.frame[,4] <- round((1-pt(abs(try.data.frame[,3]),df=n-(length(try2)+1)))*2,5)
vector <- rep(NA,length(names))
vector[is.na(try.data.frame[,4])] <- 0
maxi <- which.max(try.data.frame[,4])
continue <- max(try.data.frame[,4],na.rm=TRUE) > .05
vector[maxi] <- 0
list(summary=try.data.frame,next.vector=vector,continue=continue)
}
arimaSelect <- function(series, order=c(13,0,0), seasonal=list(order=c(2,0,0),period=12), include.mean=F){
nrc <- order[1]+order[3]+seasonal$order[1]+seasonal$order[3]
coeff <- matrix(NA, nrow=nrc*2, ncol=nrc)
pval <- matrix(NA, nrow=nrc*2, ncol=nrc)
mylist <- rep(list(NULL), nrc)
names <- NULL
if(order[1] > 0) names <- paste('ar',1:order[1],sep='')
if(order[3] > 0) names <- c( names , paste('ma',1:order[3],sep='') )
if(seasonal$order[1] > 0) names <- c(names, paste('sar',1:seasonal$order[1],sep=''))
if(seasonal$order[3] > 0) names <- c(names, paste('sma',1:seasonal$order[3],sep=''))
arima.out <- arima(series, order=order, seasonal=seasonal, include.mean=include.mean, method='ML')
mylist[[1]] <- arima.out
last.arma <- armaGR(arima.out, names, length(series))
mystop <- FALSE
i <- 1
coeff[i,] <- last.arma[[1]][,1]
pval [i,] <- last.arma[[1]][,4]
i <- 2
aic <- arima.out$aic
while(!mystop){
mylist[[i]] <- arima.out
arima.out <- arima(series, order=order, seasonal=seasonal, include.mean=include.mean, method='ML', fixed=last.arma$next.vector)
aic <- c(aic, arima.out$aic)
last.arma <- armaGR(arima.out, names, length(series))
mystop <- !last.arma$continue
coeff[i,] <- last.arma[[1]][,1]
pval [i,] <- last.arma[[1]][,4]
i <- i+1
}
list(coeff, pval, mylist, aic=aic)
}
arimaSelectplot <- function(arimaSelect.out,noms,choix){
noms <- names(arimaSelect.out[[3]][[1]]$coef)
coeff <- arimaSelect.out[[1]]
k <- min(which(is.na(coeff[,1])))-1
coeff <- coeff[1:k,]
pval <- arimaSelect.out[[2]][1:k,]
aic <- arimaSelect.out$aic[1:k]
coeff[coeff==0] <- NA
n <- ncol(coeff)
if(missing(choix)) choix <- k
layout(matrix(c(1,1,1,2,
3,3,3,2,
3,3,3,4,
5,6,7,7),nr=4),
widths=c(10,35,45,15),
heights=c(30,30,15,15))
couleurs <- rainbow(75)[1:50]#(50)
ticks <- pretty(coeff)
par(mar=c(1,1,3,1))
plot(aic,k:1-.5,type='o',pch=21,bg='blue',cex=2,axes=F,lty=2,xpd=NA)
points(aic[choix],k-choix+.5,pch=21,cex=4,bg=2,xpd=NA)
title('aic',line=2)
par(mar=c(3,0,0,0))
plot(0,axes=F,xlab='',ylab='',xlim=range(ticks),ylim=c(.1,1))
rect(xleft = min(ticks) + (0:49)/50*(max(ticks)-min(ticks)),
xright = min(ticks) + (1:50)/50*(max(ticks)-min(ticks)),
ytop = rep(1,50),
ybottom= rep(0,50),col=couleurs,border=NA)
axis(1,ticks)
rect(xleft=min(ticks),xright=max(ticks),ytop=1,ybottom=0)
text(mean(coeff,na.rm=T),.5,'coefficients',cex=2,font=2)
par(mar=c(1,1,3,1))
image(1:n,1:k,t(coeff[k:1,]),axes=F,col=couleurs,zlim=range(ticks))
for(i in 1:n) for(j in 1:k) if(!is.na(coeff[j,i])) {
if(pval[j,i]<.01) symb = 'green'
else if( (pval[j,i]<.05) & (pval[j,i]>=.01)) symb = 'orange'
else if( (pval[j,i]<.1) & (pval[j,i]>=.05)) symb = 'red'
else symb = 'black'
polygon(c(i+.5 ,i+.2 ,i+.5 ,i+.5),
c(k-j+0.5,k-j+0.5,k-j+0.8,k-j+0.5),
col=symb)
if(j==choix) {
rect(xleft=i-.5,
xright=i+.5,
ybottom=k-j+1.5,
ytop=k-j+.5,
lwd=4)
text(i,
k-j+1,
round(coeff[j,i],2),
cex=1.2,
font=2)
}
else{
rect(xleft=i-.5,xright=i+.5,ybottom=k-j+1.5,ytop=k-j+.5)
text(i,k-j+1,round(coeff[j,i],2),cex=1.2,font=1)
}
}
axis(3,1:n,noms)
par(mar=c(0.5,0,0,0.5))
plot(0,axes=F,xlab='',ylab='',type='n',xlim=c(0,8),ylim=c(-.2,.8))
cols <- c('green','orange','red','black')
niv <- c('0','0.01','0.05','0.1')
for(i in 0:3){
polygon(c(1+2*i ,1+2*i ,1+2*i-.5 ,1+2*i),
c(.4 ,.7 , .4 , .4),
col=cols[i+1])
text(2*i,0.5,niv[i+1],cex=1.5)
}
text(8,.5,1,cex=1.5)
text(4,0,'p-value',cex=2)
box()
residus <- arimaSelect.out[[3]][[choix]]$res
par(mar=c(1,2,4,1))
acf(residus,main='')
title('acf',line=.5)
par(mar=c(1,2,4,1))
pacf(residus,main='')
title('pacf',line=.5)
par(mar=c(2,2,4,1))
qqnorm(residus,main='')
title('qq-norm',line=.5)
qqline(residus)
residus
}
if (par2 == 0) x <- log(x)
if (par2 != 0) x <- x^par2
(selection <- arimaSelect(x, order=c(par6,par3,par7), seasonal=list(order=c(par8,par4,par9), period=par5)))
bitmap(file='test1.png')
resid <- arimaSelectplot(selection)
dev.off()
resid
bitmap(file='test2.png')
acf(resid,length(resid)/2, main='Residual Autocorrelation Function')
dev.off()
bitmap(file='test3.png')
pacf(resid,length(resid)/2, main='Residual Partial Autocorrelation Function')
dev.off()
bitmap(file='test4.png')
cpgram(resid, main='Residual Cumulative Periodogram')
dev.off()
bitmap(file='test5.png')
hist(resid, main='Residual Histogram', xlab='values of Residuals')
dev.off()
bitmap(file='test6.png')
densityplot(~resid,col='black',main='Residual Density Plot', xlab='values of Residuals')
dev.off()
bitmap(file='test7.png')
qqnorm(resid, main='Residual Normal Q-Q Plot')
qqline(resid)
dev.off()
ncols <- length(selection[[1]][1,])
nrows <- length(selection[[2]][,1])-1
load(file='createtable')
a<-table.start()
a<-table.row.start(a)
a<-table.element(a,'ARIMA Parameter Estimation and Backward Selection', ncols+1,TRUE)
a<-table.row.end(a)
a<-table.row.start(a)
a<-table.element(a,'Iteration', header=TRUE)
for (i in 1:ncols) {
a<-table.element(a,names(selection[[3]][[1]]$coef)[i],header=TRUE)
}
a<-table.row.end(a)
for (j in 1:nrows) {
a<-table.row.start(a)
mydum <- 'Estimates ('
mydum <- paste(mydum,j)
mydum <- paste(mydum,')')
a<-table.element(a,mydum, header=TRUE)
for (i in 1:ncols) {
a<-table.element(a,round(selection[[1]][j,i],4))
}
a<-table.row.end(a)
a<-table.row.start(a)
a<-table.element(a,'(p-val)', header=TRUE)
for (i in 1:ncols) {
mydum <- '('
mydum <- paste(mydum,round(selection[[2]][j,i],4),sep='')
mydum <- paste(mydum,')')
a<-table.element(a,mydum)
}
a<-table.row.end(a)
}
a<-table.end(a)
table.save(a,file='mytable.tab')
a<-table.start()
a<-table.row.start(a)
a<-table.element(a,'Estimated ARIMA Residuals', 1,TRUE)
a<-table.row.end(a)
a<-table.row.start(a)
a<-table.element(a,'Value', 1,TRUE)
a<-table.row.end(a)
for (i in (par4*par5+par3):length(resid)) {
a<-table.row.start(a)
a<-table.element(a,resid[i])
a<-table.row.end(a)
}
a<-table.end(a)
table.save(a,file='mytable1.tab')