Free Statistics

of Irreproducible Research!

Author's title

Author*The author of this computation has been verified*
R Software Modulerwasp_arimabackwardselection.wasp
Title produced by softwareARIMA Backward Selection
Date of computationMon, 08 Dec 2008 11:25:12 -0700
Cite this page as followsStatistical Computations at FreeStatistics.org, Office for Research Development and Education, URL https://freestatistics.org/blog/index.php?v=date/2008/Dec/08/t1228760776qb78y9afwk732xe.htm/, Retrieved Thu, 16 May 2024 06:29:08 +0000
Statistical Computations at FreeStatistics.org, Office for Research Development and Education, URL https://freestatistics.org/blog/index.php?pk=30648, Retrieved Thu, 16 May 2024 06:29:08 +0000
QR Codes:

Original text written by user:
IsPrivate?No (this computation is public)
User-defined keywords
Estimated Impact275
Family? (F = Feedback message, R = changed R code, M = changed R Module, P = changed Parameters, D = changed Data)
-     [Spectral Analysis] [Unemployment - St...] [2008-12-08 17:28:52] [57850c80fd59ccfb28f882be994e814e]
F RMP     [ARIMA Backward Selection] [Unemployment - St...] [2008-12-08 18:25:12] [0831954c833179c36e9320daee0825b5] [Current]
F           [ARIMA Backward Selection] [Step 5] [2008-12-08 21:03:53] [6816386b1f3c2f6c0c9f2aa1e5bc9362]
F   PD        [ARIMA Backward Selection] [step 5] [2008-12-08 22:38:06] [cf9c64468d04c2c4dd548cc66b4e3677]
F   P           [ARIMA Backward Selection] [Step 5] [2008-12-08 23:15:27] [6816386b1f3c2f6c0c9f2aa1e5bc9362]
-                 [ARIMA Backward Selection] [step 5] [2008-12-08 23:45:15] [73d6180dc45497329efd1b6934a84aba]
F                 [ARIMA Backward Selection] [] [2008-12-09 00:23:28] [74be16979710d4c4e7c6647856088456]
-   P           [ARIMA Backward Selection] [Verbetering works...] [2008-12-15 10:37:49] [cf9c64468d04c2c4dd548cc66b4e3677]
-             [ARIMA Backward Selection] [] [2008-12-09 00:36:31] [74be16979710d4c4e7c6647856088456]
-    D        [ARIMA Backward Selection] [verbetering step 5] [2008-12-14 18:23:12] [73d6180dc45497329efd1b6934a84aba]
-               [ARIMA Backward Selection] [Verbetering step 5] [2008-12-15 02:54:59] [6816386b1f3c2f6c0c9f2aa1e5bc9362]
F   PD      [ARIMA Backward Selection] [] [2008-12-08 21:38:33] [4c8dfb519edec2da3492d7e6be9a5685]
-           [ARIMA Backward Selection] [step 5] [2008-12-10 00:00:34] [74be16979710d4c4e7c6647856088456]
Feedback Forum
2008-12-13 22:05:19 [Li Tang Hu] [reply
waarom heb je ineens als lambdawaarde 0,5 gekozen terwijl je overal 1 genomen hebt? om te zien welke processen er aanwezig zijn, moeten we lambda, d en D correct invullen en voor de andere parameters de maximale waarde nemen.
dan moest je aflezen in de figuur wat je coefficienten zijn in de formules invullen (deze formules heb je in de les gezien, of vind je in de links onder het blokje 18 denk ik dat het was)
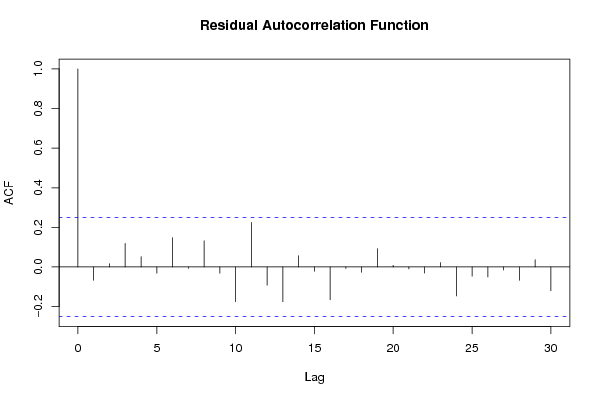
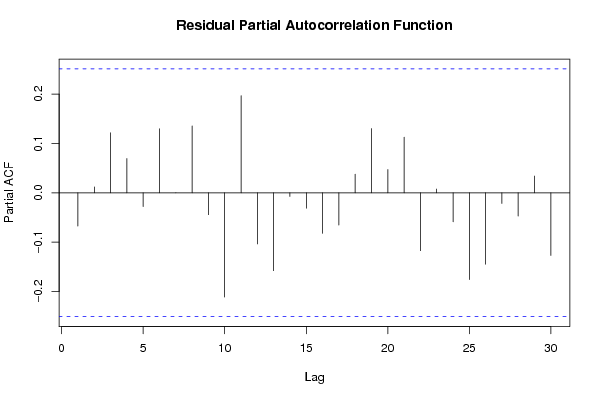
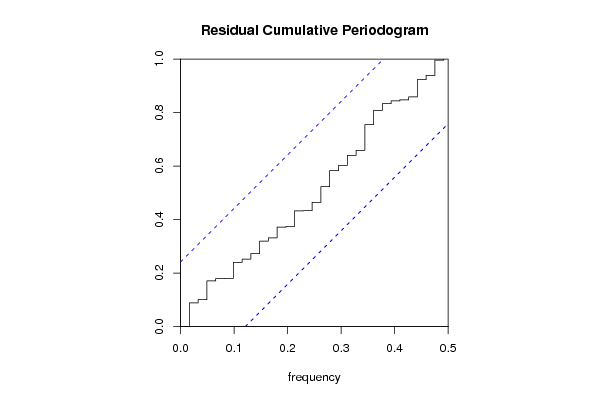
vervolgens moet je de residuals controleren adhv de 4 assumpties (gemiddelde, autocorrelatie, normaal verdeling en variantie)
2008-12-14 10:58:40 [94a54c888ac7f7d6874c3108eb0e1808] [reply
Zoals in de vorige feedback, moet je een juiste lambda waarde nemen. Vervolgens moet je de resultaten juist aflezen en vervolgens moet je de grafieken overnemen en interpreteren. Zo kan je zien of de gegevens normaal verdeeld zijn.
2008-12-14 11:47:16 [Matthieu Blondeau] [reply
Voor deze berekening moet men enkel de lambda, d en D waarden correct ingeven. En de seasonal period op 12 zetten. Voor de andere waarden moet men telkens de maximale waarden ingeven.
2008-12-14 14:21:25 [Stéphanie Claes] [reply
Ik ga akkoord met wat er eerder werd gezegd.
2008-12-14 23:58:05 [Bob Leysen] [reply
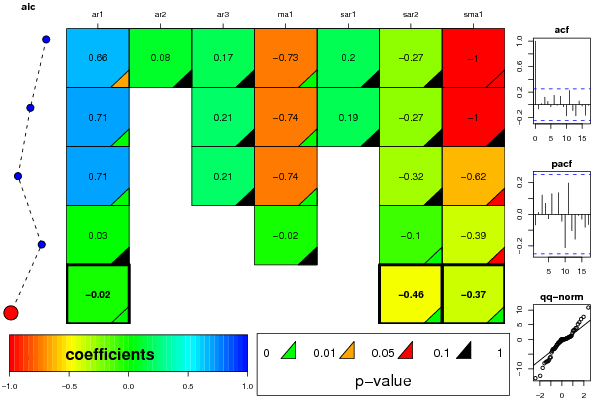
We zien dat de computer 4 modellen heeft berekend, namelijk AR, MA, SAR en SMA.

We merken 3 parameters op die significant zijn en die je kan gebruiken voor te voorspellen. Dit zijn de coefficienten die omcirkeld zijn. De overige kolommen zijn vaak minder lang en dus niet significant.

De bedoeling van stap 5 is om de lambda waarde van stap 1 in te voeren en de resultaten juist af te lezen. Vervolgens moet je de grafieken overnemen en interpreteren. Zo kan je zien of de gegevens normaal verdeeld zijn.
2008-12-15 11:09:28 [Gilliam Schoorel] [reply
Deze stap is ook onvoldoende uitgewerkt. Het lijkt erop dat je de backward selection goed hebt uitgevoerd, maar ik snap niet hoe je opeens aan die 0,5 lamba komt? Je hebt overigens geen SMP uitgevoerd en je gebruikt een andere tijdreeks dan de unemployment data...

Horizontaal zijn de parameters onderverdeeld onder AR 1-3, MA en SAR 1-2, SMA.
Verticaal worden de berekende modellen afgebeeld. Het eerste model wordt volledig berekend op de eerste rij. Op de volgende modellen gaat men verder filteren.
De kleur geeft aan of de parameter positief of negatief is. De waarde wordt afgebeeld door de kleur en kan je aflezen uit de onderste legende. De driehoekjes die je kan terugvinden in elk rechthoekje stellen de p-waardes voor. De waarde wordt afgebeeld door de kleur en kan je aflezen uit de onderste legende. Als dit driehoekje zwart is betekend dat de p-waarde zeker niet significant is. De p-waarde ligt dan tussen 10% en 100% waaruit we kunnen besluiten dat de parameter mag wegvallen.
2008-12-15 13:03:37 [Toon Wouters] [reply
Horizontaal zijn de parameters onderverdeeld onder AR 1-3, MA en SAR 1-2, SMA.
Verticaal worden de berekende modellen afgebeeld. Het eerste model wordt volledig berekend op de eerste rij. Op de volgende modellen gaat men verder filteren.
De kleur geeft aan of de parameter positief of negatief is. De driehoekjes die je kan terugvinden in elk rechthoekje stellen de p-waardes voor. De waarde wordt afgebeeld door de kleur en kan je aflezen uit de onderste legende. Als dit driehoekje zwart is betekend dat de p-waarde zeker niet significant is. De p-waarde ligt dan tussen 10% en 100% waaruit we kunnen besluiten dat de parameter mag wegvallen. Een rood driehoekje wil zeggen dat de p-waarde tussen 5 % en 10 % gelegen is en zeer twijfelachtig is om deze significant te noemen. Een oranje driehoekje wil zeggen dat de p-waarde gelegen is tussen 1 % en 5% wat dus significant is. Een groen driehoekje wijst op een zeer significante p-waarde gelegen tussen 0% en 1%.

Post a new message
Dataseries X:
569323
579714
577992
565464
547344
554788
562325
560854
555332
543599
536662
542722
593530
610763
612613
611324
594167
595454
590865
589379
584428
573100
567456
569028
620735
628884
628232
612117
595404
597141
593408
590072
579799
574205
572775
572942
619567
625809
619916
587625
565742
557274
560576
548854
531673
525919
511038
498662
555362
564591
541657
527070
509846
514258
516922
507561
492622
490243
469357
477580
528379


Summary of computational transaction
Raw Inputview raw input (R code)
Raw Outputview raw output of R engine
Computing time16 seconds
R Server'Herman Ole Andreas Wold' @ 193.190.124.10:1001

\begin{tabular}{lllllllll}
\hline
Summary of computational transaction \tabularnewline
Raw Input & view raw input (R code)  \tabularnewline
Raw Output & view raw output of R engine  \tabularnewline
Computing time & 16 seconds \tabularnewline
R Server & 'Herman Ole Andreas Wold' @ 193.190.124.10:1001 \tabularnewline
\hline
\end{tabular}
%Source: https://freestatistics.org/blog/index.php?pk=30648&T=0

[TABLE]
[ROW][C]Summary of computational transaction[/C][/ROW]
[ROW][C]Raw Input[/C][C]view raw input (R code) [/C][/ROW]
[ROW][C]Raw Output[/C][C]view raw output of R engine [/C][/ROW]
[ROW][C]Computing time[/C][C]16 seconds[/C][/ROW]
[ROW][C]R Server[/C][C]'Herman Ole Andreas Wold' @ 193.190.124.10:1001[/C][/ROW]
[/TABLE]
Source: https://freestatistics.org/blog/index.php?pk=30648&T=0

Globally Unique Identifier (entire table): ba.freestatistics.org/blog/index.php?pk=30648&T=0

As an alternative you can also use a QR Code:  

The GUIDs for individual cells are displayed in the table below:

Summary of computational transaction
Raw Inputview raw input (R code)
Raw Outputview raw output of R engine
Computing time16 seconds
R Server'Herman Ole Andreas Wold' @ 193.190.124.10:1001


ARIMA Parameter Estimation and Backward Selection
Iterationar1ar2ar3ma1sar1sar2sma1
Estimates ( 1 )0.66120.08160.1695-0.73250.198-0.2723-0.9996
(p-val)(0.0187 )(0.643 )(0.3393 )(0.0022 )(0.3668 )(0.2474 )(0.0917 )
Estimates ( 2 )0.705900.2084-0.73940.1895-0.2681-0.9989
(p-val)(0.0085 )(NA )(0.1708 )(0.0015 )(0.3851 )(0.2566 )(0.1018 )
Estimates ( 3 )0.709400.2094-0.74210-0.315-0.6249
(p-val)(0.0027 )(NA )(0.1768 )(4e-04 )(NA )(0.1341 )(0.085 )
Estimates ( 4 )0.031700-0.02050-0.0977-0.3927
(p-val)(0.1006 )(NA )(NA )(0.9171 )(NA )(0 )(0.0666 )
Estimates ( 5 )-0.01610000-0.4605-0.3676
(p-val)(0 )(NA )(NA )(NA )(NA )(0 )(0.0013 )
Estimates ( 6 )NANANANANANANA
(p-val)(NA )(NA )(NA )(NA )(NA )(NA )(NA )
Estimates ( 7 )NANANANANANANA
(p-val)(NA )(NA )(NA )(NA )(NA )(NA )(NA )
Estimates ( 8 )NANANANANANANA
(p-val)(NA )(NA )(NA )(NA )(NA )(NA )(NA )
Estimates ( 9 )NANANANANANANA
(p-val)(NA )(NA )(NA )(NA )(NA )(NA )(NA )
Estimates ( 10 )NANANANANANANA
(p-val)(NA )(NA )(NA )(NA )(NA )(NA )(NA )
Estimates ( 11 )NANANANANANANA
(p-val)(NA )(NA )(NA )(NA )(NA )(NA )(NA )
Estimates ( 12 )NANANANANANANA
(p-val)(NA )(NA )(NA )(NA )(NA )(NA )(NA )
Estimates ( 13 )NANANANANANANA
(p-val)(NA )(NA )(NA )(NA )(NA )(NA )(NA )

\begin{tabular}{lllllllll}
\hline
ARIMA Parameter Estimation and Backward Selection \tabularnewline
Iteration & ar1 & ar2 & ar3 & ma1 & sar1 & sar2 & sma1 \tabularnewline
Estimates ( 1 ) & 0.6612 & 0.0816 & 0.1695 & -0.7325 & 0.198 & -0.2723 & -0.9996 \tabularnewline
(p-val) & (0.0187 ) & (0.643 ) & (0.3393 ) & (0.0022 ) & (0.3668 ) & (0.2474 ) & (0.0917 ) \tabularnewline
Estimates ( 2 ) & 0.7059 & 0 & 0.2084 & -0.7394 & 0.1895 & -0.2681 & -0.9989 \tabularnewline
(p-val) & (0.0085 ) & (NA ) & (0.1708 ) & (0.0015 ) & (0.3851 ) & (0.2566 ) & (0.1018 ) \tabularnewline
Estimates ( 3 ) & 0.7094 & 0 & 0.2094 & -0.7421 & 0 & -0.315 & -0.6249 \tabularnewline
(p-val) & (0.0027 ) & (NA ) & (0.1768 ) & (4e-04 ) & (NA ) & (0.1341 ) & (0.085 ) \tabularnewline
Estimates ( 4 ) & 0.0317 & 0 & 0 & -0.0205 & 0 & -0.0977 & -0.3927 \tabularnewline
(p-val) & (0.1006 ) & (NA ) & (NA ) & (0.9171 ) & (NA ) & (0 ) & (0.0666 ) \tabularnewline
Estimates ( 5 ) & -0.0161 & 0 & 0 & 0 & 0 & -0.4605 & -0.3676 \tabularnewline
(p-val) & (0 ) & (NA ) & (NA ) & (NA ) & (NA ) & (0 ) & (0.0013 ) \tabularnewline
Estimates ( 6 ) & NA & NA & NA & NA & NA & NA & NA \tabularnewline
(p-val) & (NA ) & (NA ) & (NA ) & (NA ) & (NA ) & (NA ) & (NA ) \tabularnewline
Estimates ( 7 ) & NA & NA & NA & NA & NA & NA & NA \tabularnewline
(p-val) & (NA ) & (NA ) & (NA ) & (NA ) & (NA ) & (NA ) & (NA ) \tabularnewline
Estimates ( 8 ) & NA & NA & NA & NA & NA & NA & NA \tabularnewline
(p-val) & (NA ) & (NA ) & (NA ) & (NA ) & (NA ) & (NA ) & (NA ) \tabularnewline
Estimates ( 9 ) & NA & NA & NA & NA & NA & NA & NA \tabularnewline
(p-val) & (NA ) & (NA ) & (NA ) & (NA ) & (NA ) & (NA ) & (NA ) \tabularnewline
Estimates ( 10 ) & NA & NA & NA & NA & NA & NA & NA \tabularnewline
(p-val) & (NA ) & (NA ) & (NA ) & (NA ) & (NA ) & (NA ) & (NA ) \tabularnewline
Estimates ( 11 ) & NA & NA & NA & NA & NA & NA & NA \tabularnewline
(p-val) & (NA ) & (NA ) & (NA ) & (NA ) & (NA ) & (NA ) & (NA ) \tabularnewline
Estimates ( 12 ) & NA & NA & NA & NA & NA & NA & NA \tabularnewline
(p-val) & (NA ) & (NA ) & (NA ) & (NA ) & (NA ) & (NA ) & (NA ) \tabularnewline
Estimates ( 13 ) & NA & NA & NA & NA & NA & NA & NA \tabularnewline
(p-val) & (NA ) & (NA ) & (NA ) & (NA ) & (NA ) & (NA ) & (NA ) \tabularnewline
\hline
\end{tabular}
%Source: https://freestatistics.org/blog/index.php?pk=30648&T=1

[TABLE]
[ROW][C]ARIMA Parameter Estimation and Backward Selection[/C][/ROW]
[ROW][C]Iteration[/C][C]ar1[/C][C]ar2[/C][C]ar3[/C][C]ma1[/C][C]sar1[/C][C]sar2[/C][C]sma1[/C][/ROW]
[ROW][C]Estimates ( 1 )[/C][C]0.6612[/C][C]0.0816[/C][C]0.1695[/C][C]-0.7325[/C][C]0.198[/C][C]-0.2723[/C][C]-0.9996[/C][/ROW]
[ROW][C](p-val)[/C][C](0.0187 )[/C][C](0.643 )[/C][C](0.3393 )[/C][C](0.0022 )[/C][C](0.3668 )[/C][C](0.2474 )[/C][C](0.0917 )[/C][/ROW]
[ROW][C]Estimates ( 2 )[/C][C]0.7059[/C][C]0[/C][C]0.2084[/C][C]-0.7394[/C][C]0.1895[/C][C]-0.2681[/C][C]-0.9989[/C][/ROW]
[ROW][C](p-val)[/C][C](0.0085 )[/C][C](NA )[/C][C](0.1708 )[/C][C](0.0015 )[/C][C](0.3851 )[/C][C](0.2566 )[/C][C](0.1018 )[/C][/ROW]
[ROW][C]Estimates ( 3 )[/C][C]0.7094[/C][C]0[/C][C]0.2094[/C][C]-0.7421[/C][C]0[/C][C]-0.315[/C][C]-0.6249[/C][/ROW]
[ROW][C](p-val)[/C][C](0.0027 )[/C][C](NA )[/C][C](0.1768 )[/C][C](4e-04 )[/C][C](NA )[/C][C](0.1341 )[/C][C](0.085 )[/C][/ROW]
[ROW][C]Estimates ( 4 )[/C][C]0.0317[/C][C]0[/C][C]0[/C][C]-0.0205[/C][C]0[/C][C]-0.0977[/C][C]-0.3927[/C][/ROW]
[ROW][C](p-val)[/C][C](0.1006 )[/C][C](NA )[/C][C](NA )[/C][C](0.9171 )[/C][C](NA )[/C][C](0 )[/C][C](0.0666 )[/C][/ROW]
[ROW][C]Estimates ( 5 )[/C][C]-0.0161[/C][C]0[/C][C]0[/C][C]0[/C][C]0[/C][C]-0.4605[/C][C]-0.3676[/C][/ROW]
[ROW][C](p-val)[/C][C](0 )[/C][C](NA )[/C][C](NA )[/C][C](NA )[/C][C](NA )[/C][C](0 )[/C][C](0.0013 )[/C][/ROW]
[ROW][C]Estimates ( 6 )[/C][C]NA[/C][C]NA[/C][C]NA[/C][C]NA[/C][C]NA[/C][C]NA[/C][C]NA[/C][/ROW]
[ROW][C](p-val)[/C][C](NA )[/C][C](NA )[/C][C](NA )[/C][C](NA )[/C][C](NA )[/C][C](NA )[/C][C](NA )[/C][/ROW]
[ROW][C]Estimates ( 7 )[/C][C]NA[/C][C]NA[/C][C]NA[/C][C]NA[/C][C]NA[/C][C]NA[/C][C]NA[/C][/ROW]
[ROW][C](p-val)[/C][C](NA )[/C][C](NA )[/C][C](NA )[/C][C](NA )[/C][C](NA )[/C][C](NA )[/C][C](NA )[/C][/ROW]
[ROW][C]Estimates ( 8 )[/C][C]NA[/C][C]NA[/C][C]NA[/C][C]NA[/C][C]NA[/C][C]NA[/C][C]NA[/C][/ROW]
[ROW][C](p-val)[/C][C](NA )[/C][C](NA )[/C][C](NA )[/C][C](NA )[/C][C](NA )[/C][C](NA )[/C][C](NA )[/C][/ROW]
[ROW][C]Estimates ( 9 )[/C][C]NA[/C][C]NA[/C][C]NA[/C][C]NA[/C][C]NA[/C][C]NA[/C][C]NA[/C][/ROW]
[ROW][C](p-val)[/C][C](NA )[/C][C](NA )[/C][C](NA )[/C][C](NA )[/C][C](NA )[/C][C](NA )[/C][C](NA )[/C][/ROW]
[ROW][C]Estimates ( 10 )[/C][C]NA[/C][C]NA[/C][C]NA[/C][C]NA[/C][C]NA[/C][C]NA[/C][C]NA[/C][/ROW]
[ROW][C](p-val)[/C][C](NA )[/C][C](NA )[/C][C](NA )[/C][C](NA )[/C][C](NA )[/C][C](NA )[/C][C](NA )[/C][/ROW]
[ROW][C]Estimates ( 11 )[/C][C]NA[/C][C]NA[/C][C]NA[/C][C]NA[/C][C]NA[/C][C]NA[/C][C]NA[/C][/ROW]
[ROW][C](p-val)[/C][C](NA )[/C][C](NA )[/C][C](NA )[/C][C](NA )[/C][C](NA )[/C][C](NA )[/C][C](NA )[/C][/ROW]
[ROW][C]Estimates ( 12 )[/C][C]NA[/C][C]NA[/C][C]NA[/C][C]NA[/C][C]NA[/C][C]NA[/C][C]NA[/C][/ROW]
[ROW][C](p-val)[/C][C](NA )[/C][C](NA )[/C][C](NA )[/C][C](NA )[/C][C](NA )[/C][C](NA )[/C][C](NA )[/C][/ROW]
[ROW][C]Estimates ( 13 )[/C][C]NA[/C][C]NA[/C][C]NA[/C][C]NA[/C][C]NA[/C][C]NA[/C][C]NA[/C][/ROW]
[ROW][C](p-val)[/C][C](NA )[/C][C](NA )[/C][C](NA )[/C][C](NA )[/C][C](NA )[/C][C](NA )[/C][C](NA )[/C][/ROW]
[/TABLE]
Source: https://freestatistics.org/blog/index.php?pk=30648&T=1

Globally Unique Identifier (entire table): ba.freestatistics.org/blog/index.php?pk=30648&T=1

As an alternative you can also use a QR Code:  

The GUIDs for individual cells are displayed in the table below:

ARIMA Parameter Estimation and Backward Selection
Iterationar1ar2ar3ma1sar1sar2sma1
Estimates ( 1 )0.66120.08160.1695-0.73250.198-0.2723-0.9996
(p-val)(0.0187 )(0.643 )(0.3393 )(0.0022 )(0.3668 )(0.2474 )(0.0917 )
Estimates ( 2 )0.705900.2084-0.73940.1895-0.2681-0.9989
(p-val)(0.0085 )(NA )(0.1708 )(0.0015 )(0.3851 )(0.2566 )(0.1018 )
Estimates ( 3 )0.709400.2094-0.74210-0.315-0.6249
(p-val)(0.0027 )(NA )(0.1768 )(4e-04 )(NA )(0.1341 )(0.085 )
Estimates ( 4 )0.031700-0.02050-0.0977-0.3927
(p-val)(0.1006 )(NA )(NA )(0.9171 )(NA )(0 )(0.0666 )
Estimates ( 5 )-0.01610000-0.4605-0.3676
(p-val)(0 )(NA )(NA )(NA )(NA )(0 )(0.0013 )
Estimates ( 6 )NANANANANANANA
(p-val)(NA )(NA )(NA )(NA )(NA )(NA )(NA )
Estimates ( 7 )NANANANANANANA
(p-val)(NA )(NA )(NA )(NA )(NA )(NA )(NA )
Estimates ( 8 )NANANANANANANA
(p-val)(NA )(NA )(NA )(NA )(NA )(NA )(NA )
Estimates ( 9 )NANANANANANANA
(p-val)(NA )(NA )(NA )(NA )(NA )(NA )(NA )
Estimates ( 10 )NANANANANANANA
(p-val)(NA )(NA )(NA )(NA )(NA )(NA )(NA )
Estimates ( 11 )NANANANANANANA
(p-val)(NA )(NA )(NA )(NA )(NA )(NA )(NA )
Estimates ( 12 )NANANANANANANA
(p-val)(NA )(NA )(NA )(NA )(NA )(NA )(NA )
Estimates ( 13 )NANANANANANANA
(p-val)(NA )(NA )(NA )(NA )(NA )(NA )(NA )


Estimated ARIMA Residuals
Value
-2.54559220444530
3.93612978041446
2.09931533304134
6.88535003705783
0.937028490982262
-3.88637688567597
-7.39014853852947
0.0944710418951738
0.429334568098386
0.426990876356488
0.902183176259358
-2.86809375305491
-0.130657532617223
-4.44235743927691
-0.7677241765272
-6.93775237401534
0.6907862815295
-0.949215429388749
-1.80786326996833
-1.14476574242982
-3.23879743152898
3.83067893393431
2.96191390458941
-1.85102020532775
-3.26833259217514
-2.45983844073095
-3.37226753511391
-12.3808050616273
-3.15947188270855
-7.47185184213447
3.22159948549944
-6.151427455063
-6.07416339861362
1.28427125014934
-8.12466980644917
-9.682138973848
7.67510684951314
0.570461357000769
-13.1753888576797
5.17122125975641
1.13348679923881
5.8065115825974
0.862403613162026
-1.19063361431743
-1.6027875707032
3.11824815675727
-7.67203785173345
10.8497492906862
-0.726109121395147

\begin{tabular}{lllllllll}
\hline
Estimated ARIMA Residuals \tabularnewline
Value \tabularnewline
-2.54559220444530 \tabularnewline
3.93612978041446 \tabularnewline
2.09931533304134 \tabularnewline
6.88535003705783 \tabularnewline
0.937028490982262 \tabularnewline
-3.88637688567597 \tabularnewline
-7.39014853852947 \tabularnewline
0.0944710418951738 \tabularnewline
0.429334568098386 \tabularnewline
0.426990876356488 \tabularnewline
0.902183176259358 \tabularnewline
-2.86809375305491 \tabularnewline
-0.130657532617223 \tabularnewline
-4.44235743927691 \tabularnewline
-0.7677241765272 \tabularnewline
-6.93775237401534 \tabularnewline
0.6907862815295 \tabularnewline
-0.949215429388749 \tabularnewline
-1.80786326996833 \tabularnewline
-1.14476574242982 \tabularnewline
-3.23879743152898 \tabularnewline
3.83067893393431 \tabularnewline
2.96191390458941 \tabularnewline
-1.85102020532775 \tabularnewline
-3.26833259217514 \tabularnewline
-2.45983844073095 \tabularnewline
-3.37226753511391 \tabularnewline
-12.3808050616273 \tabularnewline
-3.15947188270855 \tabularnewline
-7.47185184213447 \tabularnewline
3.22159948549944 \tabularnewline
-6.151427455063 \tabularnewline
-6.07416339861362 \tabularnewline
1.28427125014934 \tabularnewline
-8.12466980644917 \tabularnewline
-9.682138973848 \tabularnewline
7.67510684951314 \tabularnewline
0.570461357000769 \tabularnewline
-13.1753888576797 \tabularnewline
5.17122125975641 \tabularnewline
1.13348679923881 \tabularnewline
5.8065115825974 \tabularnewline
0.862403613162026 \tabularnewline
-1.19063361431743 \tabularnewline
-1.6027875707032 \tabularnewline
3.11824815675727 \tabularnewline
-7.67203785173345 \tabularnewline
10.8497492906862 \tabularnewline
-0.726109121395147 \tabularnewline
\hline
\end{tabular}
%Source: https://freestatistics.org/blog/index.php?pk=30648&T=2

[TABLE]
[ROW][C]Estimated ARIMA Residuals[/C][/ROW]
[ROW][C]Value[/C][/ROW]
[ROW][C]-2.54559220444530[/C][/ROW]
[ROW][C]3.93612978041446[/C][/ROW]
[ROW][C]2.09931533304134[/C][/ROW]
[ROW][C]6.88535003705783[/C][/ROW]
[ROW][C]0.937028490982262[/C][/ROW]
[ROW][C]-3.88637688567597[/C][/ROW]
[ROW][C]-7.39014853852947[/C][/ROW]
[ROW][C]0.0944710418951738[/C][/ROW]
[ROW][C]0.429334568098386[/C][/ROW]
[ROW][C]0.426990876356488[/C][/ROW]
[ROW][C]0.902183176259358[/C][/ROW]
[ROW][C]-2.86809375305491[/C][/ROW]
[ROW][C]-0.130657532617223[/C][/ROW]
[ROW][C]-4.44235743927691[/C][/ROW]
[ROW][C]-0.7677241765272[/C][/ROW]
[ROW][C]-6.93775237401534[/C][/ROW]
[ROW][C]0.6907862815295[/C][/ROW]
[ROW][C]-0.949215429388749[/C][/ROW]
[ROW][C]-1.80786326996833[/C][/ROW]
[ROW][C]-1.14476574242982[/C][/ROW]
[ROW][C]-3.23879743152898[/C][/ROW]
[ROW][C]3.83067893393431[/C][/ROW]
[ROW][C]2.96191390458941[/C][/ROW]
[ROW][C]-1.85102020532775[/C][/ROW]
[ROW][C]-3.26833259217514[/C][/ROW]
[ROW][C]-2.45983844073095[/C][/ROW]
[ROW][C]-3.37226753511391[/C][/ROW]
[ROW][C]-12.3808050616273[/C][/ROW]
[ROW][C]-3.15947188270855[/C][/ROW]
[ROW][C]-7.47185184213447[/C][/ROW]
[ROW][C]3.22159948549944[/C][/ROW]
[ROW][C]-6.151427455063[/C][/ROW]
[ROW][C]-6.07416339861362[/C][/ROW]
[ROW][C]1.28427125014934[/C][/ROW]
[ROW][C]-8.12466980644917[/C][/ROW]
[ROW][C]-9.682138973848[/C][/ROW]
[ROW][C]7.67510684951314[/C][/ROW]
[ROW][C]0.570461357000769[/C][/ROW]
[ROW][C]-13.1753888576797[/C][/ROW]
[ROW][C]5.17122125975641[/C][/ROW]
[ROW][C]1.13348679923881[/C][/ROW]
[ROW][C]5.8065115825974[/C][/ROW]
[ROW][C]0.862403613162026[/C][/ROW]
[ROW][C]-1.19063361431743[/C][/ROW]
[ROW][C]-1.6027875707032[/C][/ROW]
[ROW][C]3.11824815675727[/C][/ROW]
[ROW][C]-7.67203785173345[/C][/ROW]
[ROW][C]10.8497492906862[/C][/ROW]
[ROW][C]-0.726109121395147[/C][/ROW]
[/TABLE]
Source: https://freestatistics.org/blog/index.php?pk=30648&T=2

Globally Unique Identifier (entire table): ba.freestatistics.org/blog/index.php?pk=30648&T=2

As an alternative you can also use a QR Code:  

The GUIDs for individual cells are displayed in the table below:

Estimated ARIMA Residuals
Value
-2.54559220444530
3.93612978041446
2.09931533304134
6.88535003705783
0.937028490982262
-3.88637688567597
-7.39014853852947
0.0944710418951738
0.429334568098386
0.426990876356488
0.902183176259358
-2.86809375305491
-0.130657532617223
-4.44235743927691
-0.7677241765272
-6.93775237401534
0.6907862815295
-0.949215429388749
-1.80786326996833
-1.14476574242982
-3.23879743152898
3.83067893393431
2.96191390458941
-1.85102020532775
-3.26833259217514
-2.45983844073095
-3.37226753511391
-12.3808050616273
-3.15947188270855
-7.47185184213447
3.22159948549944
-6.151427455063
-6.07416339861362
1.28427125014934
-8.12466980644917
-9.682138973848
7.67510684951314
0.570461357000769
-13.1753888576797
5.17122125975641
1.13348679923881
5.8065115825974
0.862403613162026
-1.19063361431743
-1.6027875707032
3.11824815675727
-7.67203785173345
10.8497492906862
-0.726109121395147


Parameters (Session):
par1 = FALSE ; par2 = 0.5 ; par3 = 1 ; par4 = 1 ; par5 = 12 ; par6 = 3 ; par7 = 1 ; par8 = 2 ; par9 = 1 ;
Parameters (R input):
par1 = FALSE ; par2 = 0.5 ; par3 = 1 ; par4 = 1 ; par5 = 12 ; par6 = 3 ; par7 = 1 ; par8 = 2 ; par9 = 1 ;
R code (references can be found in the software module):
library(lattice)
if (par1 == 'TRUE') par1 <- TRUE
if (par1 == 'FALSE') par1 <- FALSE
par2 <- as.numeric(par2) #Box-Cox lambda transformation parameter
par3 <- as.numeric(par3) #degree of non-seasonal differencing
par4 <- as.numeric(par4) #degree of seasonal differencing
par5 <- as.numeric(par5) #seasonal period
par6 <- as.numeric(par6) #degree (p) of the non-seasonal AR(p) polynomial
par7 <- as.numeric(par7) #degree (q) of the non-seasonal MA(q) polynomial
par8 <- as.numeric(par8) #degree (P) of the seasonal AR(P) polynomial
par9 <- as.numeric(par9) #degree (Q) of the seasonal MA(Q) polynomial
armaGR <- function(arima.out, names, n){
try1 <- arima.out$coef
try2 <- sqrt(diag(arima.out$var.coef))
try.data.frame <- data.frame(matrix(NA,ncol=4,nrow=length(names)))
dimnames(try.data.frame) <- list(names,c('coef','std','tstat','pv'))
try.data.frame[,1] <- try1
for(i in 1:length(try2)) try.data.frame[which(rownames(try.data.frame)==names(try2)[i]),2] <- try2[i]
try.data.frame[,3] <- try.data.frame[,1] / try.data.frame[,2]
try.data.frame[,4] <- round((1-pt(abs(try.data.frame[,3]),df=n-(length(try2)+1)))*2,5)
vector <- rep(NA,length(names))
vector[is.na(try.data.frame[,4])] <- 0
maxi <- which.max(try.data.frame[,4])
continue <- max(try.data.frame[,4],na.rm=TRUE) > .05
vector[maxi] <- 0
list(summary=try.data.frame,next.vector=vector,continue=continue)
}
arimaSelect <- function(series, order=c(13,0,0), seasonal=list(order=c(2,0,0),period=12), include.mean=F){
nrc <- order[1]+order[3]+seasonal$order[1]+seasonal$order[3]
coeff <- matrix(NA, nrow=nrc*2, ncol=nrc)
pval <- matrix(NA, nrow=nrc*2, ncol=nrc)
mylist <- rep(list(NULL), nrc)
names <- NULL
if(order[1] > 0) names <- paste('ar',1:order[1],sep='')
if(order[3] > 0) names <- c( names , paste('ma',1:order[3],sep='') )
if(seasonal$order[1] > 0) names <- c(names, paste('sar',1:seasonal$order[1],sep=''))
if(seasonal$order[3] > 0) names <- c(names, paste('sma',1:seasonal$order[3],sep=''))
arima.out <- arima(series, order=order, seasonal=seasonal, include.mean=include.mean, method='ML')
mylist[[1]] <- arima.out
last.arma <- armaGR(arima.out, names, length(series))
mystop <- FALSE
i <- 1
coeff[i,] <- last.arma[[1]][,1]
pval [i,] <- last.arma[[1]][,4]
i <- 2
aic <- arima.out$aic
while(!mystop){
mylist[[i]] <- arima.out
arima.out <- arima(series, order=order, seasonal=seasonal, include.mean=include.mean, method='ML', fixed=last.arma$next.vector)
aic <- c(aic, arima.out$aic)
last.arma <- armaGR(arima.out, names, length(series))
mystop <- !last.arma$continue
coeff[i,] <- last.arma[[1]][,1]
pval [i,] <- last.arma[[1]][,4]
i <- i+1
}
list(coeff, pval, mylist, aic=aic)
}
arimaSelectplot <- function(arimaSelect.out,noms,choix){
noms <- names(arimaSelect.out[[3]][[1]]$coef)
coeff <- arimaSelect.out[[1]]
k <- min(which(is.na(coeff[,1])))-1
coeff <- coeff[1:k,]
pval <- arimaSelect.out[[2]][1:k,]
aic <- arimaSelect.out$aic[1:k]
coeff[coeff==0] <- NA
n <- ncol(coeff)
if(missing(choix)) choix <- k
layout(matrix(c(1,1,1,2,
3,3,3,2,
3,3,3,4,
5,6,7,7),nr=4),
widths=c(10,35,45,15),
heights=c(30,30,15,15))
couleurs <- rainbow(75)[1:50]#(50)
ticks <- pretty(coeff)
par(mar=c(1,1,3,1))
plot(aic,k:1-.5,type='o',pch=21,bg='blue',cex=2,axes=F,lty=2,xpd=NA)
points(aic[choix],k-choix+.5,pch=21,cex=4,bg=2,xpd=NA)
title('aic',line=2)
par(mar=c(3,0,0,0))
plot(0,axes=F,xlab='',ylab='',xlim=range(ticks),ylim=c(.1,1))
rect(xleft = min(ticks) + (0:49)/50*(max(ticks)-min(ticks)),
xright = min(ticks) + (1:50)/50*(max(ticks)-min(ticks)),
ytop = rep(1,50),
ybottom= rep(0,50),col=couleurs,border=NA)
axis(1,ticks)
rect(xleft=min(ticks),xright=max(ticks),ytop=1,ybottom=0)
text(mean(coeff,na.rm=T),.5,'coefficients',cex=2,font=2)
par(mar=c(1,1,3,1))
image(1:n,1:k,t(coeff[k:1,]),axes=F,col=couleurs,zlim=range(ticks))
for(i in 1:n) for(j in 1:k) if(!is.na(coeff[j,i])) {
if(pval[j,i]<.01) symb = 'green'
else if( (pval[j,i]<.05) & (pval[j,i]>=.01)) symb = 'orange'
else if( (pval[j,i]<.1) & (pval[j,i]>=.05)) symb = 'red'
else symb = 'black'
polygon(c(i+.5 ,i+.2 ,i+.5 ,i+.5),
c(k-j+0.5,k-j+0.5,k-j+0.8,k-j+0.5),
col=symb)
if(j==choix) {
rect(xleft=i-.5,
xright=i+.5,
ybottom=k-j+1.5,
ytop=k-j+.5,
lwd=4)
text(i,
k-j+1,
round(coeff[j,i],2),
cex=1.2,
font=2)
}
else{
rect(xleft=i-.5,xright=i+.5,ybottom=k-j+1.5,ytop=k-j+.5)
text(i,k-j+1,round(coeff[j,i],2),cex=1.2,font=1)
}
}
axis(3,1:n,noms)
par(mar=c(0.5,0,0,0.5))
plot(0,axes=F,xlab='',ylab='',type='n',xlim=c(0,8),ylim=c(-.2,.8))
cols <- c('green','orange','red','black')
niv <- c('0','0.01','0.05','0.1')
for(i in 0:3){
polygon(c(1+2*i ,1+2*i ,1+2*i-.5 ,1+2*i),
c(.4 ,.7 , .4 , .4),
col=cols[i+1])
text(2*i,0.5,niv[i+1],cex=1.5)
}
text(8,.5,1,cex=1.5)
text(4,0,'p-value',cex=2)
box()
residus <- arimaSelect.out[[3]][[choix]]$res
par(mar=c(1,2,4,1))
acf(residus,main='')
title('acf',line=.5)
par(mar=c(1,2,4,1))
pacf(residus,main='')
title('pacf',line=.5)
par(mar=c(2,2,4,1))
qqnorm(residus,main='')
title('qq-norm',line=.5)
qqline(residus)
residus
}
if (par2 == 0) x <- log(x)
if (par2 != 0) x <- x^par2
(selection <- arimaSelect(x, order=c(par6,par3,par7), seasonal=list(order=c(par8,par4,par9), period=par5)))
bitmap(file='test1.png')
resid <- arimaSelectplot(selection)
dev.off()
resid
bitmap(file='test2.png')
acf(resid,length(resid)/2, main='Residual Autocorrelation Function')
dev.off()
bitmap(file='test3.png')
pacf(resid,length(resid)/2, main='Residual Partial Autocorrelation Function')
dev.off()
bitmap(file='test4.png')
cpgram(resid, main='Residual Cumulative Periodogram')
dev.off()
bitmap(file='test5.png')
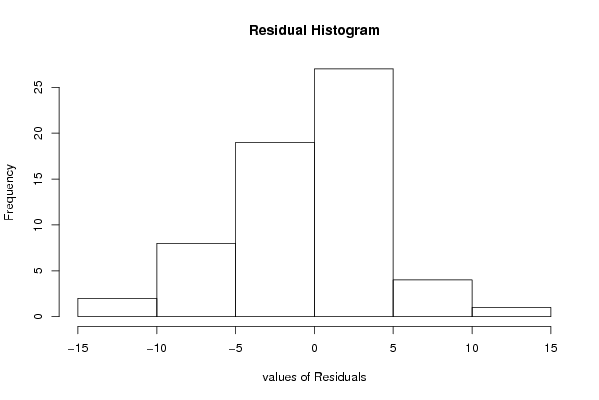
hist(resid, main='Residual Histogram', xlab='values of Residuals')
dev.off()
bitmap(file='test6.png')
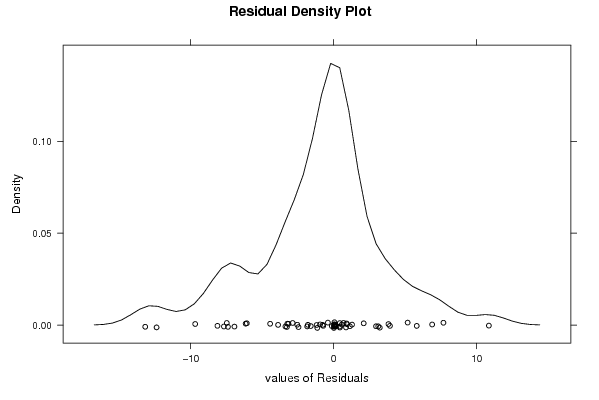
densityplot(~resid,col='black',main='Residual Density Plot', xlab='values of Residuals')
dev.off()
bitmap(file='test7.png')
qqnorm(resid, main='Residual Normal Q-Q Plot')
qqline(resid)
dev.off()
ncols <- length(selection[[1]][1,])
nrows <- length(selection[[2]][,1])-1
load(file='createtable')
a<-table.start()
a<-table.row.start(a)
a<-table.element(a,'ARIMA Parameter Estimation and Backward Selection', ncols+1,TRUE)
a<-table.row.end(a)
a<-table.row.start(a)
a<-table.element(a,'Iteration', header=TRUE)
for (i in 1:ncols) {
a<-table.element(a,names(selection[[3]][[1]]$coef)[i],header=TRUE)
}
a<-table.row.end(a)
for (j in 1:nrows) {
a<-table.row.start(a)
mydum <- 'Estimates ('
mydum <- paste(mydum,j)
mydum <- paste(mydum,')')
a<-table.element(a,mydum, header=TRUE)
for (i in 1:ncols) {
a<-table.element(a,round(selection[[1]][j,i],4))
}
a<-table.row.end(a)
a<-table.row.start(a)
a<-table.element(a,'(p-val)', header=TRUE)
for (i in 1:ncols) {
mydum <- '('
mydum <- paste(mydum,round(selection[[2]][j,i],4),sep='')
mydum <- paste(mydum,')')
a<-table.element(a,mydum)
}
a<-table.row.end(a)
}
a<-table.end(a)
table.save(a,file='mytable.tab')
a<-table.start()
a<-table.row.start(a)
a<-table.element(a,'Estimated ARIMA Residuals', 1,TRUE)
a<-table.row.end(a)
a<-table.row.start(a)
a<-table.element(a,'Value', 1,TRUE)
a<-table.row.end(a)
for (i in (par4*par5+par3):length(resid)) {
a<-table.row.start(a)
a<-table.element(a,resid[i])
a<-table.row.end(a)
}
a<-table.end(a)
table.save(a,file='mytable1.tab')