Free Statistics

of Irreproducible Research!

Author's title

Author*The author of this computation has been verified*
R Software Modulerwasp_autocorrelation.wasp
Title produced by software(Partial) Autocorrelation Function
Date of computationMon, 08 Dec 2008 11:23:47 -0700
Cite this page as followsStatistical Computations at FreeStatistics.org, Office for Research Development and Education, URL https://freestatistics.org/blog/index.php?v=date/2008/Dec/08/t1228760678h9cmskh9ii3fvl4.htm/, Retrieved Thu, 16 May 2024 10:23:10 +0000
Statistical Computations at FreeStatistics.org, Office for Research Development and Education, URL https://freestatistics.org/blog/index.php?pk=30645, Retrieved Thu, 16 May 2024 10:23:10 +0000
QR Codes:

Original text written by user:
IsPrivate?No (this computation is public)
User-defined keywords
Estimated Impact194
Family? (F = Feedback message, R = changed R code, M = changed R Module, P = changed Parameters, D = changed Data)
-     [Univariate Data Series] [data set] [2008-12-01 19:54:57] [b98453cac15ba1066b407e146608df68]
- RMP   [(Partial) Autocorrelation Function] [ACF] [2008-12-05 06:53:00] [c5a66f1c8528a963efc2b82a8519f117]
-    D    [(Partial) Autocorrelation Function] [ACF bouwvergunnin...] [2008-12-05 13:00:50] [c5a66f1c8528a963efc2b82a8519f117]
-   PD        [(Partial) Autocorrelation Function] [ACF - woninghuur ...] [2008-12-08 18:23:47] [b4fc5040f26b33db57f84cfb8d1d2b82] [Current]
Feedback Forum

Post a new message
Dataseries X:
106.6
106.8
107
107.1
107.3
107.4
107.6
107.7
107.9
108.2
108.3
108.5
108.92
109.23
109.41
109.65
109.91
110.01
110.2
110.49
110.57
110.72
110.94
111.09
111.28
111.41
111.62
111.76
111.89
112.04
112.12
112.3
112.47
112.59
112.78
112.73
112.99
113.1
113.33
113.38
113.68
113.65
113.81
113.88
114.02
114.25
114.28
114.38
114.73
114.97
115.05
115.29
115.37
115.54
115.76
115.92
116.02
116.21
116.26
116.51


Summary of computational transaction
Raw Inputview raw input (R code)
Raw Outputview raw output of R engine
Computing time1 seconds
R Server'George Udny Yule' @ 72.249.76.132

\begin{tabular}{lllllllll}
\hline
Summary of computational transaction \tabularnewline
Raw Input & view raw input (R code)  \tabularnewline
Raw Output & view raw output of R engine  \tabularnewline
Computing time & 1 seconds \tabularnewline
R Server & 'George Udny Yule' @ 72.249.76.132 \tabularnewline
\hline
\end{tabular}
%Source: https://freestatistics.org/blog/index.php?pk=30645&T=0

[TABLE]
[ROW][C]Summary of computational transaction[/C][/ROW]
[ROW][C]Raw Input[/C][C]view raw input (R code) [/C][/ROW]
[ROW][C]Raw Output[/C][C]view raw output of R engine [/C][/ROW]
[ROW][C]Computing time[/C][C]1 seconds[/C][/ROW]
[ROW][C]R Server[/C][C]'George Udny Yule' @ 72.249.76.132[/C][/ROW]
[/TABLE]
Source: https://freestatistics.org/blog/index.php?pk=30645&T=0

Globally Unique Identifier (entire table): ba.freestatistics.org/blog/index.php?pk=30645&T=0

As an alternative you can also use a QR Code:  

The GUIDs for individual cells are displayed in the table below:

Summary of computational transaction
Raw Inputview raw input (R code)
Raw Outputview raw output of R engine
Computing time1 seconds
R Server'George Udny Yule' @ 72.249.76.132


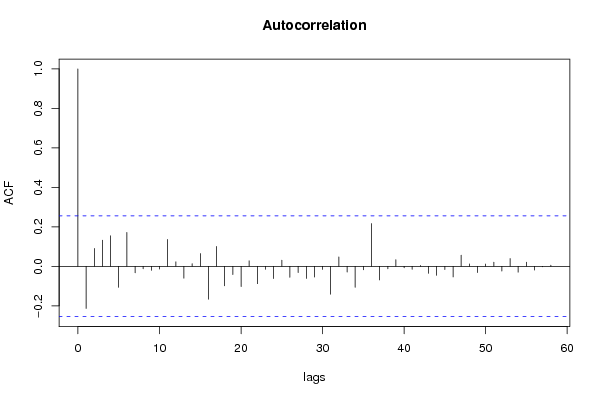
Autocorrelation Function
Time lag kACF(k)T-STATP-value
1-0.2137-1.64150.053011
20.0906690.69640.244443
30.1322971.01620.156843
40.1544061.1860.120186
5-0.106232-0.8160.208896
60.1716231.31830.096256
7-0.032878-0.25250.400752
8-0.012469-0.09580.462013
9-0.020103-0.15440.438904
10-0.014236-0.10930.456649
110.1359411.04420.15033
120.0229520.17630.430333
13-0.060196-0.46240.322758
140.0133570.10260.459314
150.0644620.49510.311168
16-0.166371-1.27790.103141
170.1007580.77390.221028
18-0.099182-0.76180.224598
19-0.041973-0.32240.374146
20-0.1026-0.78810.216902
210.0278530.21390.415664
22-0.08838-0.67890.249941
23-0.015054-0.11560.454167
24-0.062122-0.47720.317502
250.0310490.23850.406164
26-0.055858-0.42910.334723
27-0.031553-0.24240.40467
28-0.061374-0.47140.319539
29-0.054623-0.41960.338164
30-0.01576-0.12110.452028
31-0.141296-1.08530.141098
320.047570.36540.358062
33-0.029298-0.2250.411362
34-0.106356-0.81690.208626
35-0.017662-0.13570.446275
360.2168561.66570.050537
37-0.068852-0.52890.299444
38-0.012731-0.09780.461215
390.0333360.25610.399399
40-0.007594-0.05830.476842
41-0.015521-0.11920.452754
420.0043460.03340.486742
43-0.035628-0.27370.39265
44-0.045759-0.35150.36324
45-0.016366-0.12570.450195
46-0.053835-0.41350.340363
470.0561880.43160.333808
480.0116920.08980.464372
49-0.031525-0.24210.404752
500.0110510.08490.466319
510.0210990.16210.435903
52-0.024075-0.18490.426961
530.0389080.29890.383049
54-0.029735-0.22840.410062
550.0205350.15770.437603
56-0.019359-0.14870.44115
57-0.002576-0.01980.492139
580.0058820.04520.482058
59NANANA
60NANANA

\begin{tabular}{lllllllll}
\hline
Autocorrelation Function \tabularnewline
Time lag k & ACF(k) & T-STAT & P-value \tabularnewline
1 & -0.2137 & -1.6415 & 0.053011 \tabularnewline
2 & 0.090669 & 0.6964 & 0.244443 \tabularnewline
3 & 0.132297 & 1.0162 & 0.156843 \tabularnewline
4 & 0.154406 & 1.186 & 0.120186 \tabularnewline
5 & -0.106232 & -0.816 & 0.208896 \tabularnewline
6 & 0.171623 & 1.3183 & 0.096256 \tabularnewline
7 & -0.032878 & -0.2525 & 0.400752 \tabularnewline
8 & -0.012469 & -0.0958 & 0.462013 \tabularnewline
9 & -0.020103 & -0.1544 & 0.438904 \tabularnewline
10 & -0.014236 & -0.1093 & 0.456649 \tabularnewline
11 & 0.135941 & 1.0442 & 0.15033 \tabularnewline
12 & 0.022952 & 0.1763 & 0.430333 \tabularnewline
13 & -0.060196 & -0.4624 & 0.322758 \tabularnewline
14 & 0.013357 & 0.1026 & 0.459314 \tabularnewline
15 & 0.064462 & 0.4951 & 0.311168 \tabularnewline
16 & -0.166371 & -1.2779 & 0.103141 \tabularnewline
17 & 0.100758 & 0.7739 & 0.221028 \tabularnewline
18 & -0.099182 & -0.7618 & 0.224598 \tabularnewline
19 & -0.041973 & -0.3224 & 0.374146 \tabularnewline
20 & -0.1026 & -0.7881 & 0.216902 \tabularnewline
21 & 0.027853 & 0.2139 & 0.415664 \tabularnewline
22 & -0.08838 & -0.6789 & 0.249941 \tabularnewline
23 & -0.015054 & -0.1156 & 0.454167 \tabularnewline
24 & -0.062122 & -0.4772 & 0.317502 \tabularnewline
25 & 0.031049 & 0.2385 & 0.406164 \tabularnewline
26 & -0.055858 & -0.4291 & 0.334723 \tabularnewline
27 & -0.031553 & -0.2424 & 0.40467 \tabularnewline
28 & -0.061374 & -0.4714 & 0.319539 \tabularnewline
29 & -0.054623 & -0.4196 & 0.338164 \tabularnewline
30 & -0.01576 & -0.1211 & 0.452028 \tabularnewline
31 & -0.141296 & -1.0853 & 0.141098 \tabularnewline
32 & 0.04757 & 0.3654 & 0.358062 \tabularnewline
33 & -0.029298 & -0.225 & 0.411362 \tabularnewline
34 & -0.106356 & -0.8169 & 0.208626 \tabularnewline
35 & -0.017662 & -0.1357 & 0.446275 \tabularnewline
36 & 0.216856 & 1.6657 & 0.050537 \tabularnewline
37 & -0.068852 & -0.5289 & 0.299444 \tabularnewline
38 & -0.012731 & -0.0978 & 0.461215 \tabularnewline
39 & 0.033336 & 0.2561 & 0.399399 \tabularnewline
40 & -0.007594 & -0.0583 & 0.476842 \tabularnewline
41 & -0.015521 & -0.1192 & 0.452754 \tabularnewline
42 & 0.004346 & 0.0334 & 0.486742 \tabularnewline
43 & -0.035628 & -0.2737 & 0.39265 \tabularnewline
44 & -0.045759 & -0.3515 & 0.36324 \tabularnewline
45 & -0.016366 & -0.1257 & 0.450195 \tabularnewline
46 & -0.053835 & -0.4135 & 0.340363 \tabularnewline
47 & 0.056188 & 0.4316 & 0.333808 \tabularnewline
48 & 0.011692 & 0.0898 & 0.464372 \tabularnewline
49 & -0.031525 & -0.2421 & 0.404752 \tabularnewline
50 & 0.011051 & 0.0849 & 0.466319 \tabularnewline
51 & 0.021099 & 0.1621 & 0.435903 \tabularnewline
52 & -0.024075 & -0.1849 & 0.426961 \tabularnewline
53 & 0.038908 & 0.2989 & 0.383049 \tabularnewline
54 & -0.029735 & -0.2284 & 0.410062 \tabularnewline
55 & 0.020535 & 0.1577 & 0.437603 \tabularnewline
56 & -0.019359 & -0.1487 & 0.44115 \tabularnewline
57 & -0.002576 & -0.0198 & 0.492139 \tabularnewline
58 & 0.005882 & 0.0452 & 0.482058 \tabularnewline
59 & NA & NA & NA \tabularnewline
60 & NA & NA & NA \tabularnewline
\hline
\end{tabular}
%Source: https://freestatistics.org/blog/index.php?pk=30645&T=1

[TABLE]
[ROW][C]Autocorrelation Function[/C][/ROW]
[ROW][C]Time lag k[/C][C]ACF(k)[/C][C]T-STAT[/C][C]P-value[/C][/ROW]
[ROW][C]1[/C][C]-0.2137[/C][C]-1.6415[/C][C]0.053011[/C][/ROW]
[ROW][C]2[/C][C]0.090669[/C][C]0.6964[/C][C]0.244443[/C][/ROW]
[ROW][C]3[/C][C]0.132297[/C][C]1.0162[/C][C]0.156843[/C][/ROW]
[ROW][C]4[/C][C]0.154406[/C][C]1.186[/C][C]0.120186[/C][/ROW]
[ROW][C]5[/C][C]-0.106232[/C][C]-0.816[/C][C]0.208896[/C][/ROW]
[ROW][C]6[/C][C]0.171623[/C][C]1.3183[/C][C]0.096256[/C][/ROW]
[ROW][C]7[/C][C]-0.032878[/C][C]-0.2525[/C][C]0.400752[/C][/ROW]
[ROW][C]8[/C][C]-0.012469[/C][C]-0.0958[/C][C]0.462013[/C][/ROW]
[ROW][C]9[/C][C]-0.020103[/C][C]-0.1544[/C][C]0.438904[/C][/ROW]
[ROW][C]10[/C][C]-0.014236[/C][C]-0.1093[/C][C]0.456649[/C][/ROW]
[ROW][C]11[/C][C]0.135941[/C][C]1.0442[/C][C]0.15033[/C][/ROW]
[ROW][C]12[/C][C]0.022952[/C][C]0.1763[/C][C]0.430333[/C][/ROW]
[ROW][C]13[/C][C]-0.060196[/C][C]-0.4624[/C][C]0.322758[/C][/ROW]
[ROW][C]14[/C][C]0.013357[/C][C]0.1026[/C][C]0.459314[/C][/ROW]
[ROW][C]15[/C][C]0.064462[/C][C]0.4951[/C][C]0.311168[/C][/ROW]
[ROW][C]16[/C][C]-0.166371[/C][C]-1.2779[/C][C]0.103141[/C][/ROW]
[ROW][C]17[/C][C]0.100758[/C][C]0.7739[/C][C]0.221028[/C][/ROW]
[ROW][C]18[/C][C]-0.099182[/C][C]-0.7618[/C][C]0.224598[/C][/ROW]
[ROW][C]19[/C][C]-0.041973[/C][C]-0.3224[/C][C]0.374146[/C][/ROW]
[ROW][C]20[/C][C]-0.1026[/C][C]-0.7881[/C][C]0.216902[/C][/ROW]
[ROW][C]21[/C][C]0.027853[/C][C]0.2139[/C][C]0.415664[/C][/ROW]
[ROW][C]22[/C][C]-0.08838[/C][C]-0.6789[/C][C]0.249941[/C][/ROW]
[ROW][C]23[/C][C]-0.015054[/C][C]-0.1156[/C][C]0.454167[/C][/ROW]
[ROW][C]24[/C][C]-0.062122[/C][C]-0.4772[/C][C]0.317502[/C][/ROW]
[ROW][C]25[/C][C]0.031049[/C][C]0.2385[/C][C]0.406164[/C][/ROW]
[ROW][C]26[/C][C]-0.055858[/C][C]-0.4291[/C][C]0.334723[/C][/ROW]
[ROW][C]27[/C][C]-0.031553[/C][C]-0.2424[/C][C]0.40467[/C][/ROW]
[ROW][C]28[/C][C]-0.061374[/C][C]-0.4714[/C][C]0.319539[/C][/ROW]
[ROW][C]29[/C][C]-0.054623[/C][C]-0.4196[/C][C]0.338164[/C][/ROW]
[ROW][C]30[/C][C]-0.01576[/C][C]-0.1211[/C][C]0.452028[/C][/ROW]
[ROW][C]31[/C][C]-0.141296[/C][C]-1.0853[/C][C]0.141098[/C][/ROW]
[ROW][C]32[/C][C]0.04757[/C][C]0.3654[/C][C]0.358062[/C][/ROW]
[ROW][C]33[/C][C]-0.029298[/C][C]-0.225[/C][C]0.411362[/C][/ROW]
[ROW][C]34[/C][C]-0.106356[/C][C]-0.8169[/C][C]0.208626[/C][/ROW]
[ROW][C]35[/C][C]-0.017662[/C][C]-0.1357[/C][C]0.446275[/C][/ROW]
[ROW][C]36[/C][C]0.216856[/C][C]1.6657[/C][C]0.050537[/C][/ROW]
[ROW][C]37[/C][C]-0.068852[/C][C]-0.5289[/C][C]0.299444[/C][/ROW]
[ROW][C]38[/C][C]-0.012731[/C][C]-0.0978[/C][C]0.461215[/C][/ROW]
[ROW][C]39[/C][C]0.033336[/C][C]0.2561[/C][C]0.399399[/C][/ROW]
[ROW][C]40[/C][C]-0.007594[/C][C]-0.0583[/C][C]0.476842[/C][/ROW]
[ROW][C]41[/C][C]-0.015521[/C][C]-0.1192[/C][C]0.452754[/C][/ROW]
[ROW][C]42[/C][C]0.004346[/C][C]0.0334[/C][C]0.486742[/C][/ROW]
[ROW][C]43[/C][C]-0.035628[/C][C]-0.2737[/C][C]0.39265[/C][/ROW]
[ROW][C]44[/C][C]-0.045759[/C][C]-0.3515[/C][C]0.36324[/C][/ROW]
[ROW][C]45[/C][C]-0.016366[/C][C]-0.1257[/C][C]0.450195[/C][/ROW]
[ROW][C]46[/C][C]-0.053835[/C][C]-0.4135[/C][C]0.340363[/C][/ROW]
[ROW][C]47[/C][C]0.056188[/C][C]0.4316[/C][C]0.333808[/C][/ROW]
[ROW][C]48[/C][C]0.011692[/C][C]0.0898[/C][C]0.464372[/C][/ROW]
[ROW][C]49[/C][C]-0.031525[/C][C]-0.2421[/C][C]0.404752[/C][/ROW]
[ROW][C]50[/C][C]0.011051[/C][C]0.0849[/C][C]0.466319[/C][/ROW]
[ROW][C]51[/C][C]0.021099[/C][C]0.1621[/C][C]0.435903[/C][/ROW]
[ROW][C]52[/C][C]-0.024075[/C][C]-0.1849[/C][C]0.426961[/C][/ROW]
[ROW][C]53[/C][C]0.038908[/C][C]0.2989[/C][C]0.383049[/C][/ROW]
[ROW][C]54[/C][C]-0.029735[/C][C]-0.2284[/C][C]0.410062[/C][/ROW]
[ROW][C]55[/C][C]0.020535[/C][C]0.1577[/C][C]0.437603[/C][/ROW]
[ROW][C]56[/C][C]-0.019359[/C][C]-0.1487[/C][C]0.44115[/C][/ROW]
[ROW][C]57[/C][C]-0.002576[/C][C]-0.0198[/C][C]0.492139[/C][/ROW]
[ROW][C]58[/C][C]0.005882[/C][C]0.0452[/C][C]0.482058[/C][/ROW]
[ROW][C]59[/C][C]NA[/C][C]NA[/C][C]NA[/C][/ROW]
[ROW][C]60[/C][C]NA[/C][C]NA[/C][C]NA[/C][/ROW]
[/TABLE]
Source: https://freestatistics.org/blog/index.php?pk=30645&T=1

Globally Unique Identifier (entire table): ba.freestatistics.org/blog/index.php?pk=30645&T=1

As an alternative you can also use a QR Code:  

The GUIDs for individual cells are displayed in the table below:

Autocorrelation Function
Time lag kACF(k)T-STATP-value
1-0.2137-1.64150.053011
20.0906690.69640.244443
30.1322971.01620.156843
40.1544061.1860.120186
5-0.106232-0.8160.208896
60.1716231.31830.096256
7-0.032878-0.25250.400752
8-0.012469-0.09580.462013
9-0.020103-0.15440.438904
10-0.014236-0.10930.456649
110.1359411.04420.15033
120.0229520.17630.430333
13-0.060196-0.46240.322758
140.0133570.10260.459314
150.0644620.49510.311168
16-0.166371-1.27790.103141
170.1007580.77390.221028
18-0.099182-0.76180.224598
19-0.041973-0.32240.374146
20-0.1026-0.78810.216902
210.0278530.21390.415664
22-0.08838-0.67890.249941
23-0.015054-0.11560.454167
24-0.062122-0.47720.317502
250.0310490.23850.406164
26-0.055858-0.42910.334723
27-0.031553-0.24240.40467
28-0.061374-0.47140.319539
29-0.054623-0.41960.338164
30-0.01576-0.12110.452028
31-0.141296-1.08530.141098
320.047570.36540.358062
33-0.029298-0.2250.411362
34-0.106356-0.81690.208626
35-0.017662-0.13570.446275
360.2168561.66570.050537
37-0.068852-0.52890.299444
38-0.012731-0.09780.461215
390.0333360.25610.399399
40-0.007594-0.05830.476842
41-0.015521-0.11920.452754
420.0043460.03340.486742
43-0.035628-0.27370.39265
44-0.045759-0.35150.36324
45-0.016366-0.12570.450195
46-0.053835-0.41350.340363
470.0561880.43160.333808
480.0116920.08980.464372
49-0.031525-0.24210.404752
500.0110510.08490.466319
510.0210990.16210.435903
52-0.024075-0.18490.426961
530.0389080.29890.383049
54-0.029735-0.22840.410062
550.0205350.15770.437603
56-0.019359-0.14870.44115
57-0.002576-0.01980.492139
580.0058820.04520.482058
59NANANA
60NANANA


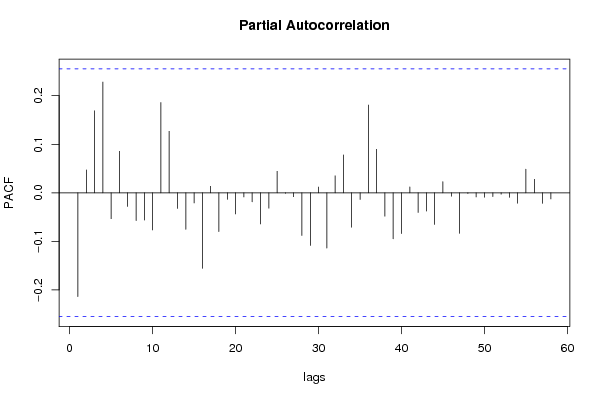
Partial Autocorrelation Function
Time lag kPACF(k)T-STATP-value
1-0.2137-1.64150.053011
20.0471550.36220.359247
30.1689091.29740.09977
40.2282061.75290.042408
5-0.053442-0.41050.341466
60.0854990.65670.256955
7-0.028007-0.21510.415206
8-0.057111-0.43870.331249
9-0.056219-0.43180.333722
10-0.076413-0.58690.279743
110.1859791.42850.079206
120.1265970.97240.167408
13-0.032279-0.24790.40252
14-0.075219-0.57780.28281
15-0.021006-0.16140.436183
16-0.155589-1.19510.118414
170.0134060.1030.459167
18-0.07985-0.61330.271004
19-0.013302-0.10220.459483
20-0.043625-0.33510.369371
21-0.008591-0.0660.473806
22-0.018508-0.14220.443718
23-0.064226-0.49330.311804
24-0.031803-0.24430.40393
250.0443280.34050.367348
26-0.001097-0.00840.496654
27-0.008014-0.06160.475563
28-0.087812-0.67450.251315
29-0.108468-0.83320.204057
300.0119080.09150.463717
31-0.113806-0.87420.192788
320.0348980.26810.394794
330.0780180.59930.275645
34-0.070776-0.54360.29437
35-0.013576-0.10430.458651
360.1807951.38870.08507
370.0895430.68780.24714
38-0.048139-0.36980.356442
39-0.09479-0.72810.234718
40-0.083886-0.64430.260925
410.0119840.09210.463484
42-0.04034-0.30990.378881
43-0.037587-0.28870.386906
44-0.065172-0.50060.309259
450.0228750.17570.430564
46-0.007113-0.05460.478305
47-0.083421-0.64080.262078
48-0.001355-0.01040.495866
49-0.008652-0.06650.473621
50-0.009054-0.06950.472394
51-0.007634-0.05860.476719
52-0.002816-0.02160.491409
53-0.009315-0.07150.471601
54-0.021289-0.16350.435332
550.0485370.37280.355308
560.0279060.21440.415505
57-0.02173-0.16690.434004
58-0.012641-0.09710.461489
59NANANA
60NANANA

\begin{tabular}{lllllllll}
\hline
Partial Autocorrelation Function \tabularnewline
Time lag k & PACF(k) & T-STAT & P-value \tabularnewline
1 & -0.2137 & -1.6415 & 0.053011 \tabularnewline
2 & 0.047155 & 0.3622 & 0.359247 \tabularnewline
3 & 0.168909 & 1.2974 & 0.09977 \tabularnewline
4 & 0.228206 & 1.7529 & 0.042408 \tabularnewline
5 & -0.053442 & -0.4105 & 0.341466 \tabularnewline
6 & 0.085499 & 0.6567 & 0.256955 \tabularnewline
7 & -0.028007 & -0.2151 & 0.415206 \tabularnewline
8 & -0.057111 & -0.4387 & 0.331249 \tabularnewline
9 & -0.056219 & -0.4318 & 0.333722 \tabularnewline
10 & -0.076413 & -0.5869 & 0.279743 \tabularnewline
11 & 0.185979 & 1.4285 & 0.079206 \tabularnewline
12 & 0.126597 & 0.9724 & 0.167408 \tabularnewline
13 & -0.032279 & -0.2479 & 0.40252 \tabularnewline
14 & -0.075219 & -0.5778 & 0.28281 \tabularnewline
15 & -0.021006 & -0.1614 & 0.436183 \tabularnewline
16 & -0.155589 & -1.1951 & 0.118414 \tabularnewline
17 & 0.013406 & 0.103 & 0.459167 \tabularnewline
18 & -0.07985 & -0.6133 & 0.271004 \tabularnewline
19 & -0.013302 & -0.1022 & 0.459483 \tabularnewline
20 & -0.043625 & -0.3351 & 0.369371 \tabularnewline
21 & -0.008591 & -0.066 & 0.473806 \tabularnewline
22 & -0.018508 & -0.1422 & 0.443718 \tabularnewline
23 & -0.064226 & -0.4933 & 0.311804 \tabularnewline
24 & -0.031803 & -0.2443 & 0.40393 \tabularnewline
25 & 0.044328 & 0.3405 & 0.367348 \tabularnewline
26 & -0.001097 & -0.0084 & 0.496654 \tabularnewline
27 & -0.008014 & -0.0616 & 0.475563 \tabularnewline
28 & -0.087812 & -0.6745 & 0.251315 \tabularnewline
29 & -0.108468 & -0.8332 & 0.204057 \tabularnewline
30 & 0.011908 & 0.0915 & 0.463717 \tabularnewline
31 & -0.113806 & -0.8742 & 0.192788 \tabularnewline
32 & 0.034898 & 0.2681 & 0.394794 \tabularnewline
33 & 0.078018 & 0.5993 & 0.275645 \tabularnewline
34 & -0.070776 & -0.5436 & 0.29437 \tabularnewline
35 & -0.013576 & -0.1043 & 0.458651 \tabularnewline
36 & 0.180795 & 1.3887 & 0.08507 \tabularnewline
37 & 0.089543 & 0.6878 & 0.24714 \tabularnewline
38 & -0.048139 & -0.3698 & 0.356442 \tabularnewline
39 & -0.09479 & -0.7281 & 0.234718 \tabularnewline
40 & -0.083886 & -0.6443 & 0.260925 \tabularnewline
41 & 0.011984 & 0.0921 & 0.463484 \tabularnewline
42 & -0.04034 & -0.3099 & 0.378881 \tabularnewline
43 & -0.037587 & -0.2887 & 0.386906 \tabularnewline
44 & -0.065172 & -0.5006 & 0.309259 \tabularnewline
45 & 0.022875 & 0.1757 & 0.430564 \tabularnewline
46 & -0.007113 & -0.0546 & 0.478305 \tabularnewline
47 & -0.083421 & -0.6408 & 0.262078 \tabularnewline
48 & -0.001355 & -0.0104 & 0.495866 \tabularnewline
49 & -0.008652 & -0.0665 & 0.473621 \tabularnewline
50 & -0.009054 & -0.0695 & 0.472394 \tabularnewline
51 & -0.007634 & -0.0586 & 0.476719 \tabularnewline
52 & -0.002816 & -0.0216 & 0.491409 \tabularnewline
53 & -0.009315 & -0.0715 & 0.471601 \tabularnewline
54 & -0.021289 & -0.1635 & 0.435332 \tabularnewline
55 & 0.048537 & 0.3728 & 0.355308 \tabularnewline
56 & 0.027906 & 0.2144 & 0.415505 \tabularnewline
57 & -0.02173 & -0.1669 & 0.434004 \tabularnewline
58 & -0.012641 & -0.0971 & 0.461489 \tabularnewline
59 & NA & NA & NA \tabularnewline
60 & NA & NA & NA \tabularnewline
\hline
\end{tabular}
%Source: https://freestatistics.org/blog/index.php?pk=30645&T=2

[TABLE]
[ROW][C]Partial Autocorrelation Function[/C][/ROW]
[ROW][C]Time lag k[/C][C]PACF(k)[/C][C]T-STAT[/C][C]P-value[/C][/ROW]
[ROW][C]1[/C][C]-0.2137[/C][C]-1.6415[/C][C]0.053011[/C][/ROW]
[ROW][C]2[/C][C]0.047155[/C][C]0.3622[/C][C]0.359247[/C][/ROW]
[ROW][C]3[/C][C]0.168909[/C][C]1.2974[/C][C]0.09977[/C][/ROW]
[ROW][C]4[/C][C]0.228206[/C][C]1.7529[/C][C]0.042408[/C][/ROW]
[ROW][C]5[/C][C]-0.053442[/C][C]-0.4105[/C][C]0.341466[/C][/ROW]
[ROW][C]6[/C][C]0.085499[/C][C]0.6567[/C][C]0.256955[/C][/ROW]
[ROW][C]7[/C][C]-0.028007[/C][C]-0.2151[/C][C]0.415206[/C][/ROW]
[ROW][C]8[/C][C]-0.057111[/C][C]-0.4387[/C][C]0.331249[/C][/ROW]
[ROW][C]9[/C][C]-0.056219[/C][C]-0.4318[/C][C]0.333722[/C][/ROW]
[ROW][C]10[/C][C]-0.076413[/C][C]-0.5869[/C][C]0.279743[/C][/ROW]
[ROW][C]11[/C][C]0.185979[/C][C]1.4285[/C][C]0.079206[/C][/ROW]
[ROW][C]12[/C][C]0.126597[/C][C]0.9724[/C][C]0.167408[/C][/ROW]
[ROW][C]13[/C][C]-0.032279[/C][C]-0.2479[/C][C]0.40252[/C][/ROW]
[ROW][C]14[/C][C]-0.075219[/C][C]-0.5778[/C][C]0.28281[/C][/ROW]
[ROW][C]15[/C][C]-0.021006[/C][C]-0.1614[/C][C]0.436183[/C][/ROW]
[ROW][C]16[/C][C]-0.155589[/C][C]-1.1951[/C][C]0.118414[/C][/ROW]
[ROW][C]17[/C][C]0.013406[/C][C]0.103[/C][C]0.459167[/C][/ROW]
[ROW][C]18[/C][C]-0.07985[/C][C]-0.6133[/C][C]0.271004[/C][/ROW]
[ROW][C]19[/C][C]-0.013302[/C][C]-0.1022[/C][C]0.459483[/C][/ROW]
[ROW][C]20[/C][C]-0.043625[/C][C]-0.3351[/C][C]0.369371[/C][/ROW]
[ROW][C]21[/C][C]-0.008591[/C][C]-0.066[/C][C]0.473806[/C][/ROW]
[ROW][C]22[/C][C]-0.018508[/C][C]-0.1422[/C][C]0.443718[/C][/ROW]
[ROW][C]23[/C][C]-0.064226[/C][C]-0.4933[/C][C]0.311804[/C][/ROW]
[ROW][C]24[/C][C]-0.031803[/C][C]-0.2443[/C][C]0.40393[/C][/ROW]
[ROW][C]25[/C][C]0.044328[/C][C]0.3405[/C][C]0.367348[/C][/ROW]
[ROW][C]26[/C][C]-0.001097[/C][C]-0.0084[/C][C]0.496654[/C][/ROW]
[ROW][C]27[/C][C]-0.008014[/C][C]-0.0616[/C][C]0.475563[/C][/ROW]
[ROW][C]28[/C][C]-0.087812[/C][C]-0.6745[/C][C]0.251315[/C][/ROW]
[ROW][C]29[/C][C]-0.108468[/C][C]-0.8332[/C][C]0.204057[/C][/ROW]
[ROW][C]30[/C][C]0.011908[/C][C]0.0915[/C][C]0.463717[/C][/ROW]
[ROW][C]31[/C][C]-0.113806[/C][C]-0.8742[/C][C]0.192788[/C][/ROW]
[ROW][C]32[/C][C]0.034898[/C][C]0.2681[/C][C]0.394794[/C][/ROW]
[ROW][C]33[/C][C]0.078018[/C][C]0.5993[/C][C]0.275645[/C][/ROW]
[ROW][C]34[/C][C]-0.070776[/C][C]-0.5436[/C][C]0.29437[/C][/ROW]
[ROW][C]35[/C][C]-0.013576[/C][C]-0.1043[/C][C]0.458651[/C][/ROW]
[ROW][C]36[/C][C]0.180795[/C][C]1.3887[/C][C]0.08507[/C][/ROW]
[ROW][C]37[/C][C]0.089543[/C][C]0.6878[/C][C]0.24714[/C][/ROW]
[ROW][C]38[/C][C]-0.048139[/C][C]-0.3698[/C][C]0.356442[/C][/ROW]
[ROW][C]39[/C][C]-0.09479[/C][C]-0.7281[/C][C]0.234718[/C][/ROW]
[ROW][C]40[/C][C]-0.083886[/C][C]-0.6443[/C][C]0.260925[/C][/ROW]
[ROW][C]41[/C][C]0.011984[/C][C]0.0921[/C][C]0.463484[/C][/ROW]
[ROW][C]42[/C][C]-0.04034[/C][C]-0.3099[/C][C]0.378881[/C][/ROW]
[ROW][C]43[/C][C]-0.037587[/C][C]-0.2887[/C][C]0.386906[/C][/ROW]
[ROW][C]44[/C][C]-0.065172[/C][C]-0.5006[/C][C]0.309259[/C][/ROW]
[ROW][C]45[/C][C]0.022875[/C][C]0.1757[/C][C]0.430564[/C][/ROW]
[ROW][C]46[/C][C]-0.007113[/C][C]-0.0546[/C][C]0.478305[/C][/ROW]
[ROW][C]47[/C][C]-0.083421[/C][C]-0.6408[/C][C]0.262078[/C][/ROW]
[ROW][C]48[/C][C]-0.001355[/C][C]-0.0104[/C][C]0.495866[/C][/ROW]
[ROW][C]49[/C][C]-0.008652[/C][C]-0.0665[/C][C]0.473621[/C][/ROW]
[ROW][C]50[/C][C]-0.009054[/C][C]-0.0695[/C][C]0.472394[/C][/ROW]
[ROW][C]51[/C][C]-0.007634[/C][C]-0.0586[/C][C]0.476719[/C][/ROW]
[ROW][C]52[/C][C]-0.002816[/C][C]-0.0216[/C][C]0.491409[/C][/ROW]
[ROW][C]53[/C][C]-0.009315[/C][C]-0.0715[/C][C]0.471601[/C][/ROW]
[ROW][C]54[/C][C]-0.021289[/C][C]-0.1635[/C][C]0.435332[/C][/ROW]
[ROW][C]55[/C][C]0.048537[/C][C]0.3728[/C][C]0.355308[/C][/ROW]
[ROW][C]56[/C][C]0.027906[/C][C]0.2144[/C][C]0.415505[/C][/ROW]
[ROW][C]57[/C][C]-0.02173[/C][C]-0.1669[/C][C]0.434004[/C][/ROW]
[ROW][C]58[/C][C]-0.012641[/C][C]-0.0971[/C][C]0.461489[/C][/ROW]
[ROW][C]59[/C][C]NA[/C][C]NA[/C][C]NA[/C][/ROW]
[ROW][C]60[/C][C]NA[/C][C]NA[/C][C]NA[/C][/ROW]
[/TABLE]
Source: https://freestatistics.org/blog/index.php?pk=30645&T=2

Globally Unique Identifier (entire table): ba.freestatistics.org/blog/index.php?pk=30645&T=2

As an alternative you can also use a QR Code:  

The GUIDs for individual cells are displayed in the table below:

Partial Autocorrelation Function
Time lag kPACF(k)T-STATP-value
1-0.2137-1.64150.053011
20.0471550.36220.359247
30.1689091.29740.09977
40.2282061.75290.042408
5-0.053442-0.41050.341466
60.0854990.65670.256955
7-0.028007-0.21510.415206
8-0.057111-0.43870.331249
9-0.056219-0.43180.333722
10-0.076413-0.58690.279743
110.1859791.42850.079206
120.1265970.97240.167408
13-0.032279-0.24790.40252
14-0.075219-0.57780.28281
15-0.021006-0.16140.436183
16-0.155589-1.19510.118414
170.0134060.1030.459167
18-0.07985-0.61330.271004
19-0.013302-0.10220.459483
20-0.043625-0.33510.369371
21-0.008591-0.0660.473806
22-0.018508-0.14220.443718
23-0.064226-0.49330.311804
24-0.031803-0.24430.40393
250.0443280.34050.367348
26-0.001097-0.00840.496654
27-0.008014-0.06160.475563
28-0.087812-0.67450.251315
29-0.108468-0.83320.204057
300.0119080.09150.463717
31-0.113806-0.87420.192788
320.0348980.26810.394794
330.0780180.59930.275645
34-0.070776-0.54360.29437
35-0.013576-0.10430.458651
360.1807951.38870.08507
370.0895430.68780.24714
38-0.048139-0.36980.356442
39-0.09479-0.72810.234718
40-0.083886-0.64430.260925
410.0119840.09210.463484
42-0.04034-0.30990.378881
43-0.037587-0.28870.386906
44-0.065172-0.50060.309259
450.0228750.17570.430564
46-0.007113-0.05460.478305
47-0.083421-0.64080.262078
48-0.001355-0.01040.495866
49-0.008652-0.06650.473621
50-0.009054-0.06950.472394
51-0.007634-0.05860.476719
52-0.002816-0.02160.491409
53-0.009315-0.07150.471601
54-0.021289-0.16350.435332
550.0485370.37280.355308
560.0279060.21440.415505
57-0.02173-0.16690.434004
58-0.012641-0.09710.461489
59NANANA
60NANANA


Parameters (Session):
par1 = 60 ; par2 = 1 ; par3 = 1 ; par4 = 0 ; par5 = 12 ;
Parameters (R input):
par1 = 60 ; par2 = 1 ; par3 = 1 ; par4 = 0 ; par5 = 12 ;
R code (references can be found in the software module):
if (par1 == 'Default') {
par1 = 10*log10(length(x))
} else {
par1 <- as.numeric(par1)
}
par2 <- as.numeric(par2)
par3 <- as.numeric(par3)
par4 <- as.numeric(par4)
par5 <- as.numeric(par5)
if (par2 == 0) {
x <- log(x)
} else {
x <- (x ^ par2 - 1) / par2
}
if (par3 > 0) x <- diff(x,lag=1,difference=par3)
if (par4 > 0) x <- diff(x,lag=par5,difference=par4)
bitmap(file='pic1.png')
racf <- acf(x,par1,main='Autocorrelation',xlab='lags',ylab='ACF')
dev.off()
bitmap(file='pic2.png')
rpacf <- pacf(x,par1,main='Partial Autocorrelation',xlab='lags',ylab='PACF')
dev.off()
(myacf <- c(racf$acf))
(mypacf <- c(rpacf$acf))
lengthx <- length(x)
sqrtn <- sqrt(lengthx)
load(file='createtable')
a<-table.start()
a<-table.row.start(a)
a<-table.element(a,'Autocorrelation Function',4,TRUE)
a<-table.row.end(a)
a<-table.row.start(a)
a<-table.element(a,'Time lag k',header=TRUE)
a<-table.element(a,hyperlink('basics.htm','ACF(k)','click here for more information about the Autocorrelation Function'),header=TRUE)
a<-table.element(a,'T-STAT',header=TRUE)
a<-table.element(a,'P-value',header=TRUE)
a<-table.row.end(a)
for (i in 2:(par1+1)) {
a<-table.row.start(a)
a<-table.element(a,i-1,header=TRUE)
a<-table.element(a,round(myacf[i],6))
mytstat <- myacf[i]*sqrtn
a<-table.element(a,round(mytstat,4))
a<-table.element(a,round(1-pt(abs(mytstat),lengthx),6))
a<-table.row.end(a)
}
a<-table.end(a)
table.save(a,file='mytable.tab')
a<-table.start()
a<-table.row.start(a)
a<-table.element(a,'Partial Autocorrelation Function',4,TRUE)
a<-table.row.end(a)
a<-table.row.start(a)
a<-table.element(a,'Time lag k',header=TRUE)
a<-table.element(a,hyperlink('basics.htm','PACF(k)','click here for more information about the Partial Autocorrelation Function'),header=TRUE)
a<-table.element(a,'T-STAT',header=TRUE)
a<-table.element(a,'P-value',header=TRUE)
a<-table.row.end(a)
for (i in 1:par1) {
a<-table.row.start(a)
a<-table.element(a,i,header=TRUE)
a<-table.element(a,round(mypacf[i],6))
mytstat <- mypacf[i]*sqrtn
a<-table.element(a,round(mytstat,4))
a<-table.element(a,round(1-pt(abs(mytstat),lengthx),6))
a<-table.row.end(a)
}
a<-table.end(a)
table.save(a,file='mytable1.tab')