Free Statistics

of Irreproducible Research!

Author's title

Author*The author of this computation has been verified*
R Software Modulerwasp_autocorrelation.wasp
Title produced by software(Partial) Autocorrelation Function
Date of computationMon, 08 Dec 2008 11:09:31 -0700
Cite this page as followsStatistical Computations at FreeStatistics.org, Office for Research Development and Education, URL https://freestatistics.org/blog/index.php?v=date/2008/Dec/08/t122875982742c57vqzu7s2pwj.htm/, Retrieved Thu, 16 May 2024 16:56:20 +0000
Statistical Computations at FreeStatistics.org, Office for Research Development and Education, URL https://freestatistics.org/blog/index.php?pk=30638, Retrieved Thu, 16 May 2024 16:56:20 +0000
QR Codes:

Original text written by user:d=1
IsPrivate?No (this computation is public)
User-defined keywords
Estimated Impact180
Family? (F = Feedback message, R = changed R code, M = changed R Module, P = changed Parameters, D = changed Data)
-     [Univariate Data Series] [data set] [2008-12-01 19:54:57] [b98453cac15ba1066b407e146608df68]
- RMP   [ARIMA Backward Selection] [ARIMA Backward Se...] [2008-12-08 10:48:08] [58bf45a666dc5198906262e8815a9722]
- RMPD    [Variance Reduction Matrix] [Variance Reductio...] [2008-12-08 11:24:27] [58bf45a666dc5198906262e8815a9722]
- RMP         [(Partial) Autocorrelation Function] [(Partial) Autocor...] [2008-12-08 18:09:31] [63db34dadd44fb018112addcdefe949f] [Current]
Feedback Forum

Post a new message
Dataseries X:
101
104
99
105
107
111
117
119
127
128
135
132
136
143
142
153
145
138
148
152
169
169
161
174
179
191
190
182
175
181
197
194
197
216
221
218
230
227
204
197
199
208
191
202
211
224
224
231
244
235
250
266
288
283
295
312
334
348
383
407


Summary of computational transaction
Raw Inputview raw input (R code)
Raw Outputview raw output of R engine
Computing time2 seconds
R Server'Herman Ole Andreas Wold' @ 193.190.124.10:1001

\begin{tabular}{lllllllll}
\hline
Summary of computational transaction \tabularnewline
Raw Input & view raw input (R code)  \tabularnewline
Raw Output & view raw output of R engine  \tabularnewline
Computing time & 2 seconds \tabularnewline
R Server & 'Herman Ole Andreas Wold' @ 193.190.124.10:1001 \tabularnewline
\hline
\end{tabular}
%Source: https://freestatistics.org/blog/index.php?pk=30638&T=0

[TABLE]
[ROW][C]Summary of computational transaction[/C][/ROW]
[ROW][C]Raw Input[/C][C]view raw input (R code) [/C][/ROW]
[ROW][C]Raw Output[/C][C]view raw output of R engine [/C][/ROW]
[ROW][C]Computing time[/C][C]2 seconds[/C][/ROW]
[ROW][C]R Server[/C][C]'Herman Ole Andreas Wold' @ 193.190.124.10:1001[/C][/ROW]
[/TABLE]
Source: https://freestatistics.org/blog/index.php?pk=30638&T=0

Globally Unique Identifier (entire table): ba.freestatistics.org/blog/index.php?pk=30638&T=0

As an alternative you can also use a QR Code:  

The GUIDs for individual cells are displayed in the table below:

Summary of computational transaction
Raw Inputview raw input (R code)
Raw Outputview raw output of R engine
Computing time2 seconds
R Server'Herman Ole Andreas Wold' @ 193.190.124.10:1001


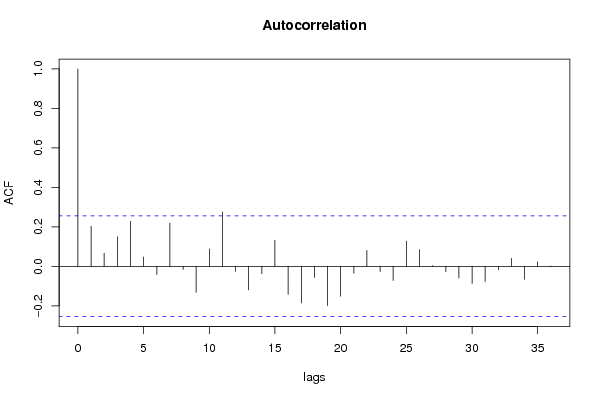
Autocorrelation Function
Time lag kACF(k)T-STATP-value
10.2030131.55940.062128
20.0663020.50930.306229
30.1501541.15340.126708
40.2277461.74930.042715
50.0469150.36040.359933
6-0.041835-0.32130.374544
70.2191371.68320.048808
8-0.016123-0.12380.450929
9-0.132012-1.0140.157361
100.0877640.67410.251431
110.2757522.11810.019195
12-0.025595-0.19660.42241
13-0.119725-0.91960.180756
14-0.037614-0.28890.386828
150.1323081.01630.156823
16-0.141926-1.09020.140038
17-0.185644-1.4260.079575
18-0.056351-0.43280.333356
19-0.198989-1.52850.065871
20-0.151525-1.16390.124578
21-0.035466-0.27240.393124
220.0803570.61720.269728
23-0.026172-0.2010.420684
24-0.071736-0.5510.291853
250.1270820.97610.166491
260.0843210.64770.259851
270.0030180.02320.490792
28-0.027064-0.20790.418017
29-0.059012-0.45330.326006
30-0.086588-0.66510.254289
31-0.076756-0.58960.278864
32-0.017378-0.13350.447133
330.0402130.30890.379249
34-0.065856-0.50580.307424
350.0218150.16760.43375
360.0020840.0160.49364

\begin{tabular}{lllllllll}
\hline
Autocorrelation Function \tabularnewline
Time lag k & ACF(k) & T-STAT & P-value \tabularnewline
1 & 0.203013 & 1.5594 & 0.062128 \tabularnewline
2 & 0.066302 & 0.5093 & 0.306229 \tabularnewline
3 & 0.150154 & 1.1534 & 0.126708 \tabularnewline
4 & 0.227746 & 1.7493 & 0.042715 \tabularnewline
5 & 0.046915 & 0.3604 & 0.359933 \tabularnewline
6 & -0.041835 & -0.3213 & 0.374544 \tabularnewline
7 & 0.219137 & 1.6832 & 0.048808 \tabularnewline
8 & -0.016123 & -0.1238 & 0.450929 \tabularnewline
9 & -0.132012 & -1.014 & 0.157361 \tabularnewline
10 & 0.087764 & 0.6741 & 0.251431 \tabularnewline
11 & 0.275752 & 2.1181 & 0.019195 \tabularnewline
12 & -0.025595 & -0.1966 & 0.42241 \tabularnewline
13 & -0.119725 & -0.9196 & 0.180756 \tabularnewline
14 & -0.037614 & -0.2889 & 0.386828 \tabularnewline
15 & 0.132308 & 1.0163 & 0.156823 \tabularnewline
16 & -0.141926 & -1.0902 & 0.140038 \tabularnewline
17 & -0.185644 & -1.426 & 0.079575 \tabularnewline
18 & -0.056351 & -0.4328 & 0.333356 \tabularnewline
19 & -0.198989 & -1.5285 & 0.065871 \tabularnewline
20 & -0.151525 & -1.1639 & 0.124578 \tabularnewline
21 & -0.035466 & -0.2724 & 0.393124 \tabularnewline
22 & 0.080357 & 0.6172 & 0.269728 \tabularnewline
23 & -0.026172 & -0.201 & 0.420684 \tabularnewline
24 & -0.071736 & -0.551 & 0.291853 \tabularnewline
25 & 0.127082 & 0.9761 & 0.166491 \tabularnewline
26 & 0.084321 & 0.6477 & 0.259851 \tabularnewline
27 & 0.003018 & 0.0232 & 0.490792 \tabularnewline
28 & -0.027064 & -0.2079 & 0.418017 \tabularnewline
29 & -0.059012 & -0.4533 & 0.326006 \tabularnewline
30 & -0.086588 & -0.6651 & 0.254289 \tabularnewline
31 & -0.076756 & -0.5896 & 0.278864 \tabularnewline
32 & -0.017378 & -0.1335 & 0.447133 \tabularnewline
33 & 0.040213 & 0.3089 & 0.379249 \tabularnewline
34 & -0.065856 & -0.5058 & 0.307424 \tabularnewline
35 & 0.021815 & 0.1676 & 0.43375 \tabularnewline
36 & 0.002084 & 0.016 & 0.49364 \tabularnewline
\hline
\end{tabular}
%Source: https://freestatistics.org/blog/index.php?pk=30638&T=1

[TABLE]
[ROW][C]Autocorrelation Function[/C][/ROW]
[ROW][C]Time lag k[/C][C]ACF(k)[/C][C]T-STAT[/C][C]P-value[/C][/ROW]
[ROW][C]1[/C][C]0.203013[/C][C]1.5594[/C][C]0.062128[/C][/ROW]
[ROW][C]2[/C][C]0.066302[/C][C]0.5093[/C][C]0.306229[/C][/ROW]
[ROW][C]3[/C][C]0.150154[/C][C]1.1534[/C][C]0.126708[/C][/ROW]
[ROW][C]4[/C][C]0.227746[/C][C]1.7493[/C][C]0.042715[/C][/ROW]
[ROW][C]5[/C][C]0.046915[/C][C]0.3604[/C][C]0.359933[/C][/ROW]
[ROW][C]6[/C][C]-0.041835[/C][C]-0.3213[/C][C]0.374544[/C][/ROW]
[ROW][C]7[/C][C]0.219137[/C][C]1.6832[/C][C]0.048808[/C][/ROW]
[ROW][C]8[/C][C]-0.016123[/C][C]-0.1238[/C][C]0.450929[/C][/ROW]
[ROW][C]9[/C][C]-0.132012[/C][C]-1.014[/C][C]0.157361[/C][/ROW]
[ROW][C]10[/C][C]0.087764[/C][C]0.6741[/C][C]0.251431[/C][/ROW]
[ROW][C]11[/C][C]0.275752[/C][C]2.1181[/C][C]0.019195[/C][/ROW]
[ROW][C]12[/C][C]-0.025595[/C][C]-0.1966[/C][C]0.42241[/C][/ROW]
[ROW][C]13[/C][C]-0.119725[/C][C]-0.9196[/C][C]0.180756[/C][/ROW]
[ROW][C]14[/C][C]-0.037614[/C][C]-0.2889[/C][C]0.386828[/C][/ROW]
[ROW][C]15[/C][C]0.132308[/C][C]1.0163[/C][C]0.156823[/C][/ROW]
[ROW][C]16[/C][C]-0.141926[/C][C]-1.0902[/C][C]0.140038[/C][/ROW]
[ROW][C]17[/C][C]-0.185644[/C][C]-1.426[/C][C]0.079575[/C][/ROW]
[ROW][C]18[/C][C]-0.056351[/C][C]-0.4328[/C][C]0.333356[/C][/ROW]
[ROW][C]19[/C][C]-0.198989[/C][C]-1.5285[/C][C]0.065871[/C][/ROW]
[ROW][C]20[/C][C]-0.151525[/C][C]-1.1639[/C][C]0.124578[/C][/ROW]
[ROW][C]21[/C][C]-0.035466[/C][C]-0.2724[/C][C]0.393124[/C][/ROW]
[ROW][C]22[/C][C]0.080357[/C][C]0.6172[/C][C]0.269728[/C][/ROW]
[ROW][C]23[/C][C]-0.026172[/C][C]-0.201[/C][C]0.420684[/C][/ROW]
[ROW][C]24[/C][C]-0.071736[/C][C]-0.551[/C][C]0.291853[/C][/ROW]
[ROW][C]25[/C][C]0.127082[/C][C]0.9761[/C][C]0.166491[/C][/ROW]
[ROW][C]26[/C][C]0.084321[/C][C]0.6477[/C][C]0.259851[/C][/ROW]
[ROW][C]27[/C][C]0.003018[/C][C]0.0232[/C][C]0.490792[/C][/ROW]
[ROW][C]28[/C][C]-0.027064[/C][C]-0.2079[/C][C]0.418017[/C][/ROW]
[ROW][C]29[/C][C]-0.059012[/C][C]-0.4533[/C][C]0.326006[/C][/ROW]
[ROW][C]30[/C][C]-0.086588[/C][C]-0.6651[/C][C]0.254289[/C][/ROW]
[ROW][C]31[/C][C]-0.076756[/C][C]-0.5896[/C][C]0.278864[/C][/ROW]
[ROW][C]32[/C][C]-0.017378[/C][C]-0.1335[/C][C]0.447133[/C][/ROW]
[ROW][C]33[/C][C]0.040213[/C][C]0.3089[/C][C]0.379249[/C][/ROW]
[ROW][C]34[/C][C]-0.065856[/C][C]-0.5058[/C][C]0.307424[/C][/ROW]
[ROW][C]35[/C][C]0.021815[/C][C]0.1676[/C][C]0.43375[/C][/ROW]
[ROW][C]36[/C][C]0.002084[/C][C]0.016[/C][C]0.49364[/C][/ROW]
[/TABLE]
Source: https://freestatistics.org/blog/index.php?pk=30638&T=1

Globally Unique Identifier (entire table): ba.freestatistics.org/blog/index.php?pk=30638&T=1

As an alternative you can also use a QR Code:  

The GUIDs for individual cells are displayed in the table below:

Autocorrelation Function
Time lag kACF(k)T-STATP-value
10.2030131.55940.062128
20.0663020.50930.306229
30.1501541.15340.126708
40.2277461.74930.042715
50.0469150.36040.359933
6-0.041835-0.32130.374544
70.2191371.68320.048808
8-0.016123-0.12380.450929
9-0.132012-1.0140.157361
100.0877640.67410.251431
110.2757522.11810.019195
12-0.025595-0.19660.42241
13-0.119725-0.91960.180756
14-0.037614-0.28890.386828
150.1323081.01630.156823
16-0.141926-1.09020.140038
17-0.185644-1.4260.079575
18-0.056351-0.43280.333356
19-0.198989-1.52850.065871
20-0.151525-1.16390.124578
21-0.035466-0.27240.393124
220.0803570.61720.269728
23-0.026172-0.2010.420684
24-0.071736-0.5510.291853
250.1270820.97610.166491
260.0843210.64770.259851
270.0030180.02320.490792
28-0.027064-0.20790.418017
29-0.059012-0.45330.326006
30-0.086588-0.66510.254289
31-0.076756-0.58960.278864
32-0.017378-0.13350.447133
330.0402130.30890.379249
34-0.065856-0.50580.307424
350.0218150.16760.43375
360.0020840.0160.49364


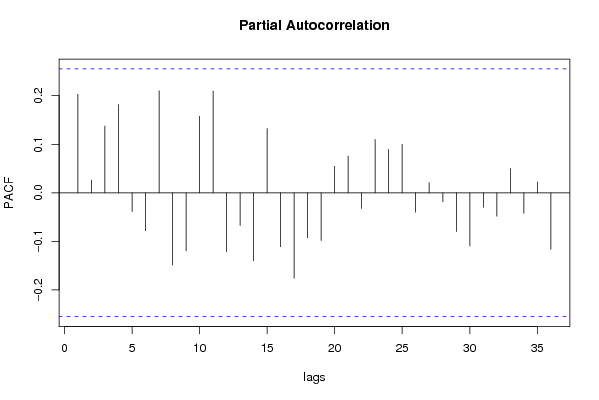
Partial Autocorrelation Function
Time lag kPACF(k)T-STATP-value
10.2030131.55940.062128
20.0261660.2010.4207
30.1374911.05610.147617
40.1816511.39530.084079
5-0.038652-0.29690.383796
6-0.077988-0.5990.275719
70.2102221.61470.055851
8-0.148951-1.14410.128598
9-0.119411-0.91720.181382
100.1577031.21130.115297
110.2097581.61120.056238
12-0.121407-0.93250.177428
13-0.067156-0.51580.303949
14-0.140066-1.07590.143182
150.1322771.0160.15688
16-0.111076-0.85320.198503
17-0.175908-1.35120.090899
18-0.092533-0.71080.240016
19-0.098289-0.7550.226634
200.0546820.420.337998
210.0756610.58120.281673
22-0.032187-0.24720.402794
230.1096940.84260.201434
240.0893570.68640.247586
250.1000960.76890.222524
26-0.040008-0.30730.379844
270.0209190.16070.436446
28-0.018339-0.14090.444229
29-0.079953-0.61410.270745
30-0.109589-0.84180.201658
31-0.029802-0.22890.409865
32-0.048299-0.3710.355986
330.0498630.3830.351547
34-0.04212-0.32350.37372
350.0224720.17260.431775
36-0.116389-0.8940.187476

\begin{tabular}{lllllllll}
\hline
Partial Autocorrelation Function \tabularnewline
Time lag k & PACF(k) & T-STAT & P-value \tabularnewline
1 & 0.203013 & 1.5594 & 0.062128 \tabularnewline
2 & 0.026166 & 0.201 & 0.4207 \tabularnewline
3 & 0.137491 & 1.0561 & 0.147617 \tabularnewline
4 & 0.181651 & 1.3953 & 0.084079 \tabularnewline
5 & -0.038652 & -0.2969 & 0.383796 \tabularnewline
6 & -0.077988 & -0.599 & 0.275719 \tabularnewline
7 & 0.210222 & 1.6147 & 0.055851 \tabularnewline
8 & -0.148951 & -1.1441 & 0.128598 \tabularnewline
9 & -0.119411 & -0.9172 & 0.181382 \tabularnewline
10 & 0.157703 & 1.2113 & 0.115297 \tabularnewline
11 & 0.209758 & 1.6112 & 0.056238 \tabularnewline
12 & -0.121407 & -0.9325 & 0.177428 \tabularnewline
13 & -0.067156 & -0.5158 & 0.303949 \tabularnewline
14 & -0.140066 & -1.0759 & 0.143182 \tabularnewline
15 & 0.132277 & 1.016 & 0.15688 \tabularnewline
16 & -0.111076 & -0.8532 & 0.198503 \tabularnewline
17 & -0.175908 & -1.3512 & 0.090899 \tabularnewline
18 & -0.092533 & -0.7108 & 0.240016 \tabularnewline
19 & -0.098289 & -0.755 & 0.226634 \tabularnewline
20 & 0.054682 & 0.42 & 0.337998 \tabularnewline
21 & 0.075661 & 0.5812 & 0.281673 \tabularnewline
22 & -0.032187 & -0.2472 & 0.402794 \tabularnewline
23 & 0.109694 & 0.8426 & 0.201434 \tabularnewline
24 & 0.089357 & 0.6864 & 0.247586 \tabularnewline
25 & 0.100096 & 0.7689 & 0.222524 \tabularnewline
26 & -0.040008 & -0.3073 & 0.379844 \tabularnewline
27 & 0.020919 & 0.1607 & 0.436446 \tabularnewline
28 & -0.018339 & -0.1409 & 0.444229 \tabularnewline
29 & -0.079953 & -0.6141 & 0.270745 \tabularnewline
30 & -0.109589 & -0.8418 & 0.201658 \tabularnewline
31 & -0.029802 & -0.2289 & 0.409865 \tabularnewline
32 & -0.048299 & -0.371 & 0.355986 \tabularnewline
33 & 0.049863 & 0.383 & 0.351547 \tabularnewline
34 & -0.04212 & -0.3235 & 0.37372 \tabularnewline
35 & 0.022472 & 0.1726 & 0.431775 \tabularnewline
36 & -0.116389 & -0.894 & 0.187476 \tabularnewline
\hline
\end{tabular}
%Source: https://freestatistics.org/blog/index.php?pk=30638&T=2

[TABLE]
[ROW][C]Partial Autocorrelation Function[/C][/ROW]
[ROW][C]Time lag k[/C][C]PACF(k)[/C][C]T-STAT[/C][C]P-value[/C][/ROW]
[ROW][C]1[/C][C]0.203013[/C][C]1.5594[/C][C]0.062128[/C][/ROW]
[ROW][C]2[/C][C]0.026166[/C][C]0.201[/C][C]0.4207[/C][/ROW]
[ROW][C]3[/C][C]0.137491[/C][C]1.0561[/C][C]0.147617[/C][/ROW]
[ROW][C]4[/C][C]0.181651[/C][C]1.3953[/C][C]0.084079[/C][/ROW]
[ROW][C]5[/C][C]-0.038652[/C][C]-0.2969[/C][C]0.383796[/C][/ROW]
[ROW][C]6[/C][C]-0.077988[/C][C]-0.599[/C][C]0.275719[/C][/ROW]
[ROW][C]7[/C][C]0.210222[/C][C]1.6147[/C][C]0.055851[/C][/ROW]
[ROW][C]8[/C][C]-0.148951[/C][C]-1.1441[/C][C]0.128598[/C][/ROW]
[ROW][C]9[/C][C]-0.119411[/C][C]-0.9172[/C][C]0.181382[/C][/ROW]
[ROW][C]10[/C][C]0.157703[/C][C]1.2113[/C][C]0.115297[/C][/ROW]
[ROW][C]11[/C][C]0.209758[/C][C]1.6112[/C][C]0.056238[/C][/ROW]
[ROW][C]12[/C][C]-0.121407[/C][C]-0.9325[/C][C]0.177428[/C][/ROW]
[ROW][C]13[/C][C]-0.067156[/C][C]-0.5158[/C][C]0.303949[/C][/ROW]
[ROW][C]14[/C][C]-0.140066[/C][C]-1.0759[/C][C]0.143182[/C][/ROW]
[ROW][C]15[/C][C]0.132277[/C][C]1.016[/C][C]0.15688[/C][/ROW]
[ROW][C]16[/C][C]-0.111076[/C][C]-0.8532[/C][C]0.198503[/C][/ROW]
[ROW][C]17[/C][C]-0.175908[/C][C]-1.3512[/C][C]0.090899[/C][/ROW]
[ROW][C]18[/C][C]-0.092533[/C][C]-0.7108[/C][C]0.240016[/C][/ROW]
[ROW][C]19[/C][C]-0.098289[/C][C]-0.755[/C][C]0.226634[/C][/ROW]
[ROW][C]20[/C][C]0.054682[/C][C]0.42[/C][C]0.337998[/C][/ROW]
[ROW][C]21[/C][C]0.075661[/C][C]0.5812[/C][C]0.281673[/C][/ROW]
[ROW][C]22[/C][C]-0.032187[/C][C]-0.2472[/C][C]0.402794[/C][/ROW]
[ROW][C]23[/C][C]0.109694[/C][C]0.8426[/C][C]0.201434[/C][/ROW]
[ROW][C]24[/C][C]0.089357[/C][C]0.6864[/C][C]0.247586[/C][/ROW]
[ROW][C]25[/C][C]0.100096[/C][C]0.7689[/C][C]0.222524[/C][/ROW]
[ROW][C]26[/C][C]-0.040008[/C][C]-0.3073[/C][C]0.379844[/C][/ROW]
[ROW][C]27[/C][C]0.020919[/C][C]0.1607[/C][C]0.436446[/C][/ROW]
[ROW][C]28[/C][C]-0.018339[/C][C]-0.1409[/C][C]0.444229[/C][/ROW]
[ROW][C]29[/C][C]-0.079953[/C][C]-0.6141[/C][C]0.270745[/C][/ROW]
[ROW][C]30[/C][C]-0.109589[/C][C]-0.8418[/C][C]0.201658[/C][/ROW]
[ROW][C]31[/C][C]-0.029802[/C][C]-0.2289[/C][C]0.409865[/C][/ROW]
[ROW][C]32[/C][C]-0.048299[/C][C]-0.371[/C][C]0.355986[/C][/ROW]
[ROW][C]33[/C][C]0.049863[/C][C]0.383[/C][C]0.351547[/C][/ROW]
[ROW][C]34[/C][C]-0.04212[/C][C]-0.3235[/C][C]0.37372[/C][/ROW]
[ROW][C]35[/C][C]0.022472[/C][C]0.1726[/C][C]0.431775[/C][/ROW]
[ROW][C]36[/C][C]-0.116389[/C][C]-0.894[/C][C]0.187476[/C][/ROW]
[/TABLE]
Source: https://freestatistics.org/blog/index.php?pk=30638&T=2

Globally Unique Identifier (entire table): ba.freestatistics.org/blog/index.php?pk=30638&T=2

As an alternative you can also use a QR Code:  

The GUIDs for individual cells are displayed in the table below:

Partial Autocorrelation Function
Time lag kPACF(k)T-STATP-value
10.2030131.55940.062128
20.0261660.2010.4207
30.1374911.05610.147617
40.1816511.39530.084079
5-0.038652-0.29690.383796
6-0.077988-0.5990.275719
70.2102221.61470.055851
8-0.148951-1.14410.128598
9-0.119411-0.91720.181382
100.1577031.21130.115297
110.2097581.61120.056238
12-0.121407-0.93250.177428
13-0.067156-0.51580.303949
14-0.140066-1.07590.143182
150.1322771.0160.15688
16-0.111076-0.85320.198503
17-0.175908-1.35120.090899
18-0.092533-0.71080.240016
19-0.098289-0.7550.226634
200.0546820.420.337998
210.0756610.58120.281673
22-0.032187-0.24720.402794
230.1096940.84260.201434
240.0893570.68640.247586
250.1000960.76890.222524
26-0.040008-0.30730.379844
270.0209190.16070.436446
28-0.018339-0.14090.444229
29-0.079953-0.61410.270745
30-0.109589-0.84180.201658
31-0.029802-0.22890.409865
32-0.048299-0.3710.355986
330.0498630.3830.351547
34-0.04212-0.32350.37372
350.0224720.17260.431775
36-0.116389-0.8940.187476


Parameters (Session):
par1 = 36 ; par2 = 1 ; par3 = 1 ; par4 = 0 ; par5 = 12 ;
Parameters (R input):
par1 = 36 ; par2 = 1 ; par3 = 1 ; par4 = 0 ; par5 = 12 ;
R code (references can be found in the software module):
if (par1 == 'Default') {
par1 = 10*log10(length(x))
} else {
par1 <- as.numeric(par1)
}
par2 <- as.numeric(par2)
par3 <- as.numeric(par3)
par4 <- as.numeric(par4)
par5 <- as.numeric(par5)
if (par2 == 0) {
x <- log(x)
} else {
x <- (x ^ par2 - 1) / par2
}
if (par3 > 0) x <- diff(x,lag=1,difference=par3)
if (par4 > 0) x <- diff(x,lag=par5,difference=par4)
bitmap(file='pic1.png')
racf <- acf(x,par1,main='Autocorrelation',xlab='lags',ylab='ACF')
dev.off()
bitmap(file='pic2.png')
rpacf <- pacf(x,par1,main='Partial Autocorrelation',xlab='lags',ylab='PACF')
dev.off()
(myacf <- c(racf$acf))
(mypacf <- c(rpacf$acf))
lengthx <- length(x)
sqrtn <- sqrt(lengthx)
load(file='createtable')
a<-table.start()
a<-table.row.start(a)
a<-table.element(a,'Autocorrelation Function',4,TRUE)
a<-table.row.end(a)
a<-table.row.start(a)
a<-table.element(a,'Time lag k',header=TRUE)
a<-table.element(a,hyperlink('basics.htm','ACF(k)','click here for more information about the Autocorrelation Function'),header=TRUE)
a<-table.element(a,'T-STAT',header=TRUE)
a<-table.element(a,'P-value',header=TRUE)
a<-table.row.end(a)
for (i in 2:(par1+1)) {
a<-table.row.start(a)
a<-table.element(a,i-1,header=TRUE)
a<-table.element(a,round(myacf[i],6))
mytstat <- myacf[i]*sqrtn
a<-table.element(a,round(mytstat,4))
a<-table.element(a,round(1-pt(abs(mytstat),lengthx),6))
a<-table.row.end(a)
}
a<-table.end(a)
table.save(a,file='mytable.tab')
a<-table.start()
a<-table.row.start(a)
a<-table.element(a,'Partial Autocorrelation Function',4,TRUE)
a<-table.row.end(a)
a<-table.row.start(a)
a<-table.element(a,'Time lag k',header=TRUE)
a<-table.element(a,hyperlink('basics.htm','PACF(k)','click here for more information about the Partial Autocorrelation Function'),header=TRUE)
a<-table.element(a,'T-STAT',header=TRUE)
a<-table.element(a,'P-value',header=TRUE)
a<-table.row.end(a)
for (i in 1:par1) {
a<-table.row.start(a)
a<-table.element(a,i,header=TRUE)
a<-table.element(a,round(mypacf[i],6))
mytstat <- mypacf[i]*sqrtn
a<-table.element(a,round(mytstat,4))
a<-table.element(a,round(1-pt(abs(mytstat),lengthx),6))
a<-table.row.end(a)
}
a<-table.end(a)
table.save(a,file='mytable1.tab')