Free Statistics

of Irreproducible Research!

Author's title

Author*The author of this computation has been verified*
R Software Modulerwasp_autocorrelation.wasp
Title produced by software(Partial) Autocorrelation Function
Date of computationMon, 08 Dec 2008 10:51:15 -0700
Cite this page as followsStatistical Computations at FreeStatistics.org, Office for Research Development and Education, URL https://freestatistics.org/blog/index.php?v=date/2008/Dec/08/t1228758734cseywg8z7hq57sd.htm/, Retrieved Thu, 16 May 2024 07:33:53 +0000
Statistical Computations at FreeStatistics.org, Office for Research Development and Education, URL https://freestatistics.org/blog/index.php?pk=30628, Retrieved Thu, 16 May 2024 07:33:53 +0000
QR Codes:

Original text written by user:
IsPrivate?No (this computation is public)
User-defined keywords
Estimated Impact184
Family? (F = Feedback message, R = changed R code, M = changed R Module, P = changed Parameters, D = changed Data)
-     [Univariate Data Series] [data set] [2008-12-01 19:54:57] [b98453cac15ba1066b407e146608df68]
- RMP   [ARIMA Backward Selection] [ARIMA Backward Se...] [2008-12-08 10:48:08] [58bf45a666dc5198906262e8815a9722]
- RMPD    [Variance Reduction Matrix] [Variance Reductio...] [2008-12-08 11:24:27] [58bf45a666dc5198906262e8815a9722]
- RMP         [(Partial) Autocorrelation Function] [(Partial) Autocor...] [2008-12-08 17:51:15] [63db34dadd44fb018112addcdefe949f] [Current]
Feedback Forum

Post a new message
Dataseries X:
101
104
99
105
107
111
117
119
127
128
135
132
136
143
142
153
145
138
148
152
169
169
161
174
179
191
190
182
175
181
197
194
197
216
221
218
230
227
204
197
199
208
191
202
211
224
224
231
244
235
250
266
288
283
295
312
334
348
383
407


Summary of computational transaction
Raw Inputview raw input (R code)
Raw Outputview raw output of R engine
Computing time2 seconds
R Server'Sir Ronald Aylmer Fisher' @ 193.190.124.24

\begin{tabular}{lllllllll}
\hline
Summary of computational transaction \tabularnewline
Raw Input & view raw input (R code)  \tabularnewline
Raw Output & view raw output of R engine  \tabularnewline
Computing time & 2 seconds \tabularnewline
R Server & 'Sir Ronald Aylmer Fisher' @ 193.190.124.24 \tabularnewline
\hline
\end{tabular}
%Source: https://freestatistics.org/blog/index.php?pk=30628&T=0

[TABLE]
[ROW][C]Summary of computational transaction[/C][/ROW]
[ROW][C]Raw Input[/C][C]view raw input (R code) [/C][/ROW]
[ROW][C]Raw Output[/C][C]view raw output of R engine [/C][/ROW]
[ROW][C]Computing time[/C][C]2 seconds[/C][/ROW]
[ROW][C]R Server[/C][C]'Sir Ronald Aylmer Fisher' @ 193.190.124.24[/C][/ROW]
[/TABLE]
Source: https://freestatistics.org/blog/index.php?pk=30628&T=0

Globally Unique Identifier (entire table): ba.freestatistics.org/blog/index.php?pk=30628&T=0

As an alternative you can also use a QR Code:  

The GUIDs for individual cells are displayed in the table below:

Summary of computational transaction
Raw Inputview raw input (R code)
Raw Outputview raw output of R engine
Computing time2 seconds
R Server'Sir Ronald Aylmer Fisher' @ 193.190.124.24


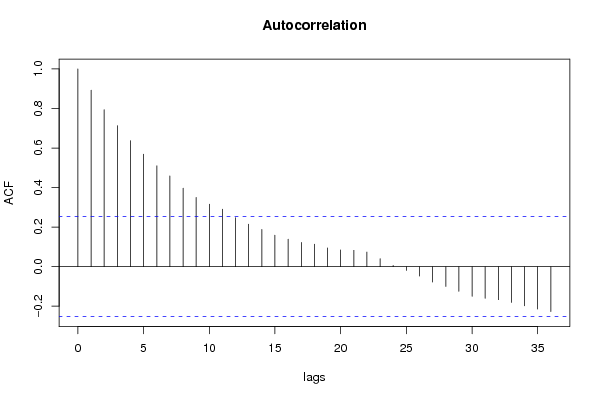
Autocorrelation Function
Time lag kACF(k)T-STATP-value
10.892186.91080
20.7935066.14650
30.7129275.52230
40.6369644.93393e-06
50.568854.40632.2e-05
60.5098143.9490.000104
70.4593.55540.000372
80.3965863.07190.001598
90.3502092.71270.004348
100.3158582.44660.008684
110.2902572.24830.014121
120.2478421.91980.029822
130.2140941.65840.051231
140.1877971.45470.075486
150.1591811.2330.111191
160.1384761.07260.143867
170.1223540.94780.173529
180.1135720.87970.191259
190.0939670.72790.234763
200.0840940.65140.258642
210.0822960.63750.263125
220.0734710.56910.285704
230.0398930.3090.379194
240.0058020.04490.482153
25-0.019129-0.14820.441352
26-0.047992-0.37170.355695
27-0.078266-0.60620.273318
28-0.100009-0.77470.220789
29-0.124251-0.96240.169844
30-0.15045-1.16540.124238
31-0.160103-1.24020.109874
32-0.167198-1.29510.100121
33-0.180848-1.40080.083205
34-0.197632-1.53090.065531
35-0.214708-1.66310.050752
36-0.226963-1.7580.04192

\begin{tabular}{lllllllll}
\hline
Autocorrelation Function \tabularnewline
Time lag k & ACF(k) & T-STAT & P-value \tabularnewline
1 & 0.89218 & 6.9108 & 0 \tabularnewline
2 & 0.793506 & 6.1465 & 0 \tabularnewline
3 & 0.712927 & 5.5223 & 0 \tabularnewline
4 & 0.636964 & 4.9339 & 3e-06 \tabularnewline
5 & 0.56885 & 4.4063 & 2.2e-05 \tabularnewline
6 & 0.509814 & 3.949 & 0.000104 \tabularnewline
7 & 0.459 & 3.5554 & 0.000372 \tabularnewline
8 & 0.396586 & 3.0719 & 0.001598 \tabularnewline
9 & 0.350209 & 2.7127 & 0.004348 \tabularnewline
10 & 0.315858 & 2.4466 & 0.008684 \tabularnewline
11 & 0.290257 & 2.2483 & 0.014121 \tabularnewline
12 & 0.247842 & 1.9198 & 0.029822 \tabularnewline
13 & 0.214094 & 1.6584 & 0.051231 \tabularnewline
14 & 0.187797 & 1.4547 & 0.075486 \tabularnewline
15 & 0.159181 & 1.233 & 0.111191 \tabularnewline
16 & 0.138476 & 1.0726 & 0.143867 \tabularnewline
17 & 0.122354 & 0.9478 & 0.173529 \tabularnewline
18 & 0.113572 & 0.8797 & 0.191259 \tabularnewline
19 & 0.093967 & 0.7279 & 0.234763 \tabularnewline
20 & 0.084094 & 0.6514 & 0.258642 \tabularnewline
21 & 0.082296 & 0.6375 & 0.263125 \tabularnewline
22 & 0.073471 & 0.5691 & 0.285704 \tabularnewline
23 & 0.039893 & 0.309 & 0.379194 \tabularnewline
24 & 0.005802 & 0.0449 & 0.482153 \tabularnewline
25 & -0.019129 & -0.1482 & 0.441352 \tabularnewline
26 & -0.047992 & -0.3717 & 0.355695 \tabularnewline
27 & -0.078266 & -0.6062 & 0.273318 \tabularnewline
28 & -0.100009 & -0.7747 & 0.220789 \tabularnewline
29 & -0.124251 & -0.9624 & 0.169844 \tabularnewline
30 & -0.15045 & -1.1654 & 0.124238 \tabularnewline
31 & -0.160103 & -1.2402 & 0.109874 \tabularnewline
32 & -0.167198 & -1.2951 & 0.100121 \tabularnewline
33 & -0.180848 & -1.4008 & 0.083205 \tabularnewline
34 & -0.197632 & -1.5309 & 0.065531 \tabularnewline
35 & -0.214708 & -1.6631 & 0.050752 \tabularnewline
36 & -0.226963 & -1.758 & 0.04192 \tabularnewline
\hline
\end{tabular}
%Source: https://freestatistics.org/blog/index.php?pk=30628&T=1

[TABLE]
[ROW][C]Autocorrelation Function[/C][/ROW]
[ROW][C]Time lag k[/C][C]ACF(k)[/C][C]T-STAT[/C][C]P-value[/C][/ROW]
[ROW][C]1[/C][C]0.89218[/C][C]6.9108[/C][C]0[/C][/ROW]
[ROW][C]2[/C][C]0.793506[/C][C]6.1465[/C][C]0[/C][/ROW]
[ROW][C]3[/C][C]0.712927[/C][C]5.5223[/C][C]0[/C][/ROW]
[ROW][C]4[/C][C]0.636964[/C][C]4.9339[/C][C]3e-06[/C][/ROW]
[ROW][C]5[/C][C]0.56885[/C][C]4.4063[/C][C]2.2e-05[/C][/ROW]
[ROW][C]6[/C][C]0.509814[/C][C]3.949[/C][C]0.000104[/C][/ROW]
[ROW][C]7[/C][C]0.459[/C][C]3.5554[/C][C]0.000372[/C][/ROW]
[ROW][C]8[/C][C]0.396586[/C][C]3.0719[/C][C]0.001598[/C][/ROW]
[ROW][C]9[/C][C]0.350209[/C][C]2.7127[/C][C]0.004348[/C][/ROW]
[ROW][C]10[/C][C]0.315858[/C][C]2.4466[/C][C]0.008684[/C][/ROW]
[ROW][C]11[/C][C]0.290257[/C][C]2.2483[/C][C]0.014121[/C][/ROW]
[ROW][C]12[/C][C]0.247842[/C][C]1.9198[/C][C]0.029822[/C][/ROW]
[ROW][C]13[/C][C]0.214094[/C][C]1.6584[/C][C]0.051231[/C][/ROW]
[ROW][C]14[/C][C]0.187797[/C][C]1.4547[/C][C]0.075486[/C][/ROW]
[ROW][C]15[/C][C]0.159181[/C][C]1.233[/C][C]0.111191[/C][/ROW]
[ROW][C]16[/C][C]0.138476[/C][C]1.0726[/C][C]0.143867[/C][/ROW]
[ROW][C]17[/C][C]0.122354[/C][C]0.9478[/C][C]0.173529[/C][/ROW]
[ROW][C]18[/C][C]0.113572[/C][C]0.8797[/C][C]0.191259[/C][/ROW]
[ROW][C]19[/C][C]0.093967[/C][C]0.7279[/C][C]0.234763[/C][/ROW]
[ROW][C]20[/C][C]0.084094[/C][C]0.6514[/C][C]0.258642[/C][/ROW]
[ROW][C]21[/C][C]0.082296[/C][C]0.6375[/C][C]0.263125[/C][/ROW]
[ROW][C]22[/C][C]0.073471[/C][C]0.5691[/C][C]0.285704[/C][/ROW]
[ROW][C]23[/C][C]0.039893[/C][C]0.309[/C][C]0.379194[/C][/ROW]
[ROW][C]24[/C][C]0.005802[/C][C]0.0449[/C][C]0.482153[/C][/ROW]
[ROW][C]25[/C][C]-0.019129[/C][C]-0.1482[/C][C]0.441352[/C][/ROW]
[ROW][C]26[/C][C]-0.047992[/C][C]-0.3717[/C][C]0.355695[/C][/ROW]
[ROW][C]27[/C][C]-0.078266[/C][C]-0.6062[/C][C]0.273318[/C][/ROW]
[ROW][C]28[/C][C]-0.100009[/C][C]-0.7747[/C][C]0.220789[/C][/ROW]
[ROW][C]29[/C][C]-0.124251[/C][C]-0.9624[/C][C]0.169844[/C][/ROW]
[ROW][C]30[/C][C]-0.15045[/C][C]-1.1654[/C][C]0.124238[/C][/ROW]
[ROW][C]31[/C][C]-0.160103[/C][C]-1.2402[/C][C]0.109874[/C][/ROW]
[ROW][C]32[/C][C]-0.167198[/C][C]-1.2951[/C][C]0.100121[/C][/ROW]
[ROW][C]33[/C][C]-0.180848[/C][C]-1.4008[/C][C]0.083205[/C][/ROW]
[ROW][C]34[/C][C]-0.197632[/C][C]-1.5309[/C][C]0.065531[/C][/ROW]
[ROW][C]35[/C][C]-0.214708[/C][C]-1.6631[/C][C]0.050752[/C][/ROW]
[ROW][C]36[/C][C]-0.226963[/C][C]-1.758[/C][C]0.04192[/C][/ROW]
[/TABLE]
Source: https://freestatistics.org/blog/index.php?pk=30628&T=1

Globally Unique Identifier (entire table): ba.freestatistics.org/blog/index.php?pk=30628&T=1

As an alternative you can also use a QR Code:  

The GUIDs for individual cells are displayed in the table below:

Autocorrelation Function
Time lag kACF(k)T-STATP-value
10.892186.91080
20.7935066.14650
30.7129275.52230
40.6369644.93393e-06
50.568854.40632.2e-05
60.5098143.9490.000104
70.4593.55540.000372
80.3965863.07190.001598
90.3502092.71270.004348
100.3158582.44660.008684
110.2902572.24830.014121
120.2478421.91980.029822
130.2140941.65840.051231
140.1877971.45470.075486
150.1591811.2330.111191
160.1384761.07260.143867
170.1223540.94780.173529
180.1135720.87970.191259
190.0939670.72790.234763
200.0840940.65140.258642
210.0822960.63750.263125
220.0734710.56910.285704
230.0398930.3090.379194
240.0058020.04490.482153
25-0.019129-0.14820.441352
26-0.047992-0.37170.355695
27-0.078266-0.60620.273318
28-0.100009-0.77470.220789
29-0.124251-0.96240.169844
30-0.15045-1.16540.124238
31-0.160103-1.24020.109874
32-0.167198-1.29510.100121
33-0.180848-1.40080.083205
34-0.197632-1.53090.065531
35-0.214708-1.66310.050752
36-0.226963-1.7580.04192


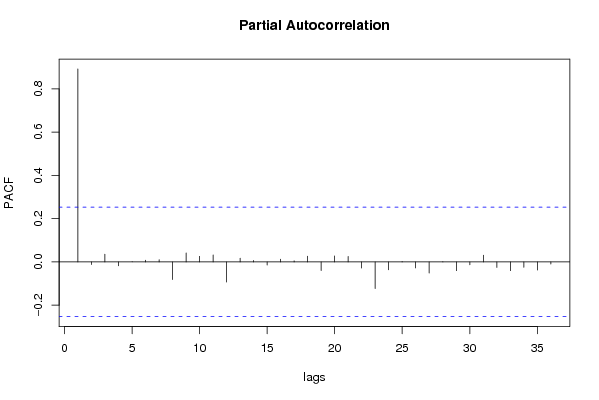
Partial Autocorrelation Function
Time lag kPACF(k)T-STATP-value
10.892186.91080
2-0.012157-0.09420.462645
30.0353750.2740.392508
4-0.018164-0.14070.44429
50.000480.00370.498524
60.007480.05790.476994
70.0104680.08110.467823
8-0.081349-0.63010.265502
90.0415060.32150.374474
100.0256850.1990.421484
110.03210.24860.402241
12-0.093042-0.72070.236945
130.0173820.13460.446675
140.0064120.04970.480275
15-0.014699-0.11390.454866
160.0128930.09990.46039
170.0049640.03840.484729
180.0260380.20170.420421
19-0.03971-0.30760.379729
200.0275530.21340.415859
210.0249960.19360.423563
22-0.028193-0.21840.413936
23-0.122669-0.95020.172913
24-0.036384-0.28180.389521
250.0014350.01110.495585
26-0.02776-0.2150.415237
27-0.050986-0.39490.347146
280.0012960.010.49601
29-0.040347-0.31250.377862
30-0.013063-0.10120.459871
310.0312140.24180.404888
32-0.025321-0.19610.422583
33-0.040354-0.31260.377843
34-0.024681-0.19120.424517
35-0.037718-0.29220.385584
36-0.009408-0.07290.471073

\begin{tabular}{lllllllll}
\hline
Partial Autocorrelation Function \tabularnewline
Time lag k & PACF(k) & T-STAT & P-value \tabularnewline
1 & 0.89218 & 6.9108 & 0 \tabularnewline
2 & -0.012157 & -0.0942 & 0.462645 \tabularnewline
3 & 0.035375 & 0.274 & 0.392508 \tabularnewline
4 & -0.018164 & -0.1407 & 0.44429 \tabularnewline
5 & 0.00048 & 0.0037 & 0.498524 \tabularnewline
6 & 0.00748 & 0.0579 & 0.476994 \tabularnewline
7 & 0.010468 & 0.0811 & 0.467823 \tabularnewline
8 & -0.081349 & -0.6301 & 0.265502 \tabularnewline
9 & 0.041506 & 0.3215 & 0.374474 \tabularnewline
10 & 0.025685 & 0.199 & 0.421484 \tabularnewline
11 & 0.0321 & 0.2486 & 0.402241 \tabularnewline
12 & -0.093042 & -0.7207 & 0.236945 \tabularnewline
13 & 0.017382 & 0.1346 & 0.446675 \tabularnewline
14 & 0.006412 & 0.0497 & 0.480275 \tabularnewline
15 & -0.014699 & -0.1139 & 0.454866 \tabularnewline
16 & 0.012893 & 0.0999 & 0.46039 \tabularnewline
17 & 0.004964 & 0.0384 & 0.484729 \tabularnewline
18 & 0.026038 & 0.2017 & 0.420421 \tabularnewline
19 & -0.03971 & -0.3076 & 0.379729 \tabularnewline
20 & 0.027553 & 0.2134 & 0.415859 \tabularnewline
21 & 0.024996 & 0.1936 & 0.423563 \tabularnewline
22 & -0.028193 & -0.2184 & 0.413936 \tabularnewline
23 & -0.122669 & -0.9502 & 0.172913 \tabularnewline
24 & -0.036384 & -0.2818 & 0.389521 \tabularnewline
25 & 0.001435 & 0.0111 & 0.495585 \tabularnewline
26 & -0.02776 & -0.215 & 0.415237 \tabularnewline
27 & -0.050986 & -0.3949 & 0.347146 \tabularnewline
28 & 0.001296 & 0.01 & 0.49601 \tabularnewline
29 & -0.040347 & -0.3125 & 0.377862 \tabularnewline
30 & -0.013063 & -0.1012 & 0.459871 \tabularnewline
31 & 0.031214 & 0.2418 & 0.404888 \tabularnewline
32 & -0.025321 & -0.1961 & 0.422583 \tabularnewline
33 & -0.040354 & -0.3126 & 0.377843 \tabularnewline
34 & -0.024681 & -0.1912 & 0.424517 \tabularnewline
35 & -0.037718 & -0.2922 & 0.385584 \tabularnewline
36 & -0.009408 & -0.0729 & 0.471073 \tabularnewline
\hline
\end{tabular}
%Source: https://freestatistics.org/blog/index.php?pk=30628&T=2

[TABLE]
[ROW][C]Partial Autocorrelation Function[/C][/ROW]
[ROW][C]Time lag k[/C][C]PACF(k)[/C][C]T-STAT[/C][C]P-value[/C][/ROW]
[ROW][C]1[/C][C]0.89218[/C][C]6.9108[/C][C]0[/C][/ROW]
[ROW][C]2[/C][C]-0.012157[/C][C]-0.0942[/C][C]0.462645[/C][/ROW]
[ROW][C]3[/C][C]0.035375[/C][C]0.274[/C][C]0.392508[/C][/ROW]
[ROW][C]4[/C][C]-0.018164[/C][C]-0.1407[/C][C]0.44429[/C][/ROW]
[ROW][C]5[/C][C]0.00048[/C][C]0.0037[/C][C]0.498524[/C][/ROW]
[ROW][C]6[/C][C]0.00748[/C][C]0.0579[/C][C]0.476994[/C][/ROW]
[ROW][C]7[/C][C]0.010468[/C][C]0.0811[/C][C]0.467823[/C][/ROW]
[ROW][C]8[/C][C]-0.081349[/C][C]-0.6301[/C][C]0.265502[/C][/ROW]
[ROW][C]9[/C][C]0.041506[/C][C]0.3215[/C][C]0.374474[/C][/ROW]
[ROW][C]10[/C][C]0.025685[/C][C]0.199[/C][C]0.421484[/C][/ROW]
[ROW][C]11[/C][C]0.0321[/C][C]0.2486[/C][C]0.402241[/C][/ROW]
[ROW][C]12[/C][C]-0.093042[/C][C]-0.7207[/C][C]0.236945[/C][/ROW]
[ROW][C]13[/C][C]0.017382[/C][C]0.1346[/C][C]0.446675[/C][/ROW]
[ROW][C]14[/C][C]0.006412[/C][C]0.0497[/C][C]0.480275[/C][/ROW]
[ROW][C]15[/C][C]-0.014699[/C][C]-0.1139[/C][C]0.454866[/C][/ROW]
[ROW][C]16[/C][C]0.012893[/C][C]0.0999[/C][C]0.46039[/C][/ROW]
[ROW][C]17[/C][C]0.004964[/C][C]0.0384[/C][C]0.484729[/C][/ROW]
[ROW][C]18[/C][C]0.026038[/C][C]0.2017[/C][C]0.420421[/C][/ROW]
[ROW][C]19[/C][C]-0.03971[/C][C]-0.3076[/C][C]0.379729[/C][/ROW]
[ROW][C]20[/C][C]0.027553[/C][C]0.2134[/C][C]0.415859[/C][/ROW]
[ROW][C]21[/C][C]0.024996[/C][C]0.1936[/C][C]0.423563[/C][/ROW]
[ROW][C]22[/C][C]-0.028193[/C][C]-0.2184[/C][C]0.413936[/C][/ROW]
[ROW][C]23[/C][C]-0.122669[/C][C]-0.9502[/C][C]0.172913[/C][/ROW]
[ROW][C]24[/C][C]-0.036384[/C][C]-0.2818[/C][C]0.389521[/C][/ROW]
[ROW][C]25[/C][C]0.001435[/C][C]0.0111[/C][C]0.495585[/C][/ROW]
[ROW][C]26[/C][C]-0.02776[/C][C]-0.215[/C][C]0.415237[/C][/ROW]
[ROW][C]27[/C][C]-0.050986[/C][C]-0.3949[/C][C]0.347146[/C][/ROW]
[ROW][C]28[/C][C]0.001296[/C][C]0.01[/C][C]0.49601[/C][/ROW]
[ROW][C]29[/C][C]-0.040347[/C][C]-0.3125[/C][C]0.377862[/C][/ROW]
[ROW][C]30[/C][C]-0.013063[/C][C]-0.1012[/C][C]0.459871[/C][/ROW]
[ROW][C]31[/C][C]0.031214[/C][C]0.2418[/C][C]0.404888[/C][/ROW]
[ROW][C]32[/C][C]-0.025321[/C][C]-0.1961[/C][C]0.422583[/C][/ROW]
[ROW][C]33[/C][C]-0.040354[/C][C]-0.3126[/C][C]0.377843[/C][/ROW]
[ROW][C]34[/C][C]-0.024681[/C][C]-0.1912[/C][C]0.424517[/C][/ROW]
[ROW][C]35[/C][C]-0.037718[/C][C]-0.2922[/C][C]0.385584[/C][/ROW]
[ROW][C]36[/C][C]-0.009408[/C][C]-0.0729[/C][C]0.471073[/C][/ROW]
[/TABLE]
Source: https://freestatistics.org/blog/index.php?pk=30628&T=2

Globally Unique Identifier (entire table): ba.freestatistics.org/blog/index.php?pk=30628&T=2

As an alternative you can also use a QR Code:  

The GUIDs for individual cells are displayed in the table below:

Partial Autocorrelation Function
Time lag kPACF(k)T-STATP-value
10.892186.91080
2-0.012157-0.09420.462645
30.0353750.2740.392508
4-0.018164-0.14070.44429
50.000480.00370.498524
60.007480.05790.476994
70.0104680.08110.467823
8-0.081349-0.63010.265502
90.0415060.32150.374474
100.0256850.1990.421484
110.03210.24860.402241
12-0.093042-0.72070.236945
130.0173820.13460.446675
140.0064120.04970.480275
15-0.014699-0.11390.454866
160.0128930.09990.46039
170.0049640.03840.484729
180.0260380.20170.420421
19-0.03971-0.30760.379729
200.0275530.21340.415859
210.0249960.19360.423563
22-0.028193-0.21840.413936
23-0.122669-0.95020.172913
24-0.036384-0.28180.389521
250.0014350.01110.495585
26-0.02776-0.2150.415237
27-0.050986-0.39490.347146
280.0012960.010.49601
29-0.040347-0.31250.377862
30-0.013063-0.10120.459871
310.0312140.24180.404888
32-0.025321-0.19610.422583
33-0.040354-0.31260.377843
34-0.024681-0.19120.424517
35-0.037718-0.29220.385584
36-0.009408-0.07290.471073


Parameters (Session):
par1 = 36 ; par2 = 1 ; par3 = 0 ; par4 = 0 ; par5 = 12 ;
Parameters (R input):
par1 = 36 ; par2 = 1 ; par3 = 0 ; par4 = 0 ; par5 = 12 ;
R code (references can be found in the software module):
if (par1 == 'Default') {
par1 = 10*log10(length(x))
} else {
par1 <- as.numeric(par1)
}
par2 <- as.numeric(par2)
par3 <- as.numeric(par3)
par4 <- as.numeric(par4)
par5 <- as.numeric(par5)
if (par2 == 0) {
x <- log(x)
} else {
x <- (x ^ par2 - 1) / par2
}
if (par3 > 0) x <- diff(x,lag=1,difference=par3)
if (par4 > 0) x <- diff(x,lag=par5,difference=par4)
bitmap(file='pic1.png')
racf <- acf(x,par1,main='Autocorrelation',xlab='lags',ylab='ACF')
dev.off()
bitmap(file='pic2.png')
rpacf <- pacf(x,par1,main='Partial Autocorrelation',xlab='lags',ylab='PACF')
dev.off()
(myacf <- c(racf$acf))
(mypacf <- c(rpacf$acf))
lengthx <- length(x)
sqrtn <- sqrt(lengthx)
load(file='createtable')
a<-table.start()
a<-table.row.start(a)
a<-table.element(a,'Autocorrelation Function',4,TRUE)
a<-table.row.end(a)
a<-table.row.start(a)
a<-table.element(a,'Time lag k',header=TRUE)
a<-table.element(a,hyperlink('basics.htm','ACF(k)','click here for more information about the Autocorrelation Function'),header=TRUE)
a<-table.element(a,'T-STAT',header=TRUE)
a<-table.element(a,'P-value',header=TRUE)
a<-table.row.end(a)
for (i in 2:(par1+1)) {
a<-table.row.start(a)
a<-table.element(a,i-1,header=TRUE)
a<-table.element(a,round(myacf[i],6))
mytstat <- myacf[i]*sqrtn
a<-table.element(a,round(mytstat,4))
a<-table.element(a,round(1-pt(abs(mytstat),lengthx),6))
a<-table.row.end(a)
}
a<-table.end(a)
table.save(a,file='mytable.tab')
a<-table.start()
a<-table.row.start(a)
a<-table.element(a,'Partial Autocorrelation Function',4,TRUE)
a<-table.row.end(a)
a<-table.row.start(a)
a<-table.element(a,'Time lag k',header=TRUE)
a<-table.element(a,hyperlink('basics.htm','PACF(k)','click here for more information about the Partial Autocorrelation Function'),header=TRUE)
a<-table.element(a,'T-STAT',header=TRUE)
a<-table.element(a,'P-value',header=TRUE)
a<-table.row.end(a)
for (i in 1:par1) {
a<-table.row.start(a)
a<-table.element(a,i,header=TRUE)
a<-table.element(a,round(mypacf[i],6))
mytstat <- mypacf[i]*sqrtn
a<-table.element(a,round(mytstat,4))
a<-table.element(a,round(1-pt(abs(mytstat),lengthx),6))
a<-table.row.end(a)
}
a<-table.end(a)
table.save(a,file='mytable1.tab')